


One of the questions that just continues to haunt me is one that I wish I had a better answer to in the data: are young men more or less religious than young women? I think I’ve written about this at least three or four times over the years. My initial impression, using data from the Cooperative Election Study, was – yes, young men are now clearly more religious than young women. But that’s before I had fully wrapped my head around some of the issues that opt-in surveys have with recruiting young people.
In more recent analysis, I think I am more convinced that the religion gender gap between young men and young women has probably narrowed significantly, if not closed completely. For what it’s worth, Pew’s Religious Landscape survey seems to point in that direction as well, which, by itself, is a pretty big deal. The fact that women are more religious than men has just been “known” by social scientists studying religion for years. So the fact that we just can’t assume that to be true anymore is certainly noteworthy.
So, consider this another entry into this whole debate but using a different data source. This time it’s FIRE’s annual survey of college students. This one is pretty tailor-made for the task at hand. The sampling frame is well suited to the goal in some ways. I mean, it’s basically all Generation Z (with a few returning adult students), and it’s got a huge sample size (over 68,000).
However, it’s not a perfect data source to definitively resolve this debate. One reason is that it’s not a random sample survey of all young adults. It’s limited to people attending about 450 universities across the United States. So, we can’t really extrapolate these findings to all of Gen Z. Also, it was an opt-in panel, which means that people voluntarily signed up to take part in the survey. That can be problematic in ways that I have described before.
But I think that this exercise is still very much worth the time and I believe that some real illumination can be derived by taking a look at these numbers.
Let’s start with just breaking down the religious affiliation of college students by gender.
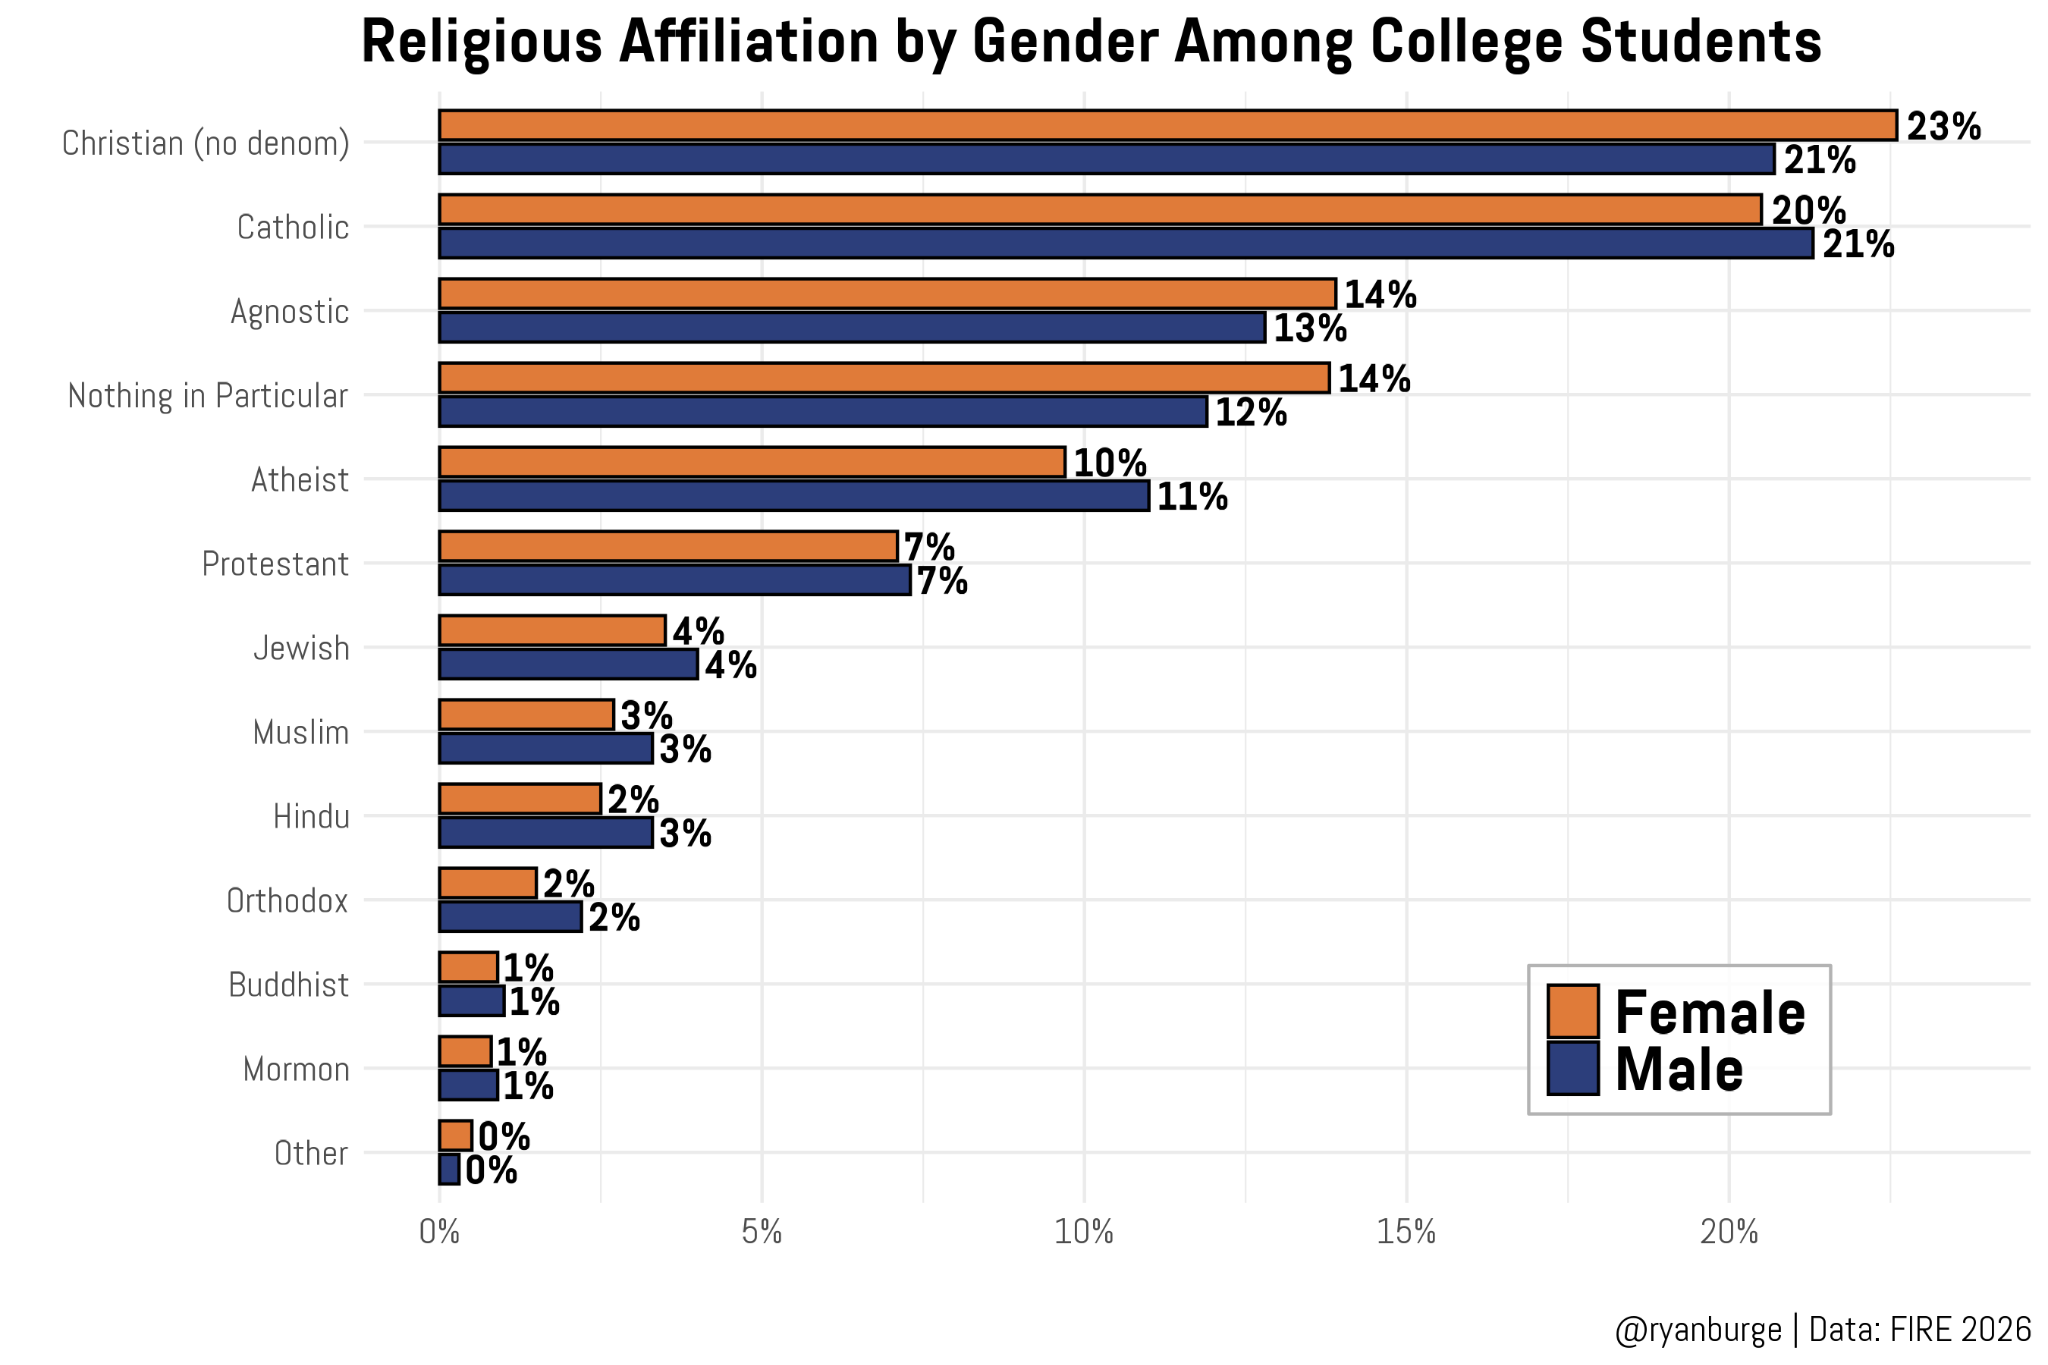
Well, this graph certainly isn’t going to go viral in any meaningful way. There just aren’t that many differences to talk about. The biggest gap is for the largest group: those who identified as just generically Christian. Among female respondents, 23% chose this option. For the men in the FIRE survey, it was 21%—a whopping two percentage points. But then men were about a point more likely to be Catholic than women, and the Protestant share was essentially a dead heat. Big whoop.
When it comes to the breakdown of non-religion, women were 1.1 points more likely to be agnostic compared to men but then men were 1.3 points more likely to be atheist. The bigger gap is among the “nothing in particulars.” For men, 11.9% chose this option compared to 13.8% for women. All that aggregates out to a non-religious rate among women at 37.4% compared to 35.7% for men.
Do I think that this is clear evidence that the gender gap has reversed? I wouldn’t go that far based on the caveats from above. But it does seem to lend some credence to the idea that the gap has now completely closed.
Let’s try religious attendance now.
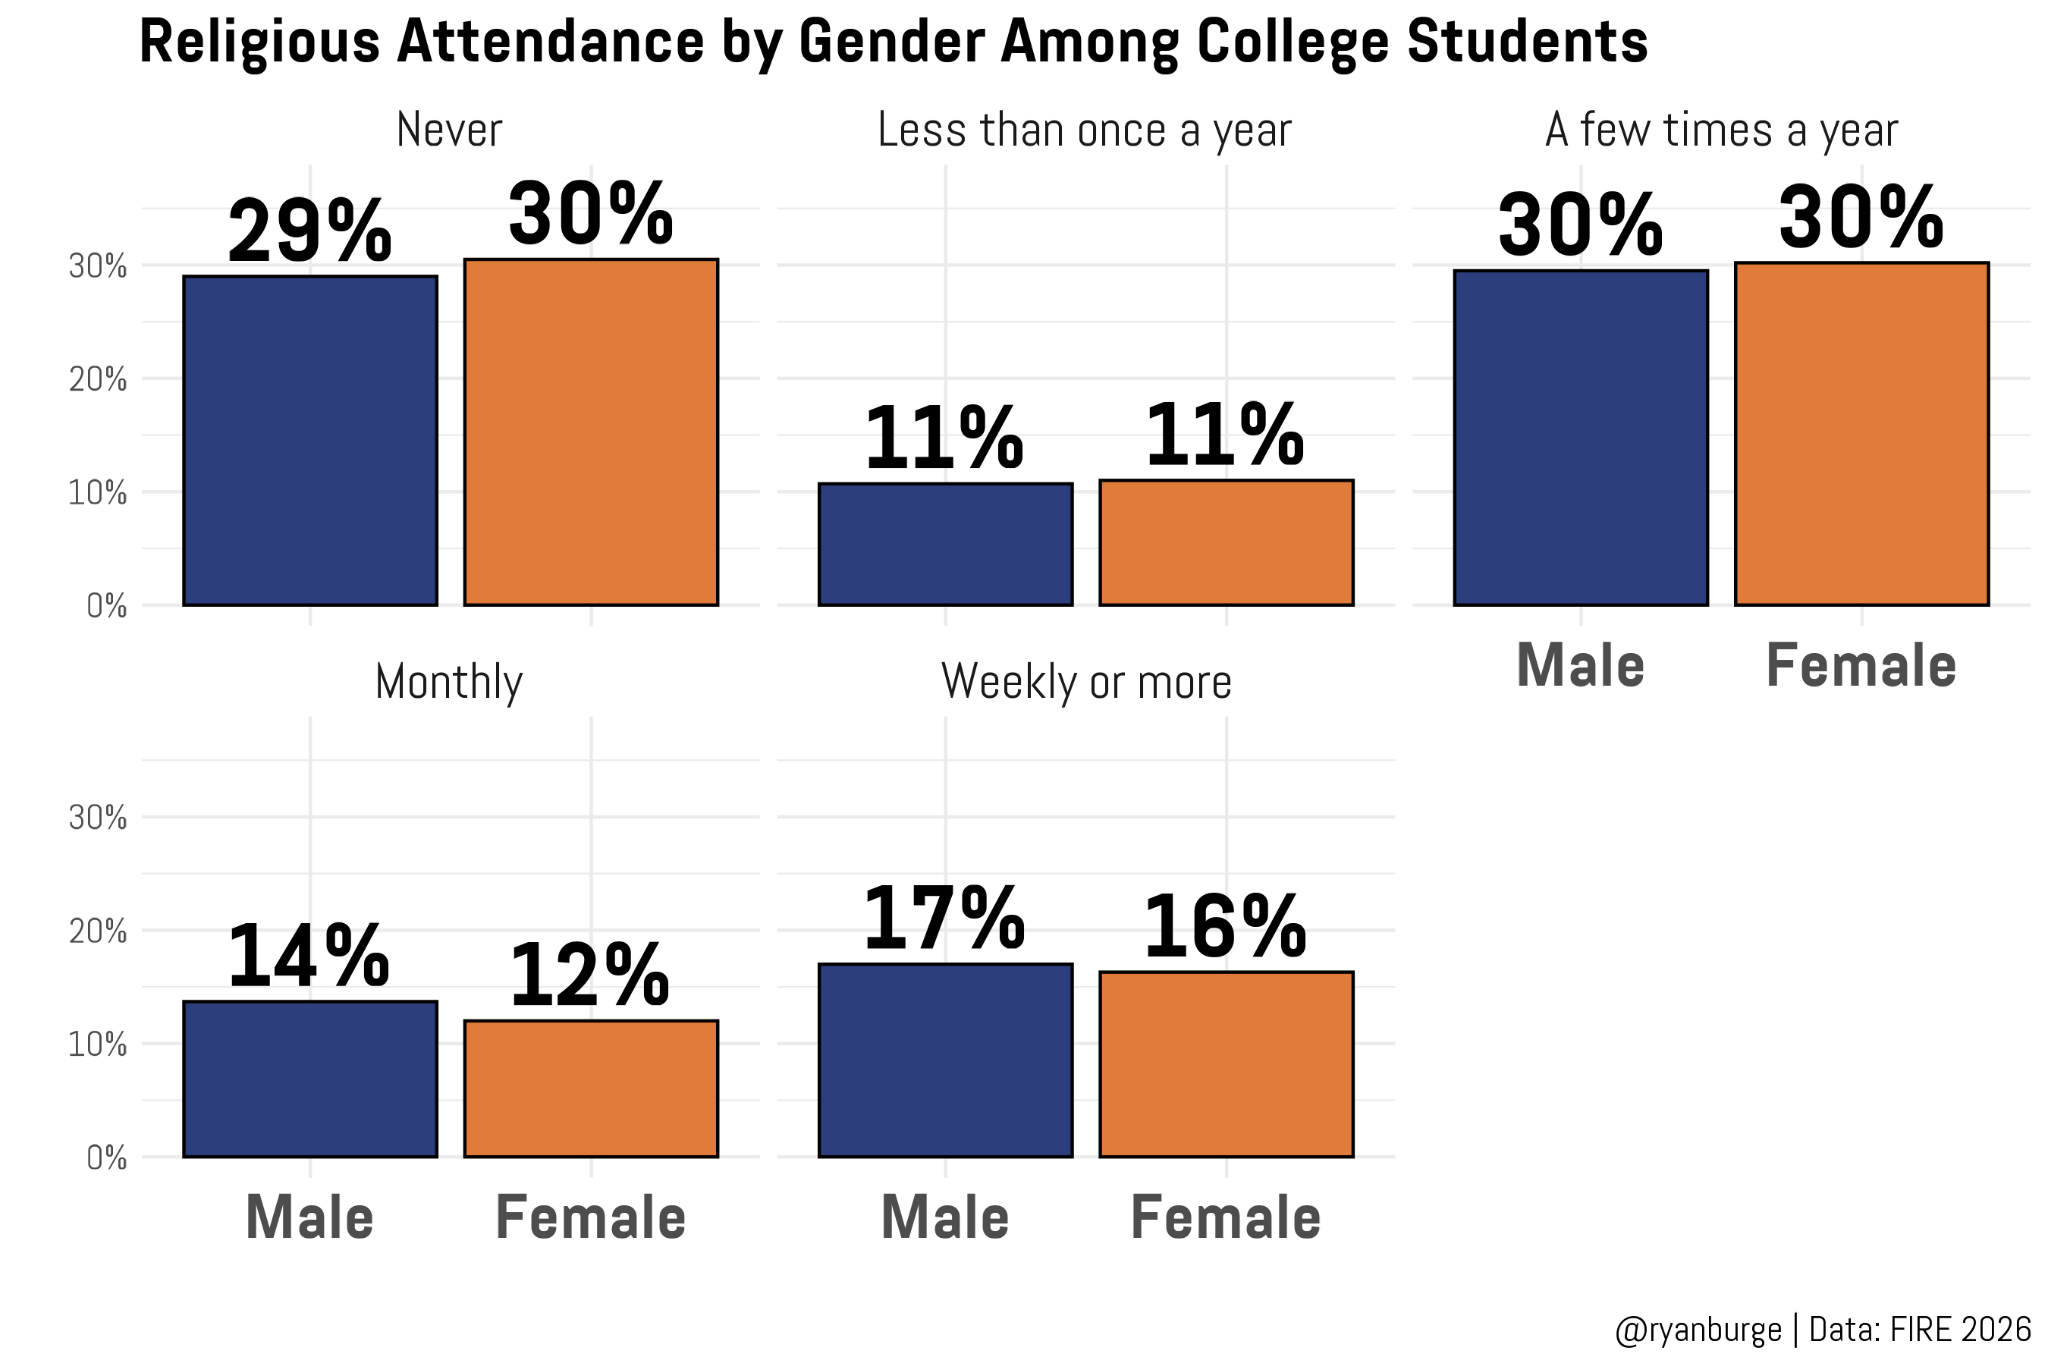
Again, comparing one level of attendance to another doesn’t really make your hair stand on end. The gaps are pretty small here, to be clear. But if you get down to the decimal points, you can see a bit of daylight. For instance, 30.5% of women report never attending services compared to 29% of men. In total, women in our sample were 1.8 points more likely to attend less than once a year compared to their male counterparts (41.5% vs 39.7%).
At the top end of the scale, the differences are there, too. Among men, 13.7% reported monthly attendance and 17% were going every week. For women, those figures were 12% and 16.3%, respectively. So, men are 2.4 points higher in the top two buckets of attendance. I think that’s pretty decent evidence of a religious reversal among young people who are attending four-year universities in the United States.
So, this is where we put on our detective hats and start groping around for a potential cause. One thing that I considered was that women and men pursue different majors in college, and we know that certain majors tend to be more religious than others. What if I just found a bunch of majors where I had a huge sample size and then calculated the share of men and women in each who were non-religious? That’s exactly what I did below.
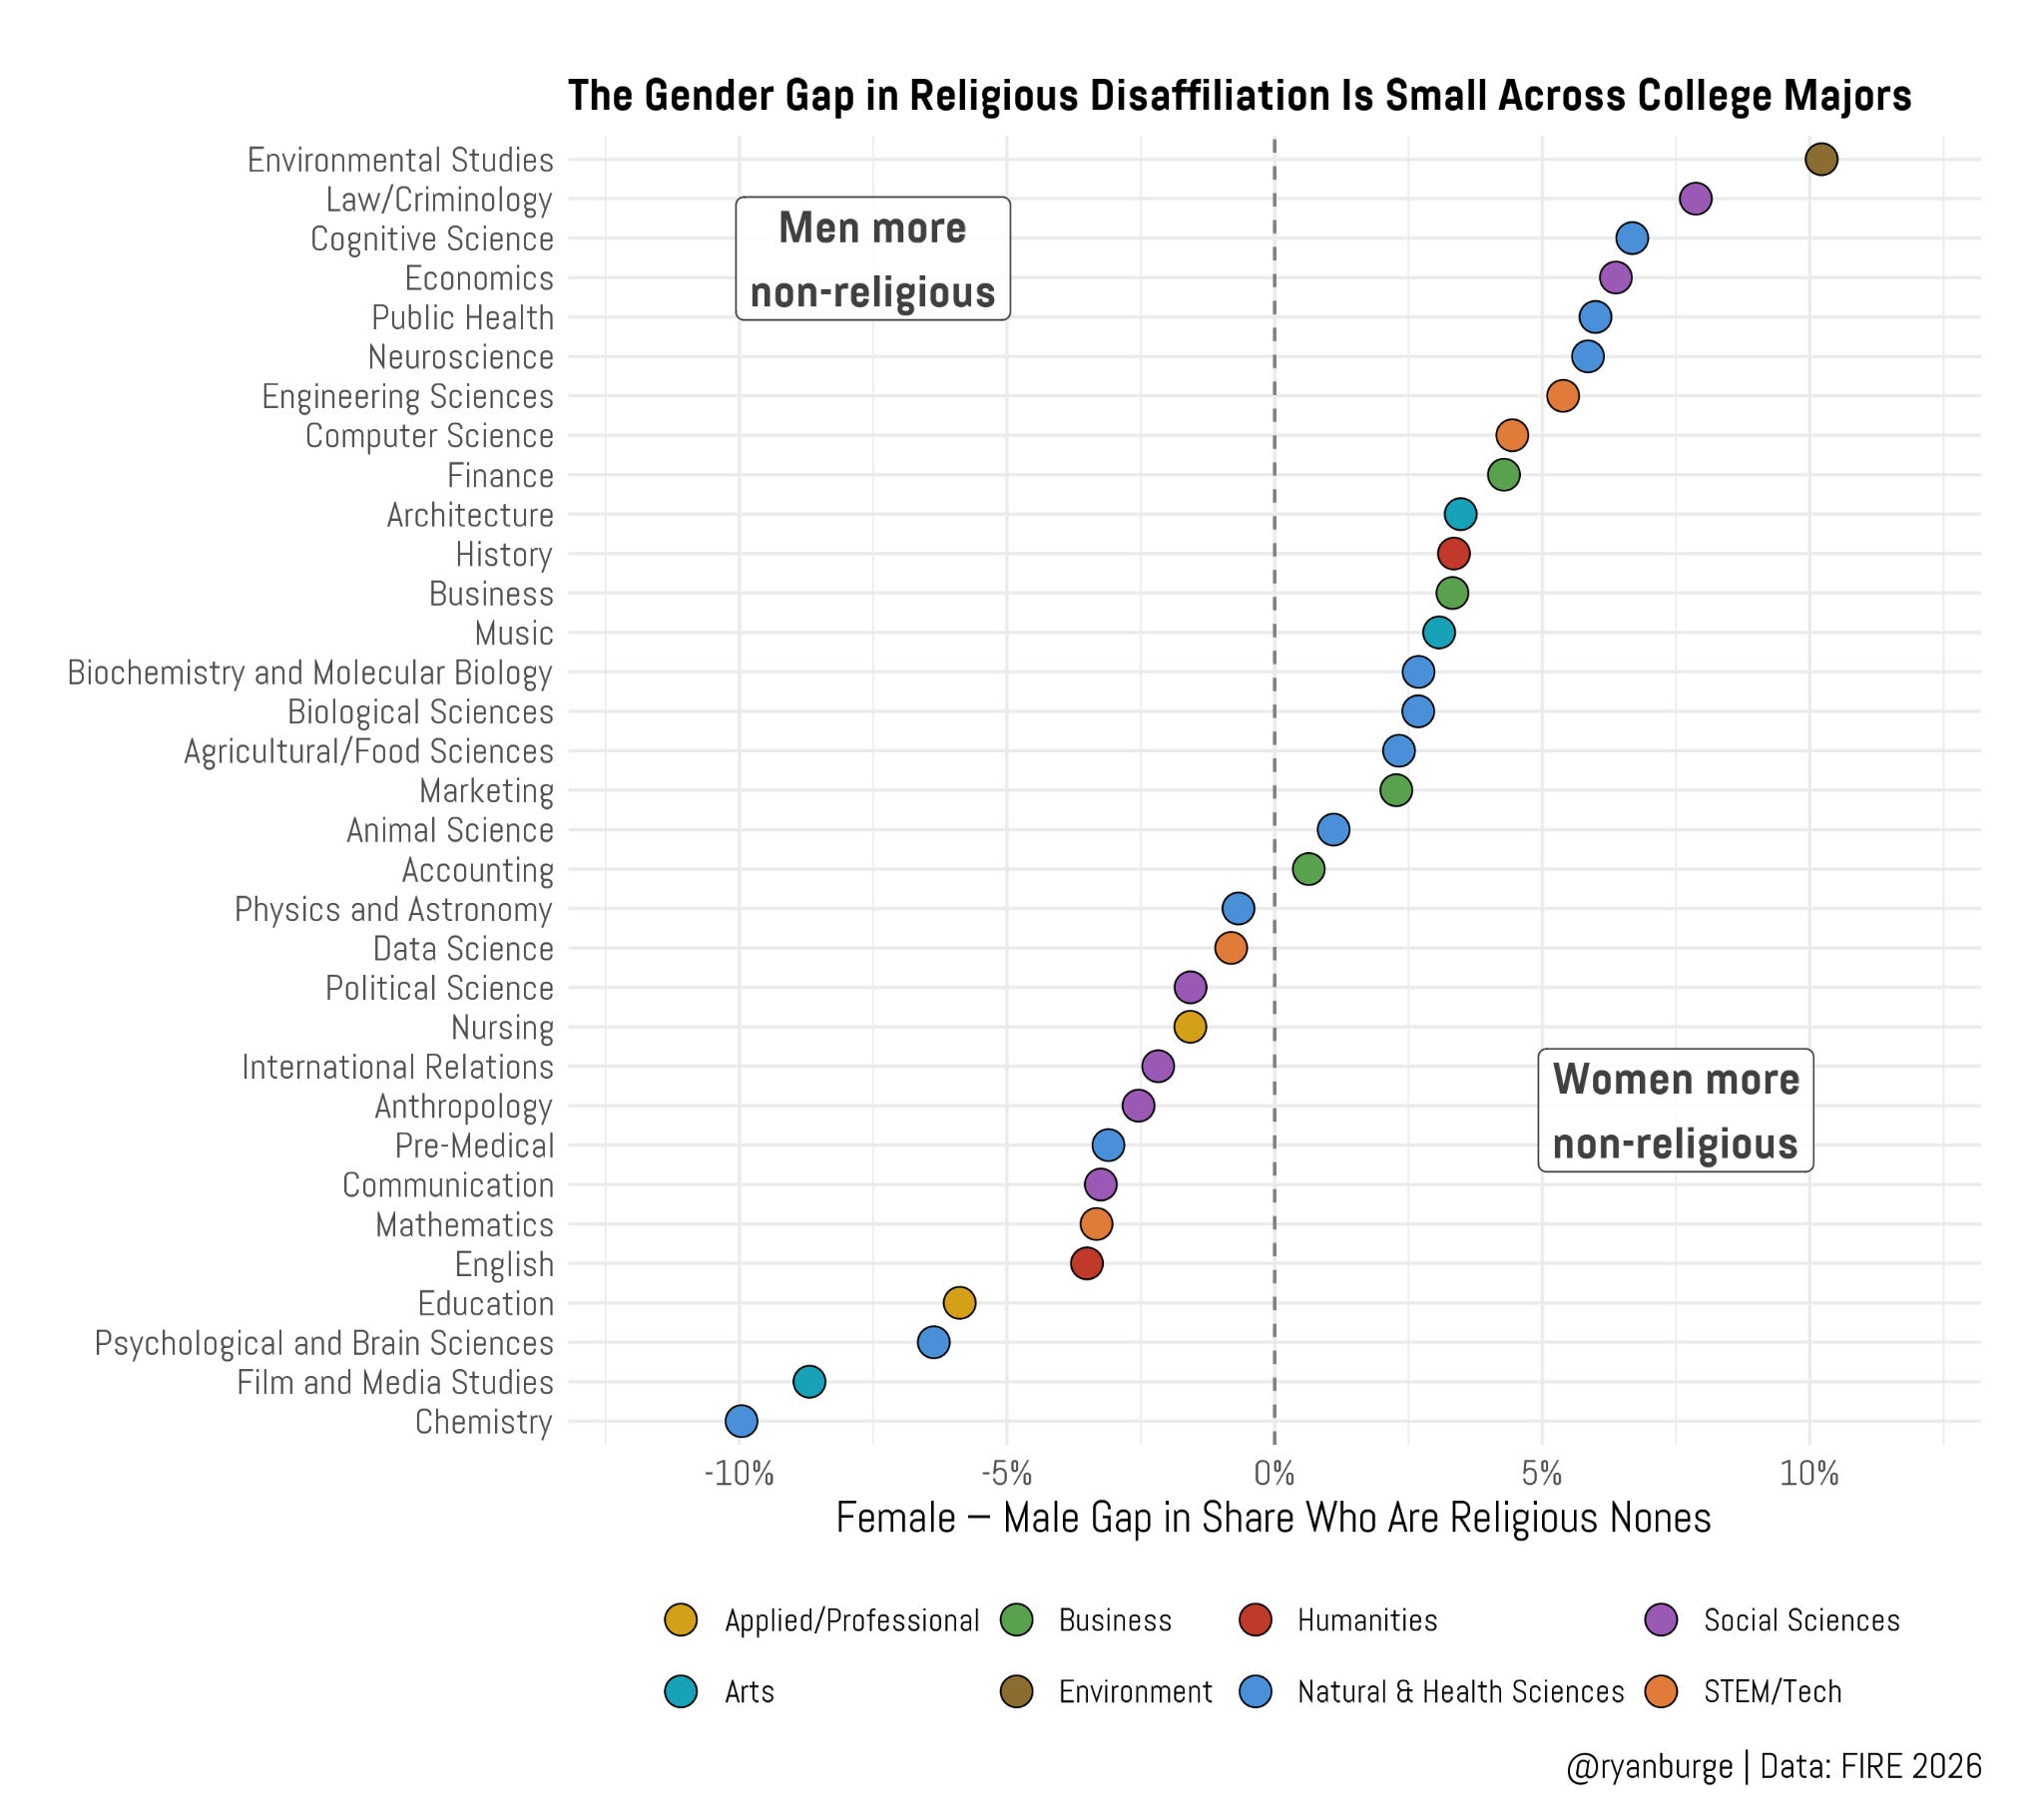
If a major is marked at zero, that means that there’s no gender imbalance in the “nones” rate, and there are a couple that are pretty close to that vertical dashed line like physics and accounting. If the point is in positive territory, then that means that women in that major were more likely to be non-religious compared to men in the same major. That’s the case for environmental studies, for sure. But that’s the only one where the differences reach double digits. For most of them, the gap just isn’t that big (often less than five percentage points).
The same is also true on the left hand side of the graph – this is where men are more likely to be nones compared to women. Chemistry is the outlier. Men in this major are about ten percentage points more likely to identify as atheist, agnostic, or nothing in particular compared to their female counterparts. But there aren’t many majors like chemistry. Instead, you have a lot of majors where the gap is 2-4 points, like mathematics and communications.
Overall, I don’t get a strong impression that the degree program of the respondent is the main driver of the gender gap. But I think you can probably make an educated guess about a difference between the two genders that may have a huge bearing on religiosity: the political ideology and partisanship of young men versus young women.
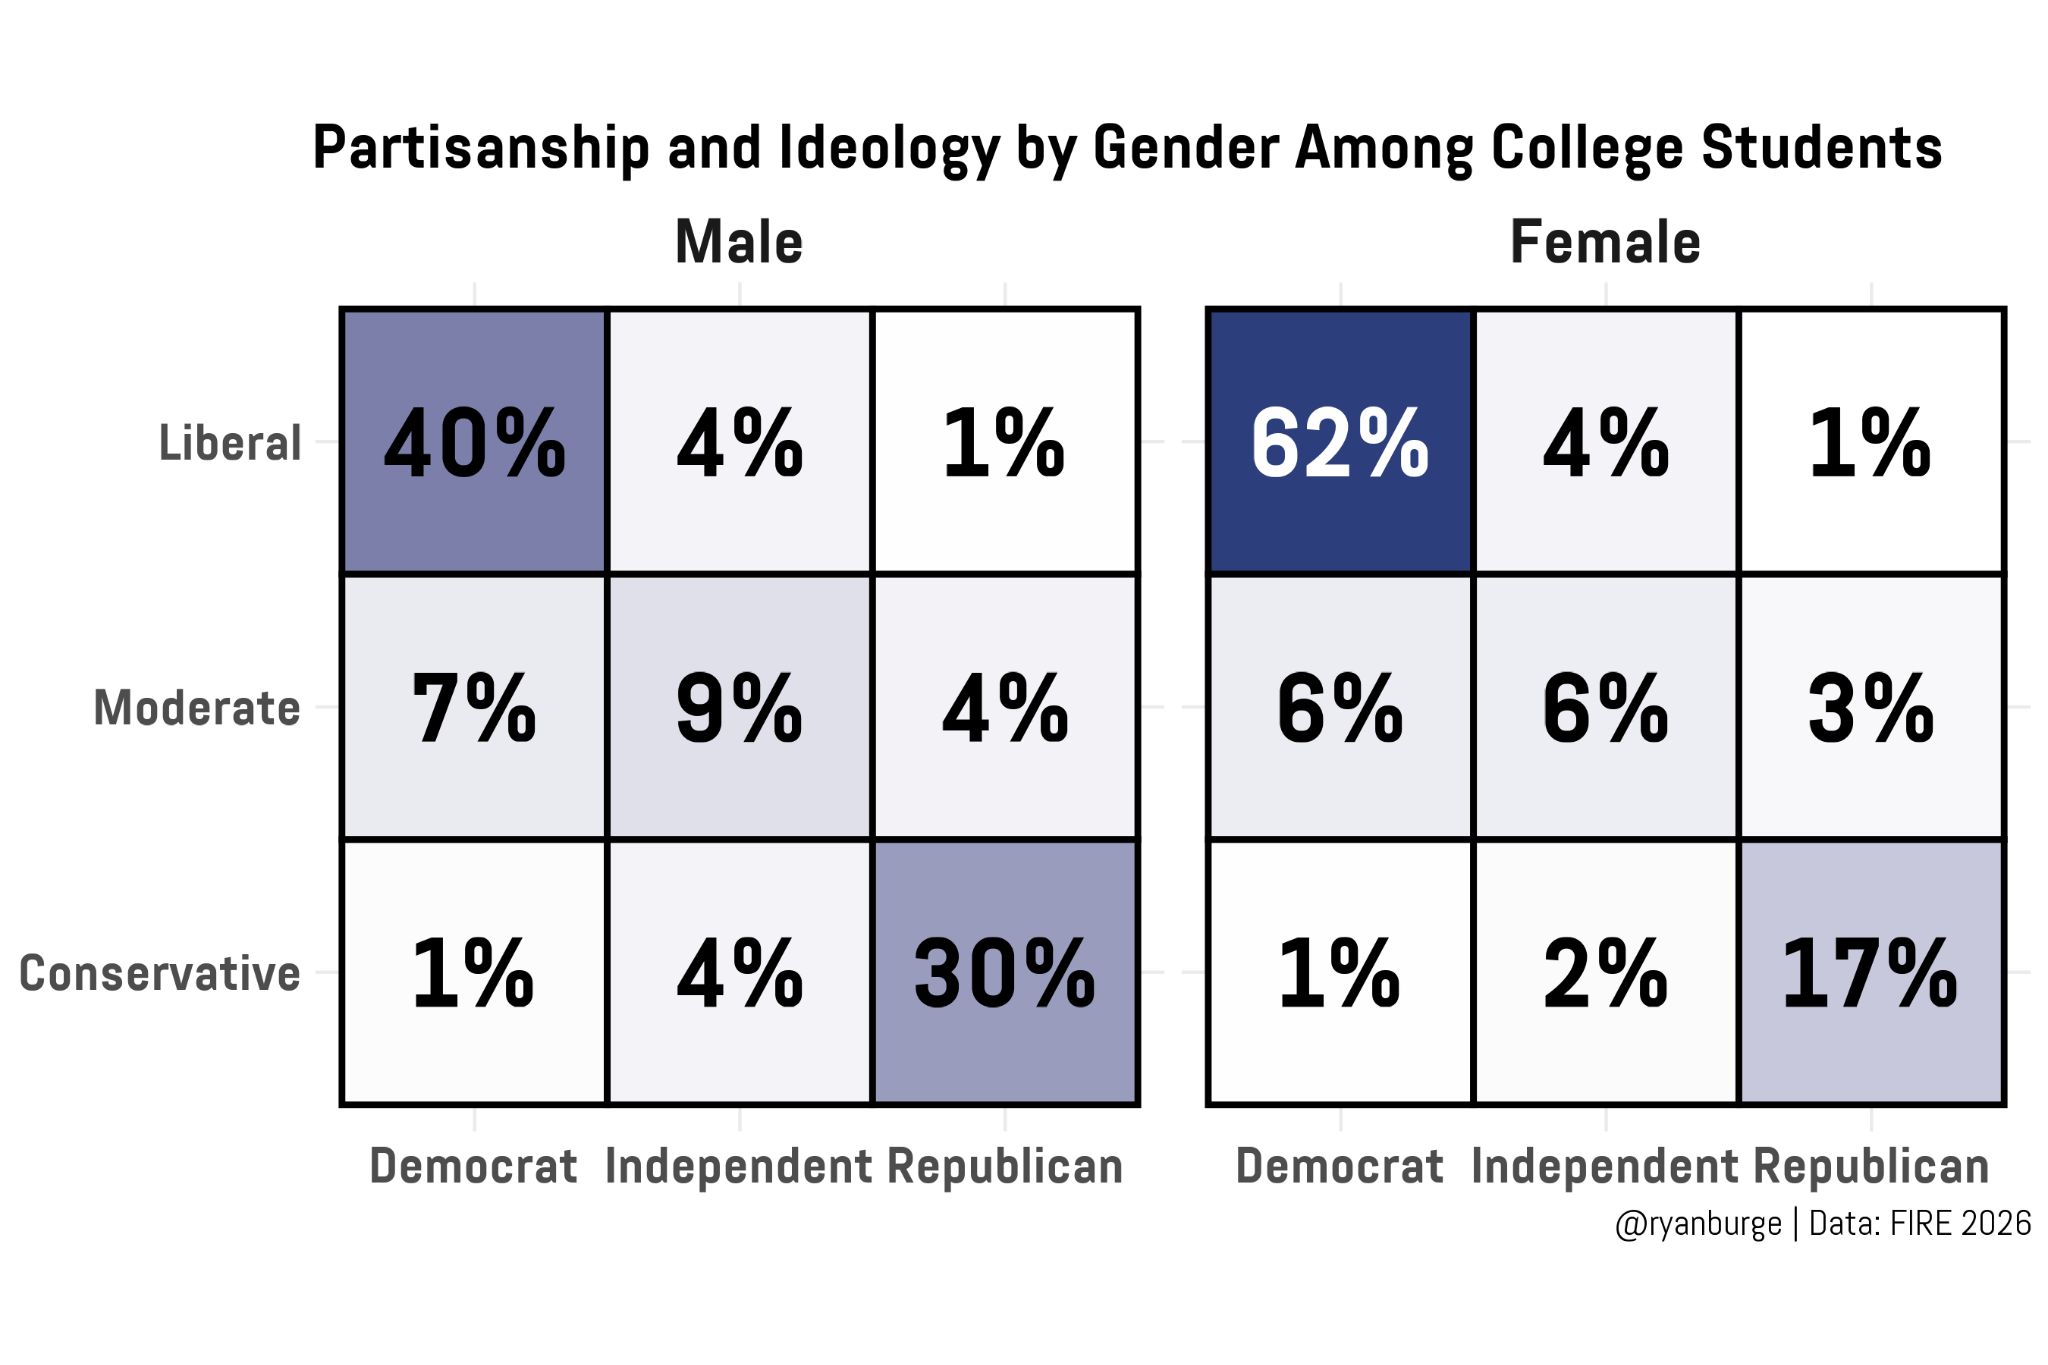
I mean, I shouldn’t be surprised at the results of this graph because of the kind of work that I do, but I think this visualization just makes it pretty plain that women attending college are just much further to the left than their male counterparts. Among young women in the FIRE sample, 62% of them say that they are liberal Democrats. For men, only 40% are in the top left corner of the heatmap.
In total, 36% of men in the sample identified as Republicans and 35% said that they were conservative. For women attending college, those numbers were 21% and 20%, respectively. There’s no other way to say this without repeating myself – the political gap on campuses between men and women is absolutely huge and it’s going to cause all kinds of problems going forward, especially when it comes to partnering and fertility.
But it also has to play a huge role in driving the differences that I just described in terms of religiosity, though. I mean, the God Gap is the dominating statistical reality in the field of religion and politics. Left-leaning people are way more likely to be nones compared to those who identify as conservative or Republican. So maybe the fact that young women are slightly less religious than young men is deeply intertwined with this political reality.
I can actually test that claim pretty easily. What would the male and female religiosity rates look like if both groups had the same political composition as the overall college-student sample? In other words, if we pushed men a bit to the left and women a bit to the right, how much would they change religious variables?
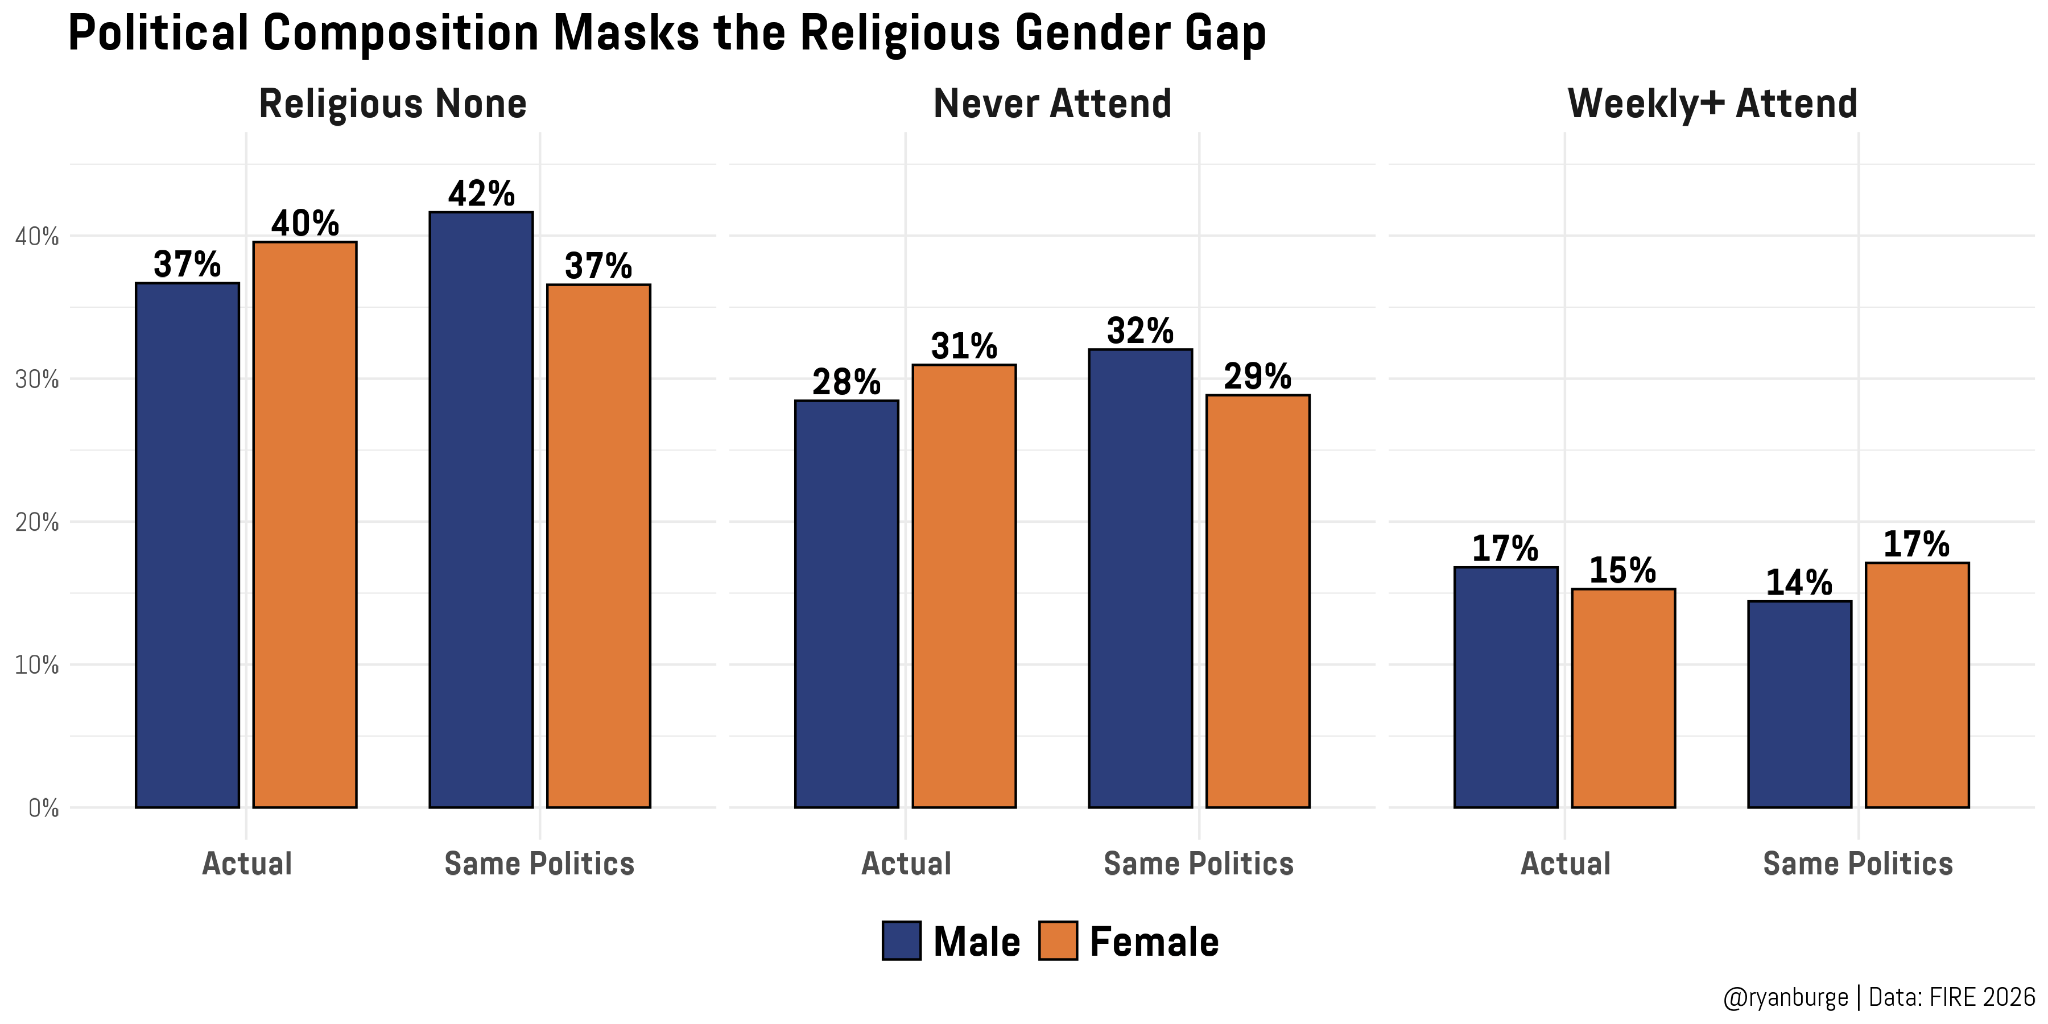
And this graph is incredibly satisfying because the answer is about as clear as it can be. If I just use the full sample, women are about 3 points more likely to be atheist, agnostic, or nothing in particular compared to men. But if we standardized the political leanings of each group, the results completely flip. Now only 37% of women have no religious affiliation compared to 42% of men. If male politics matched the full sample, their nones rate would jump by five points. If women matched the benchmark, their rate would drop by 3 points.
Then I did the exact same exercise on both ends of religious attendance. In the full sample, women were three points more likely to be never-attenders compared to men (31% vs. 28%), but if we standardized their politics, those numbers essentially flip. If men were more to the left of the political spectrum and women were more to the right, a man would be three points more likely to never go to church. And for weekly attendance, you can see the same pattern play out there, too: if politics were standardized, women are three points more likely to go every week compared to their male counterparts.
Now, let’s not generalize this finding too much. Remember, this sample doesn’t include anyone that is not attending a four-year university that was on FIRE’s list of more than 450. So we can’t make a bold universal claim. However, I do think that this is another piece of evidence that the gender gap among young adults has certainly closed. And, among college-going members of Gen Z, it’s pretty hard to not come to the conclusion that it’s probably reversed just a bit, too.
This also reinforces my suspicion that politics is playing a huge role in this shift, too. The last graph makes this plain: almost two-thirds of young women at universities identify as liberal Democrats. That has to have an impact on their religiosity, there’s just too much evidence across social science to ignore.
After this data exercise we certainly have a better sense of what is happening with young adults. However, we cannot use this data to answer the question of “why”? Are women leaving church because their politics are leaning leftward? Or are they embracing the Democratic party only after they leave the pews?
That’s a question for another day.
Code for this post can be found here.
Ryan P. Burge is a professor of practice at the Danforth Center on Religion and Politics at Washington University.

Both men and women were raised by parents who, whatever their “religion” (including atheism, nothing in particular etc), probably raised their sons and daughters the same way. But when the children got to school, they were endlessly taught that men oppress women and liberalism is the answer. So naturally the girls become political liberals and the boys conservative. Their own religion then follows.
I think this gap may continue to grow as long as the educational system is so dominated by liberals.
So if I understand the data correctly, if your church looks like my synagogue, where everyone is on Medicare, and your Future Planning Committee needs to restore its pipeline, they should recruit coeds majoring in psych at a campus MAGA event?
FIRE data has a lot of respondents, which has pluses and minuses. Since the organization has an agenda, I wonder how representative those N=68K really are of the sample of young people. My alma mater and Ryan's current university are each a big multiple of 4% Jewish, with each getting an F on the sponsor's preferred responses to their survey.
Big sampling tends to magnify small differences as significant, which Ryan does well to discount, though with a sample of 68K, a two percentage point difference may be P<0.05 when calculated. More importantly, sampling needs to be representative of the rest of the population that is not sampled. So a biopsy gets just few cells but they are representative enough to reach a conclusion. Taking universities where the sponsor intends to laud some and vilify others, with a good presampling notion of which campuses are which, may not reflect what young adults think irrespective of the large number surveyed.