

The Religious Reversal That Doesn't Make Sense
The Mystery of the Missing Nones: Why the Data is Driving Me Crazy

The Cooperative Election Study released some new data. If you’ve been a follower of this newsletter, you read about this in a post a couple of months ago. The big headline finding is that the share of Americans who claim to be atheist, agnostic, or have no religion in particular has continued to decline. It was 36% in both 2021 and 2022 but had started to slide from that all-time high. By 2024, the CES estimate for those three groups was down to 34% and then it declined even further to 32% in the most recently released data.
So, that’s a 4.4 percentage point shift between 2022 and 2025. The nones were back to their levels from 2018. That’s a big deal, clearly. In that previous post, I noted that the General Social Survey also recorded a drop in the nones: down about 3 points between 2021 and 2024. This isn’t just a single rogue survey, it’s now two different instruments (with different methodologies) arriving at a similar conclusion.
America Got a Little More Religious. No, Really.

Sorry to interrupt the regular publishing cycle of every Monday and Thursday, but I’ve got some new data and it’s led to a couple of graphs and a whole bunch of thoughts that probably need to be organized somehow.
If the nones dropped by 3-4 percentage points over the last few years, how did that happen exactly? That’s the goal of this post: trying to zoom in on a specific trend in the data that needs some more careful exploration.
The graph below was included in the previous post—it’s the share of each generation that reported no religious affiliation in the Cooperative Election Study in the last few years.
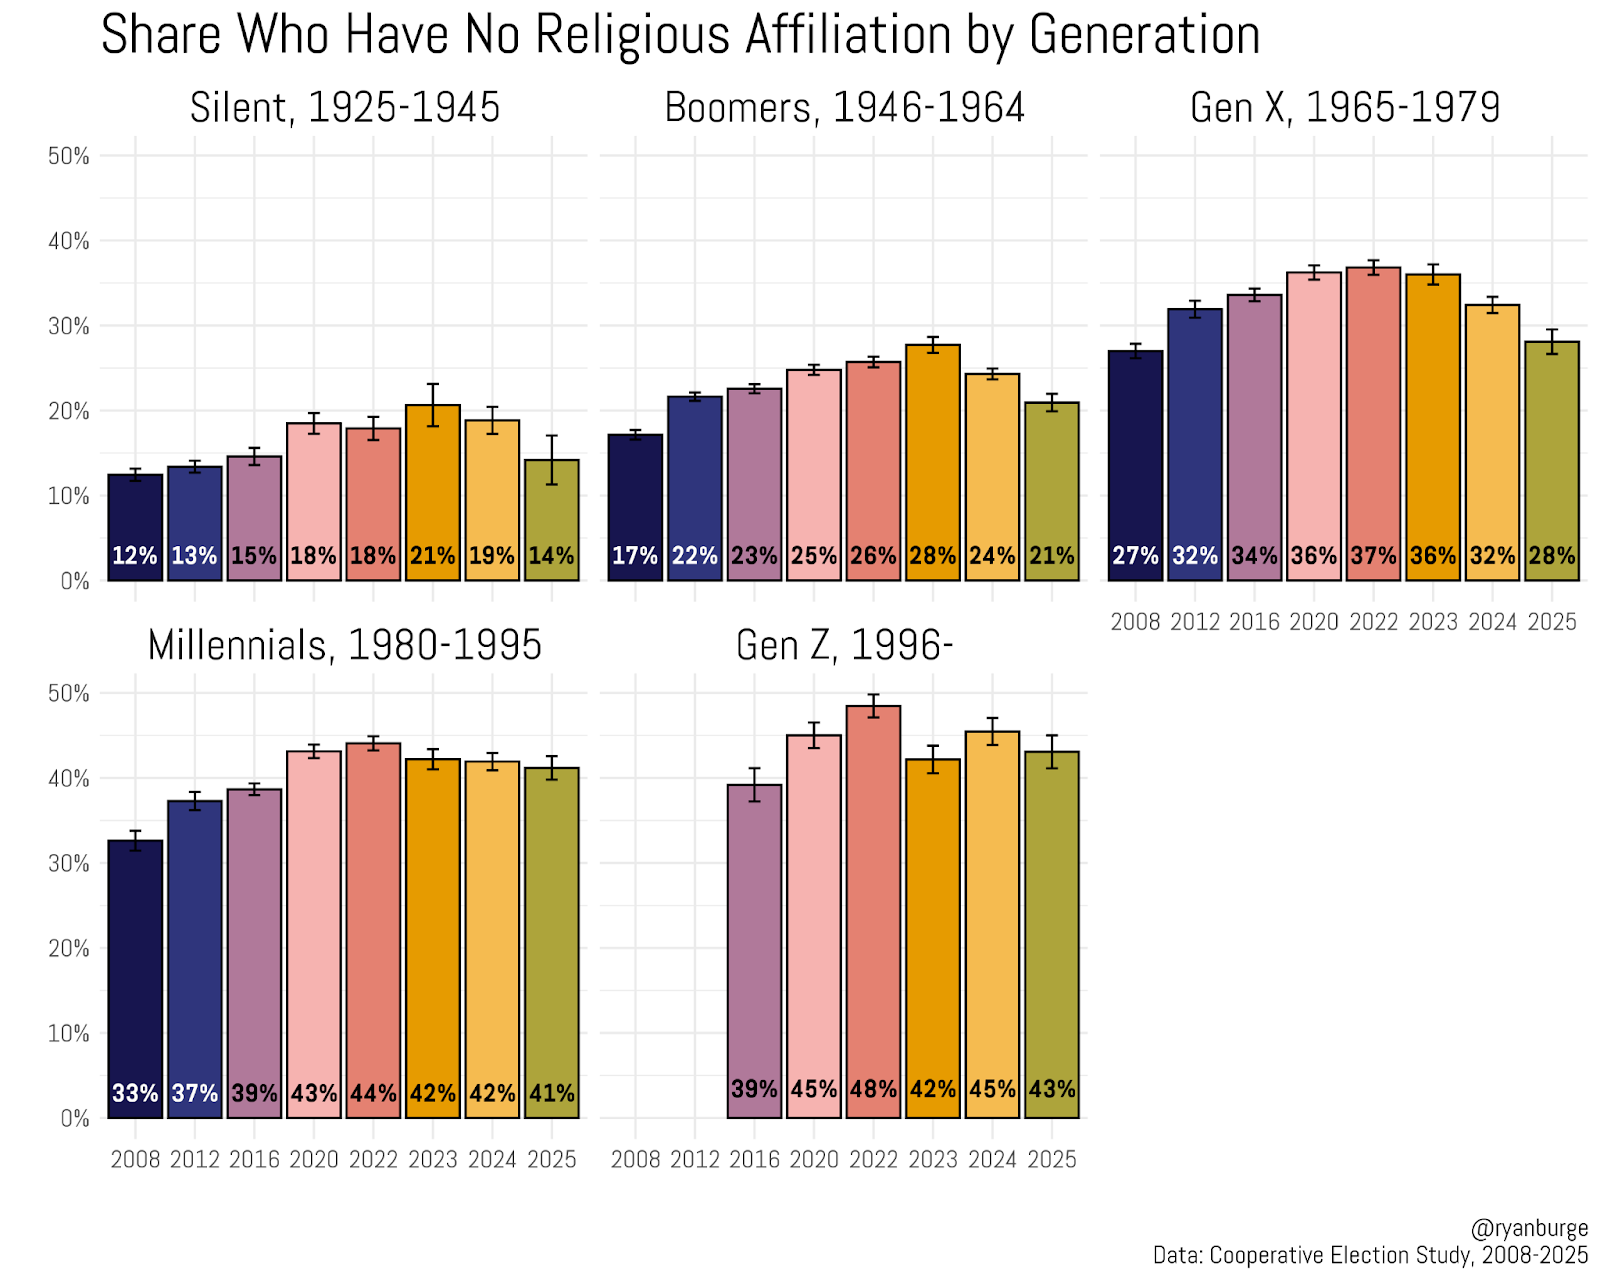
The generation that really jumped out to me for this post was the Baby Boomers. I’ve written about this group several times in the last couple of months on this newsletter. They are the most important generation in American religion right now for a couple of reasons. One is that they are numerically large. The second is that they are religiously active. And the final reason is that they are rapidly heading toward their twilight years now (the youngest Boomers are in their mid-sixties).
Notice their trajectory in the CES—it looks like the first portion of a roller coaster. A slow ascent, a clear peak, and then a rapid decline. In 2016, 23% of Boomers were non-religious. That rose to 28% by 2023. But the last two surveys have this figure at 24% and 21% respectively. That’s a return to levels seen in 2010. What in the world is happening there?
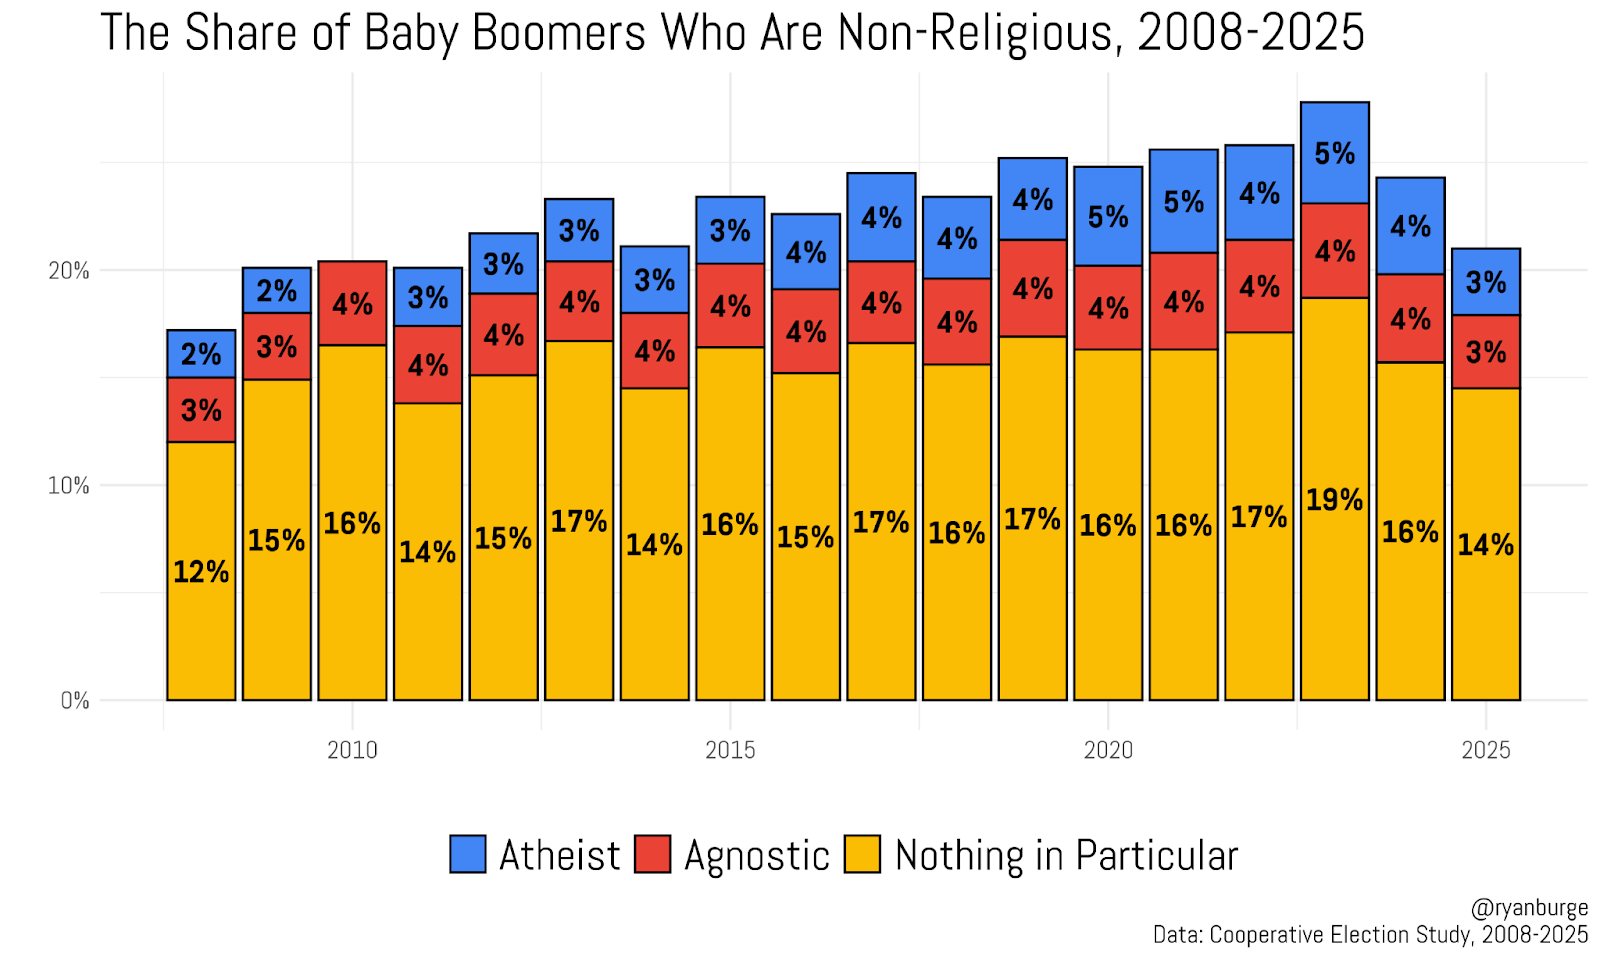
If I break this down into the three different types of nones, we can see much more granularity in the data. The share of Boomers who were atheists has never really been that high. It was 3% of the sample for a stretch that ran from 2008 through 2015. It did slowly creep up in the last decade, though, and in some survey years it was 5%. Agnostics were on a similar trajectory. But that noticeably reversed in the last two years. Now, atheists and agnostics are 3% each, down from a total of 9% in 2023.
But the bigger drop in this graph is that third category of nones: the nothing in particular. Notice how they’ve grown from 15% of Boomers to 19% in the 2023 data. That’s reversed significantly. Now, just 14% of Boomers are nothing in particular. That’s a five point decline in just two years. That’s a level of movement that is uncommon in the world of religious demography.
Of course my wheels are spinning now, seeking out the reason why. One quick theory I had was that Republican Boomers are coming back to religion because they believe that to be a crucial part of being a member of the GOP. Republicans are the party of people of faith, so it makes sense to check that out.
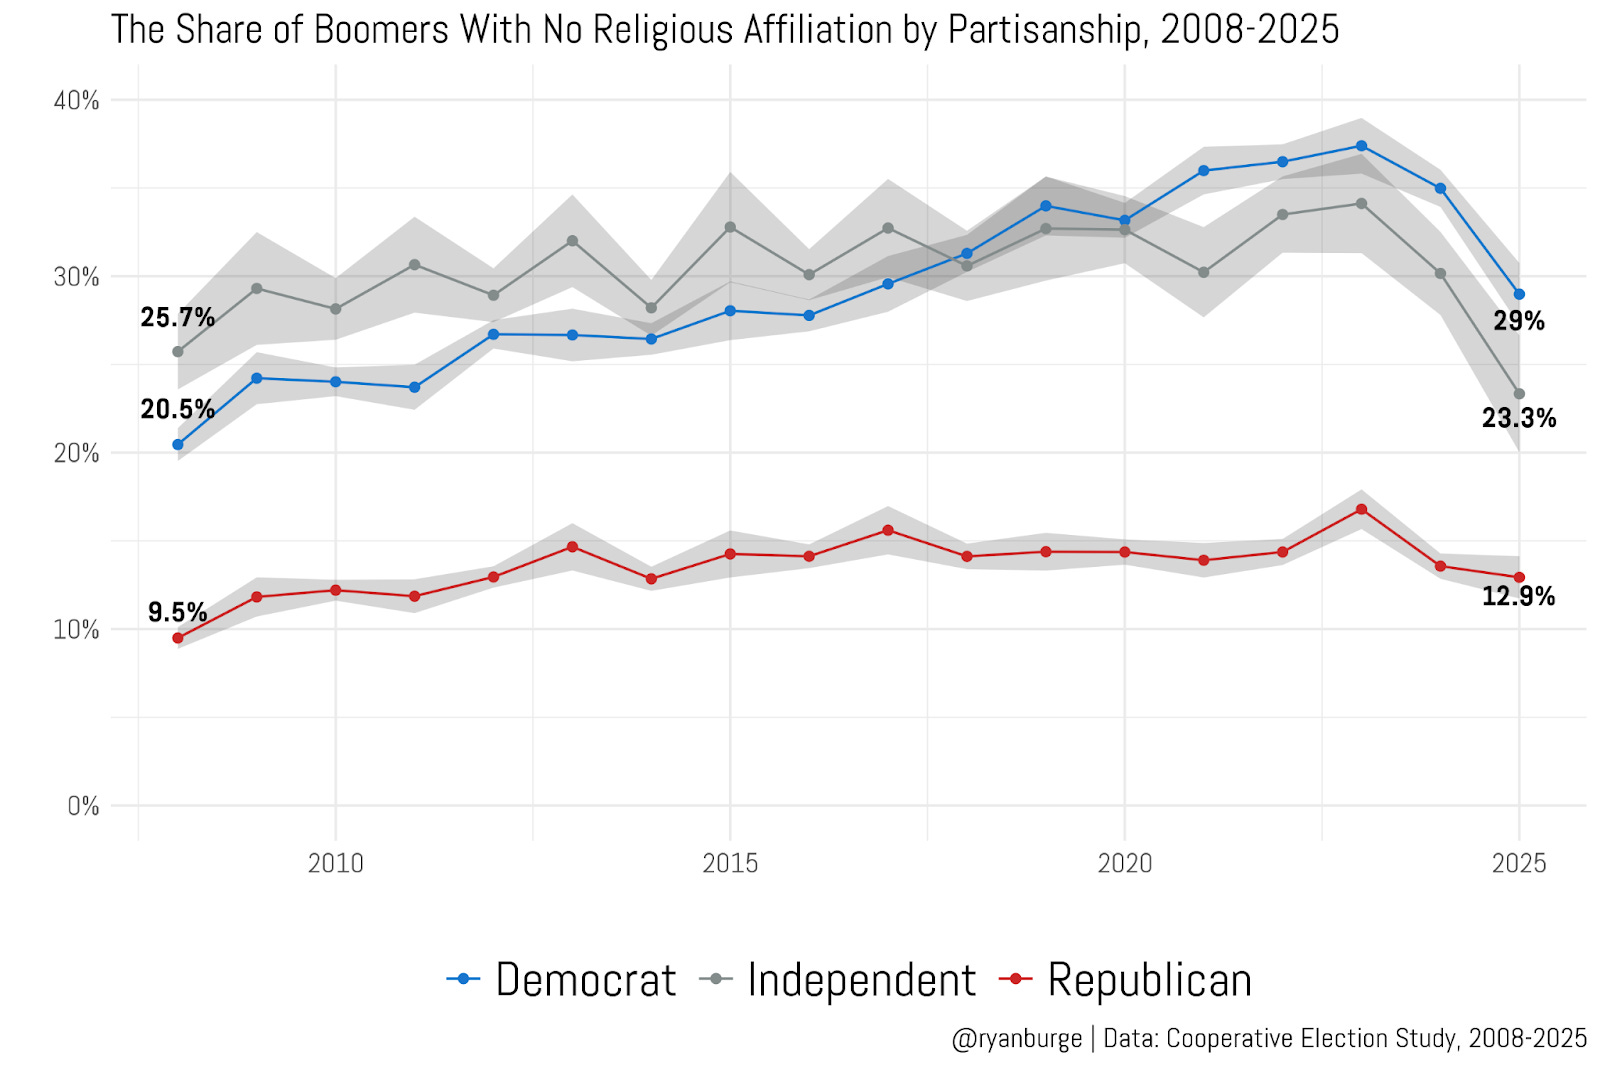
This graph is not what I expected to see at all, honestly. Not even a little bit. In fact, it’s a graph that does not line up with my understanding of religion and politics in any meaningful way. The share of Republican Boomers who are non-religious is just 13%. That’s basically what it was four years ago. The baseline has been 12-13% for about a decade now. That’s not the story of how Boomers have shifted their religiosity.
Instead, the trend lines show a big shift in the lines for Democrats and the politically Independent Boomers. For Boomer Democrats, the rise in the nones is startling. It was just 21% back in 2008. By 2023, it had exploded to nearly 37%. That’s an increase of about a percentage point a year. But then it reversed itself and the share of Democrats who claim no religious affiliation dropped about seven percentage points in a span of two years. For Independents, it’s even larger: nearly eleven percentage points between 2023 and 2025.
If you even have a passing interest in demography you know that shifts like that should be met with skepticism. Change is best described as glacial. Two percentage points in a year is a lot of movement. Here we’ve got five points a year. It seems…off.
We have ways to validate the CES data, by the way. It’s pretty simple: just pull in another survey that asks similar questions and see if the trend lines there move in a similar pattern. That’s what I did below, just took the General Social Survey and calculated the share of Boomers who are non-religious over time. That survey was last fielded in 2024, by the way. So that’s as far as my sample can go.
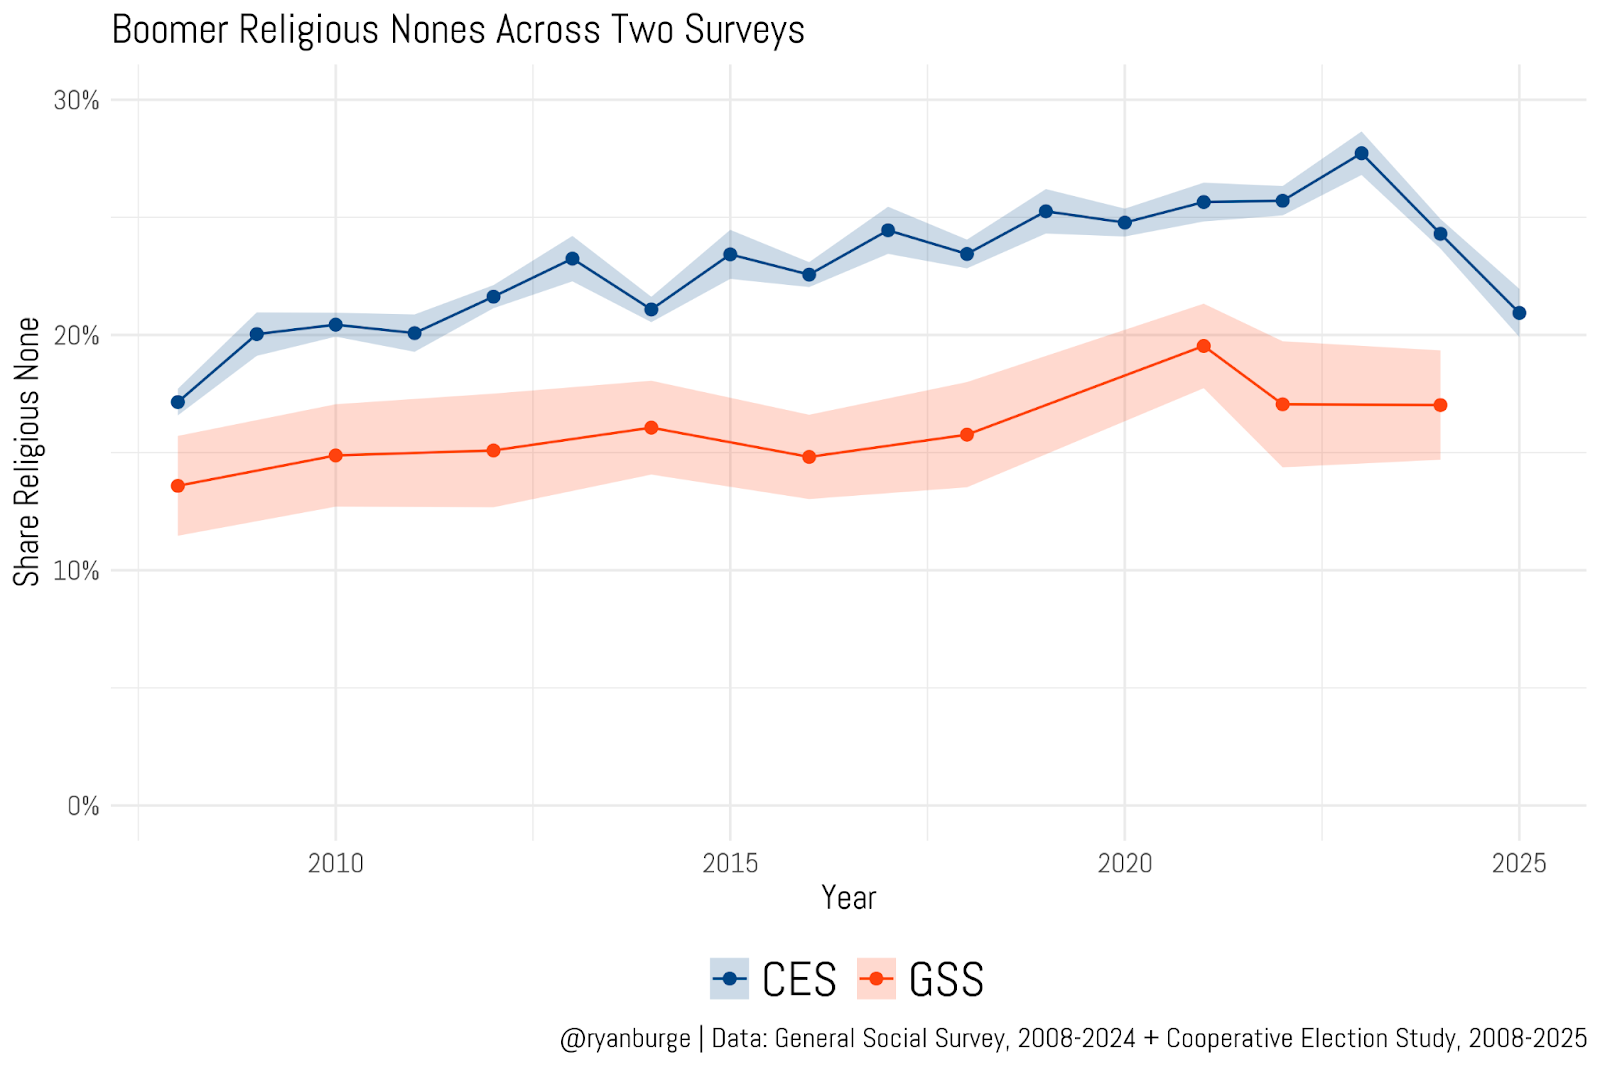
In the GSS, the pattern is really stable over time. You can see that back in 2008, the GSS pegged Boomers at around 14% non-religious. That was about three points lower than the CES. The GSS trend line is exactly what we typically see doing this kind of work—a slow and steady change over a long time horizon. Even in 2024, the GSS estimate of Boomer nones is 16.5%. That’s not statistically distinct from the 2008 data.
The CES, in contrast, displays a consistent rise in the share of Boomers who claim no religious affiliation. The numbers do seem to see saw during a period that runs from 2012 through 2020, but the macro-level trend is an increase from 21% to 25%. Then a noticeable bump in 2023 and two years of decline. In other words, the lines don’t look that much like each other. CES shows a clear rise and fall. The GSS just shows a very gradual rise that’s not statistically significant.
Here’s the same analysis, but I broke it down by political partisanship.
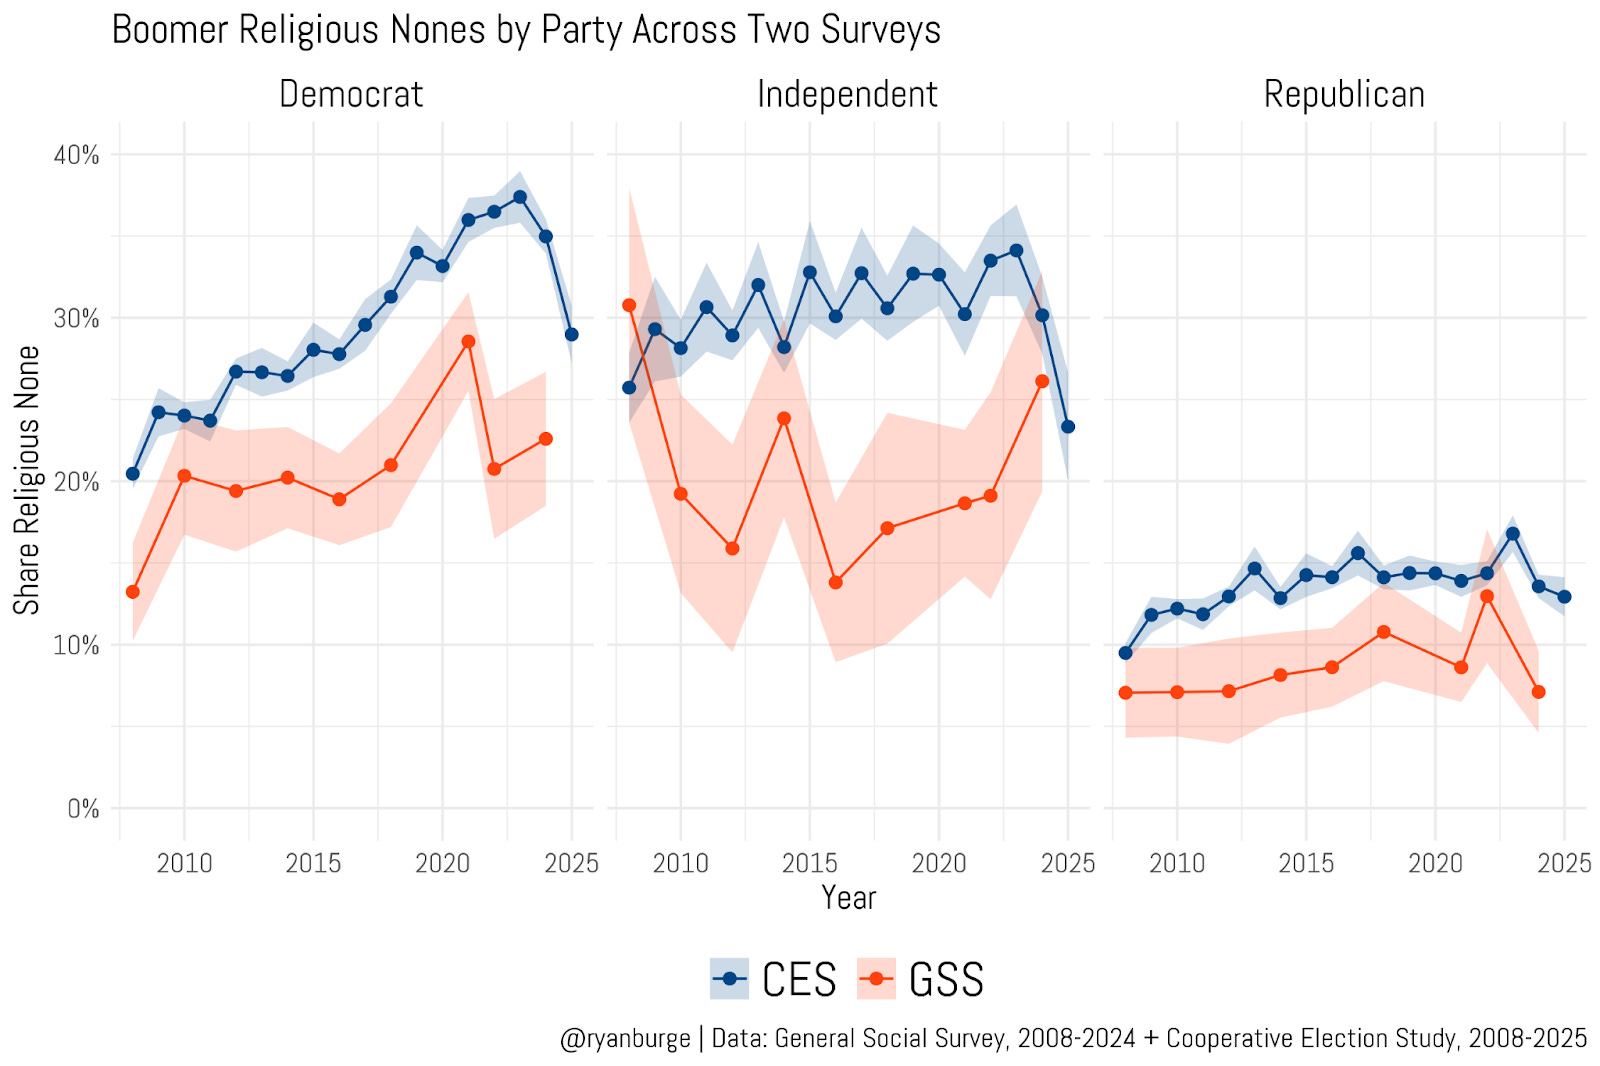
Here, I just can’t see anything that resembles a consistent pattern across these two samples. I mean, the line for Democrats in the CES just has a completely different shape than that from the GSS. The GSS had a big spike in 2021, then a noticeable drop in the last two years. The CES had a spike in 2023 and then a drop in the two years after that. There’s just no consistency there. And you can see the same thing for Independents—the lines don’t make sense when compared to each other. The last few years of the CES is a massive decline. In the GSS, it’s a rise in the nones.
I think that the graph for Republicans is much less concerning. Both lines are definitely trending upward. They each show a little bump in the nones in close succession. But then both lines dropped back to baseline in the last few years.
Guys, this is why this job is hard! There’s not a consistent pattern in this data. Both surveys are not speaking with the same voice on a very basic question of religious demography. I can’t look at these last few graphs and make a clear pronouncement about the overall religiosity of Baby Boomers. I wish it was easy, but it’s just not.
There is one graph, though, that does seem to tamp down my anxiety a bit. It’s the share of Boomers who attend church nearly every week or more over the last fifteen years.
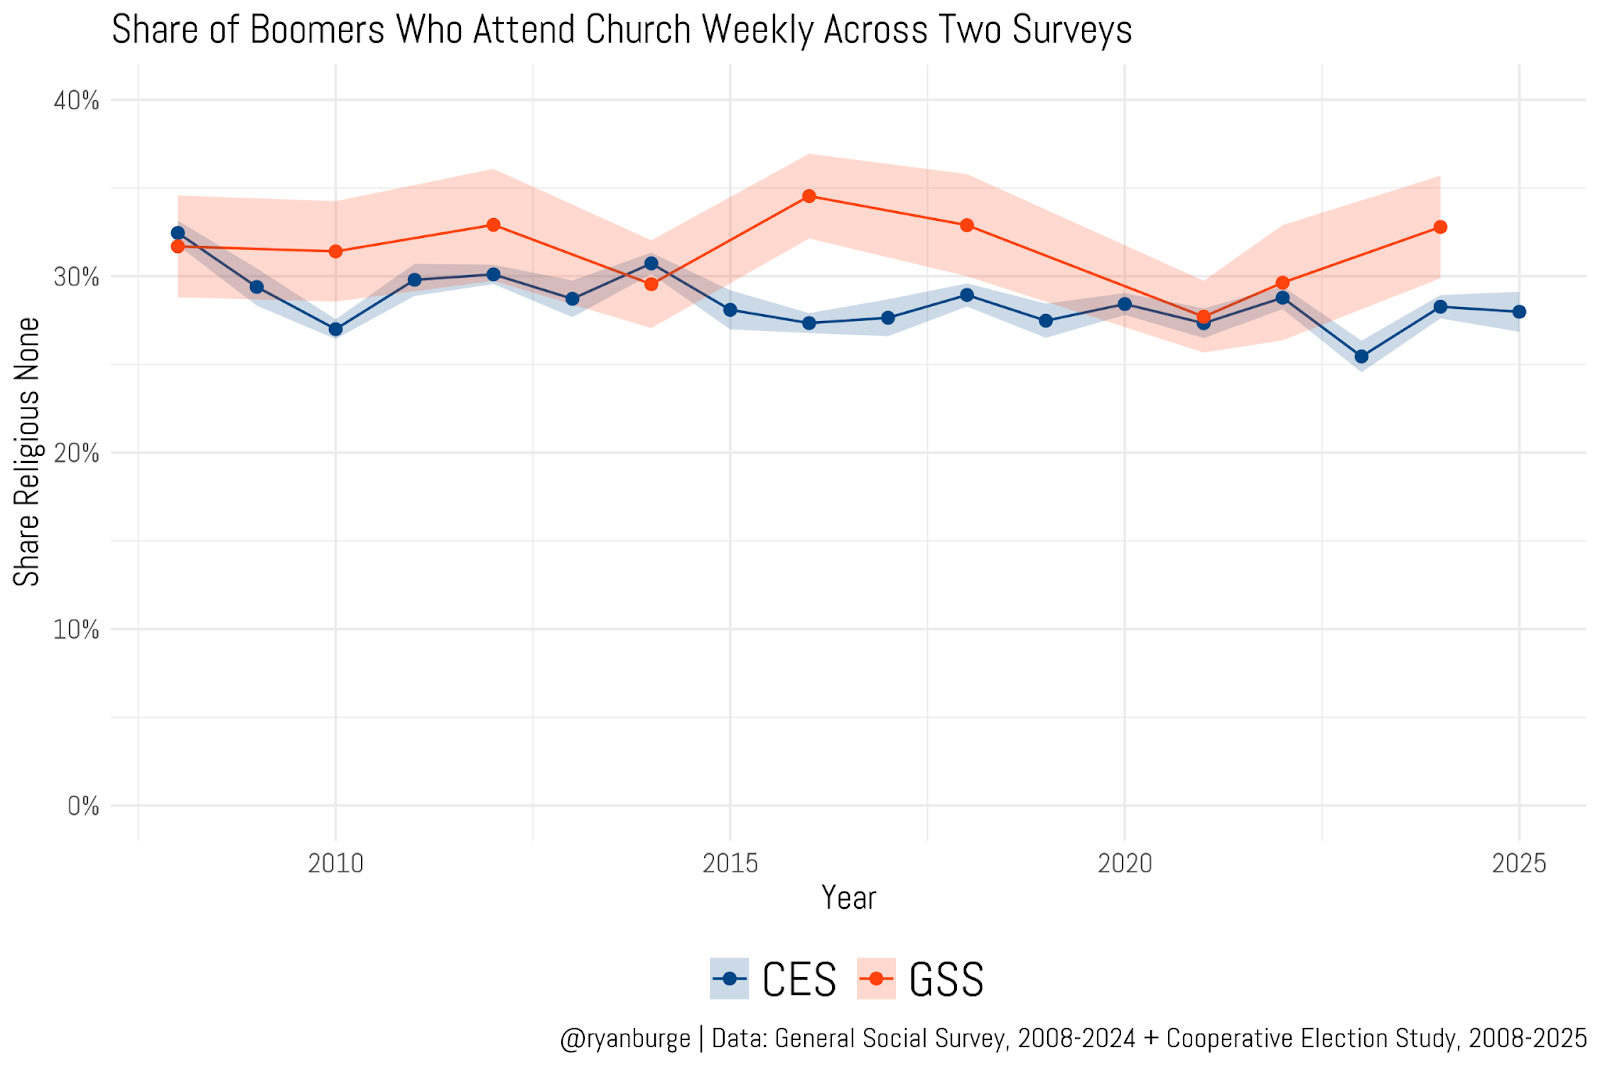
This graph looks much more plausible. Both samples have the weekly attendance rate around 30% over time. There is some separation between 2015 and 2020, but it’s not substantively large: maybe just three percentage points. Then the lines come back together for a couple of years before separating just a bit in 2024. But there’s a consistent voice that emerges from both surveys: the share of Boomers who report weekly attendance is likely around 30%. Is that changing over time? I don’t get a strong sense of direction from either instrument. In other words, attendance is pretty stable.
Who is Telling the Truth About American Religion?

Okay, I guess it’s time to write the post that I’ve been dreading for a long time because I don’t know how it’s going to be received. Be warned—this one is super nerdy and goes very deep into the weeds of survey methodology. I want this newsletter to be really accessible to the average American, but I think it’s helpful every once in a while to pull back the curtain on stuff that I see in the data that just doesn’t sit right with me.
By the way, this last graph actually complicates the conclusions from the prior graphs even more. Remember, Boomers seemed to find faith again in large numbers in the last two years of the CES. If that were the case then why did Boomer attendance not change in any demonstrable way during that same period? We should theoretically see a jump in weekly attendance but it’s not there in the data.
That’s why this kind of work is maddening. There isn’t a clear narrative that emerges from this data. I’ve written recently about the two most prominent methods for survey collection recently: panels and probability-based surveys. The CES uses the former approach, while the GSS has employed the latter design for decades. That could be one explanation for the divergence. It’s just hard to know what’s the “right” answer here.
What both these instruments point to, though, is that the overall trajectory of American religion has changed over time. After decades of a consistent increase, that secularization era is over. The rise has turned into a plateau. Have the nones reversed? Yes, it seems like they have. But why has that happened? I just can’t put my finger on it.
And it’s driving me crazy.
Code for this post can be found here.
Ryan P. Burge is a professor of practice at the Danforth Center on Religion and Politics at Washington University.

"Guys, this is why this job is hard!" But you do such a great job! I and many others appreciate your efforts to untie the knots of data.
Great post. In regards to the "spiritual reversal" perhaps we are seeing the Spirit at work.
It may be very practical, since the older folks are the ones claiming a little more affiliation. One of the most alluring benefits of membership in my synagogue, where everyone except our Rabbi has Medicare benefits, is a perk introduced a generation or two ago. Every member has entitlement to a burial plot in the congregational cemetery. As our membership swooned from 350 to 105 families in my time there, most of the departures were young adults who defected or disaffiliated, and older members who claimed their piece of eternity. Even those who retired to Florida maintain a nominal membership to keep that benefit, which continues into widowhood irrespective of membership if the spouse is already buried there.
Perhaps the older participants in the GSS and in the CES have had to bury a mate or had to consider their own final plans as chronic life-shortening conditions appear. The Silent Generation has Veterans who get free burial. We boomers have much less of that entitlement. The church or synagogue offers something very valuable to them which commercial sources find hard to duplicate. No additional attendance required.