

America Got a Little More Religious. No, Really.
America's Secular Surge Has Stalled. We Don't Know Why.

Sorry to interrupt the regular publishing cycle of every Monday and Thursday, but I’ve got some new data and it’s led to a couple of graphs and a whole bunch of thoughts that probably need to be organized somehow.
One of the surveys that I use on a regular basis is called the Cooperative Election Study. It’s conducted every year in October and November and the data is released in March. That’s exactly what happened earlier this week: the survey from 2025 was released and there’s a lot to chew on in terms of the size and trajectory of key religious groups.
The Nones Have Hit a Ceiling

I stalk certain websites. Probably not the same websites that others look at. Mine are data repositories for the usual suspects - the General Social Survey (in case they push an updated version of their last data release), and the Cooperative Election Study
Let’s start with the biggest headline finding: the share of the sample who identifies as atheist, agnostic, or nothing in particular has dropped again. That’s a continuation of an ongoing trend that started in 2023 where the nones have declined in a slow and steady way. In 2022, the percentage of Americans who identified as non-religious was 36.2% in the CES. It was 35.6% in 2023, 34.1% in 2024, and then the data from 2025 puts the nones share at 31.8%.
That’s almost back to the levels recorded in 2017 and 2018.
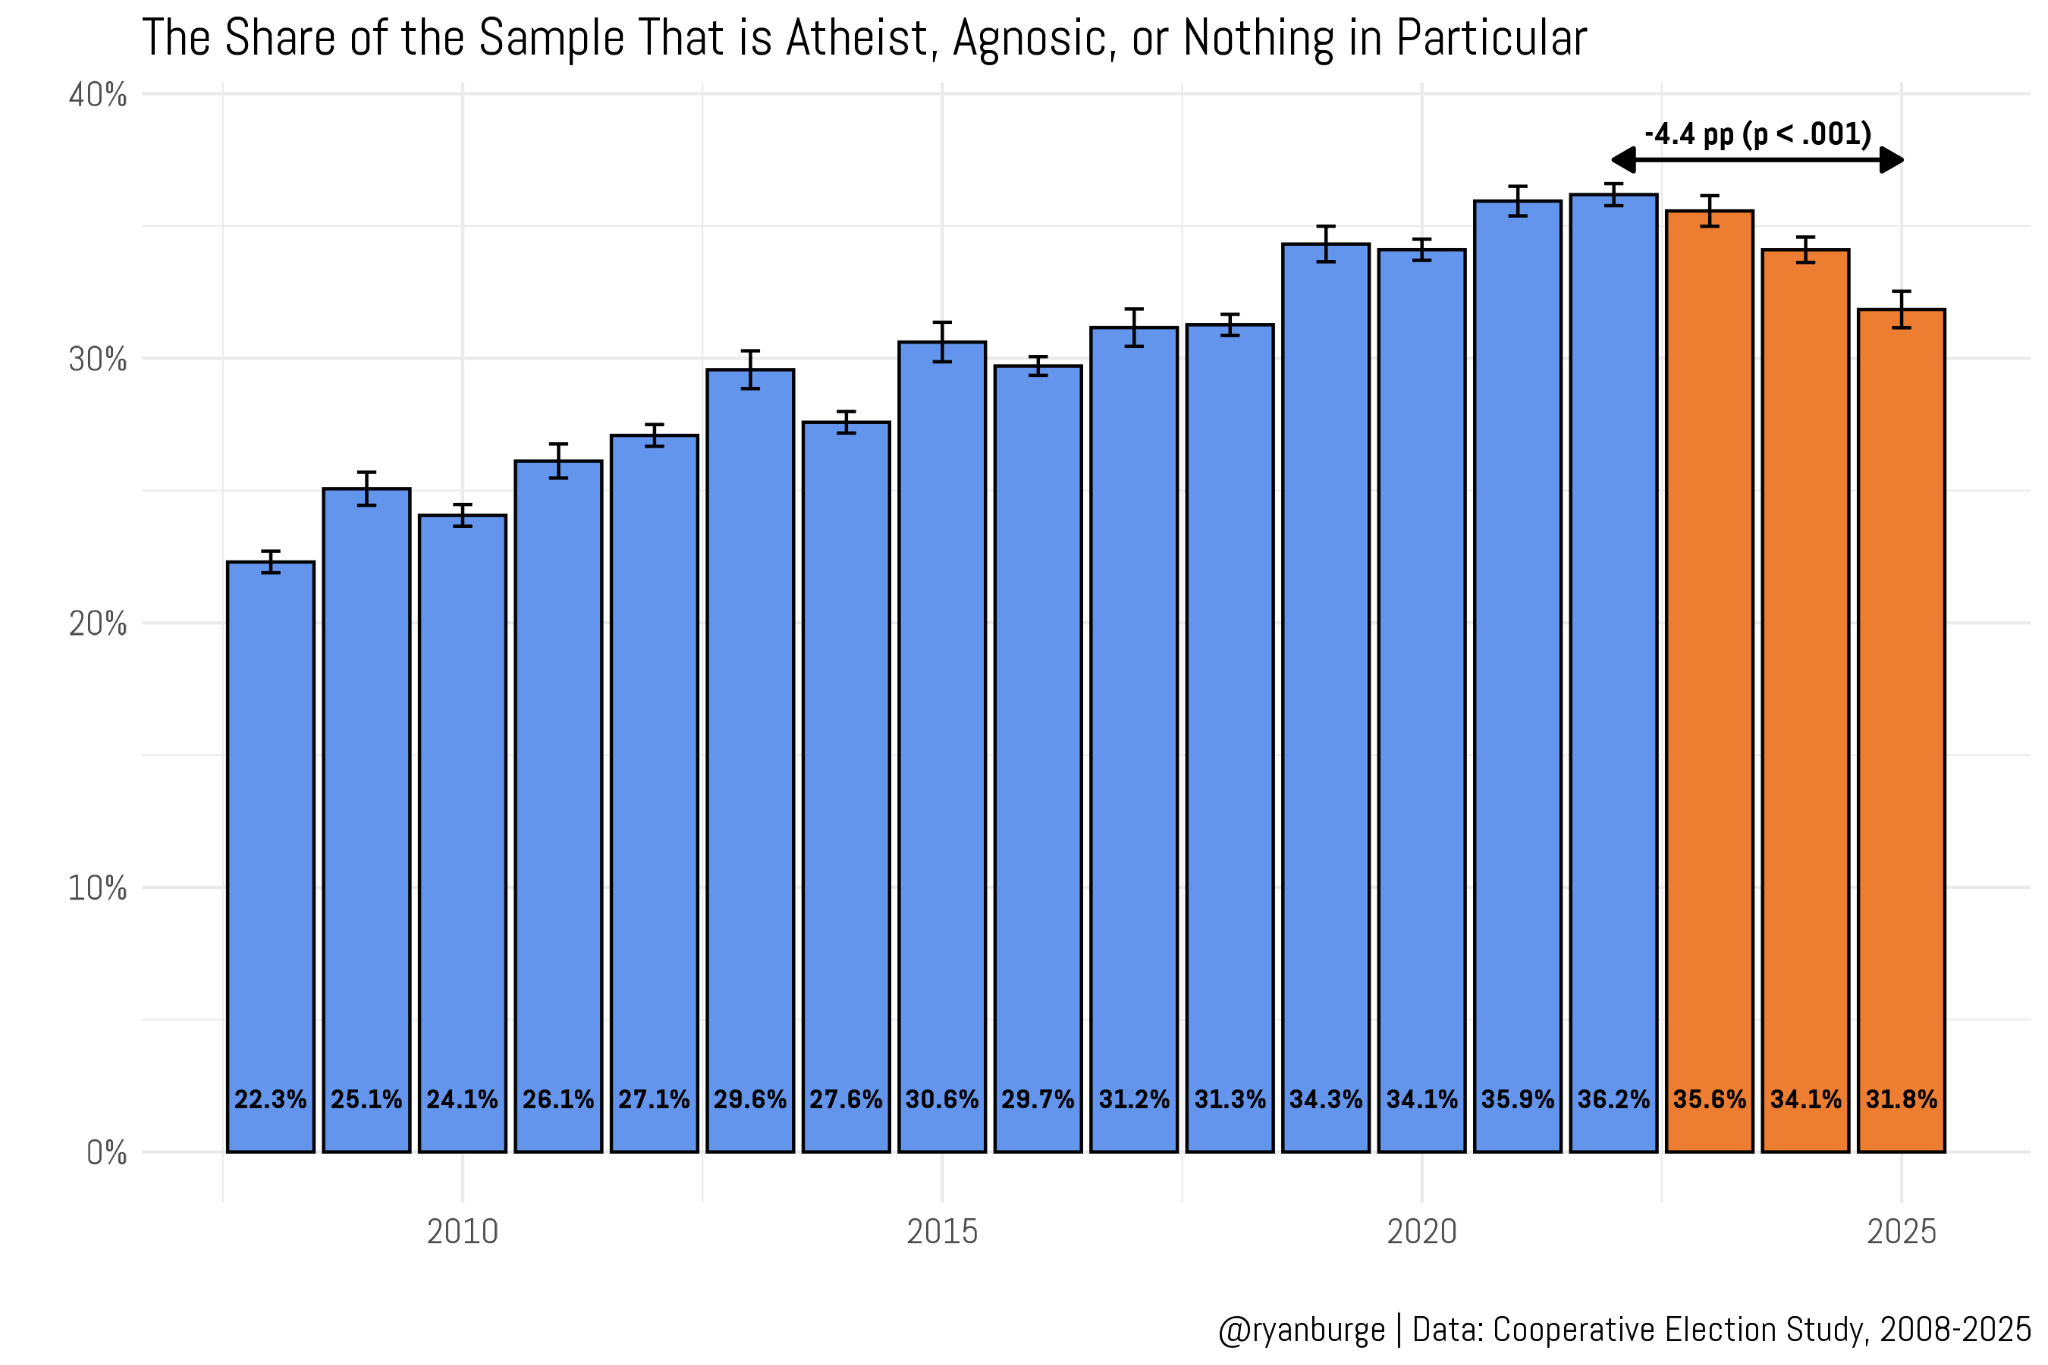
The key thing to know about this change is that it is statistically significant. The samples that the CES collects are enormous by any standard. In election years, the total number of respondents is 60,000 or more. (The CES is primarily focused on political science questions, so there’s ample reason to ramp up data collection during an election year.) The off years are smaller, but they are always above 15,000 folks. For comparison, the General Social Survey’s typical sample is around 2,500. So, even in the “down years,” the CES is just orders of magnitude larger than the GSS.
The statistical verdict is clear: the recent decline in religious nones falls outside the margin of error, regardless of how you test it. Whether that decline matters is a different question — and one the data alone can’t answer.
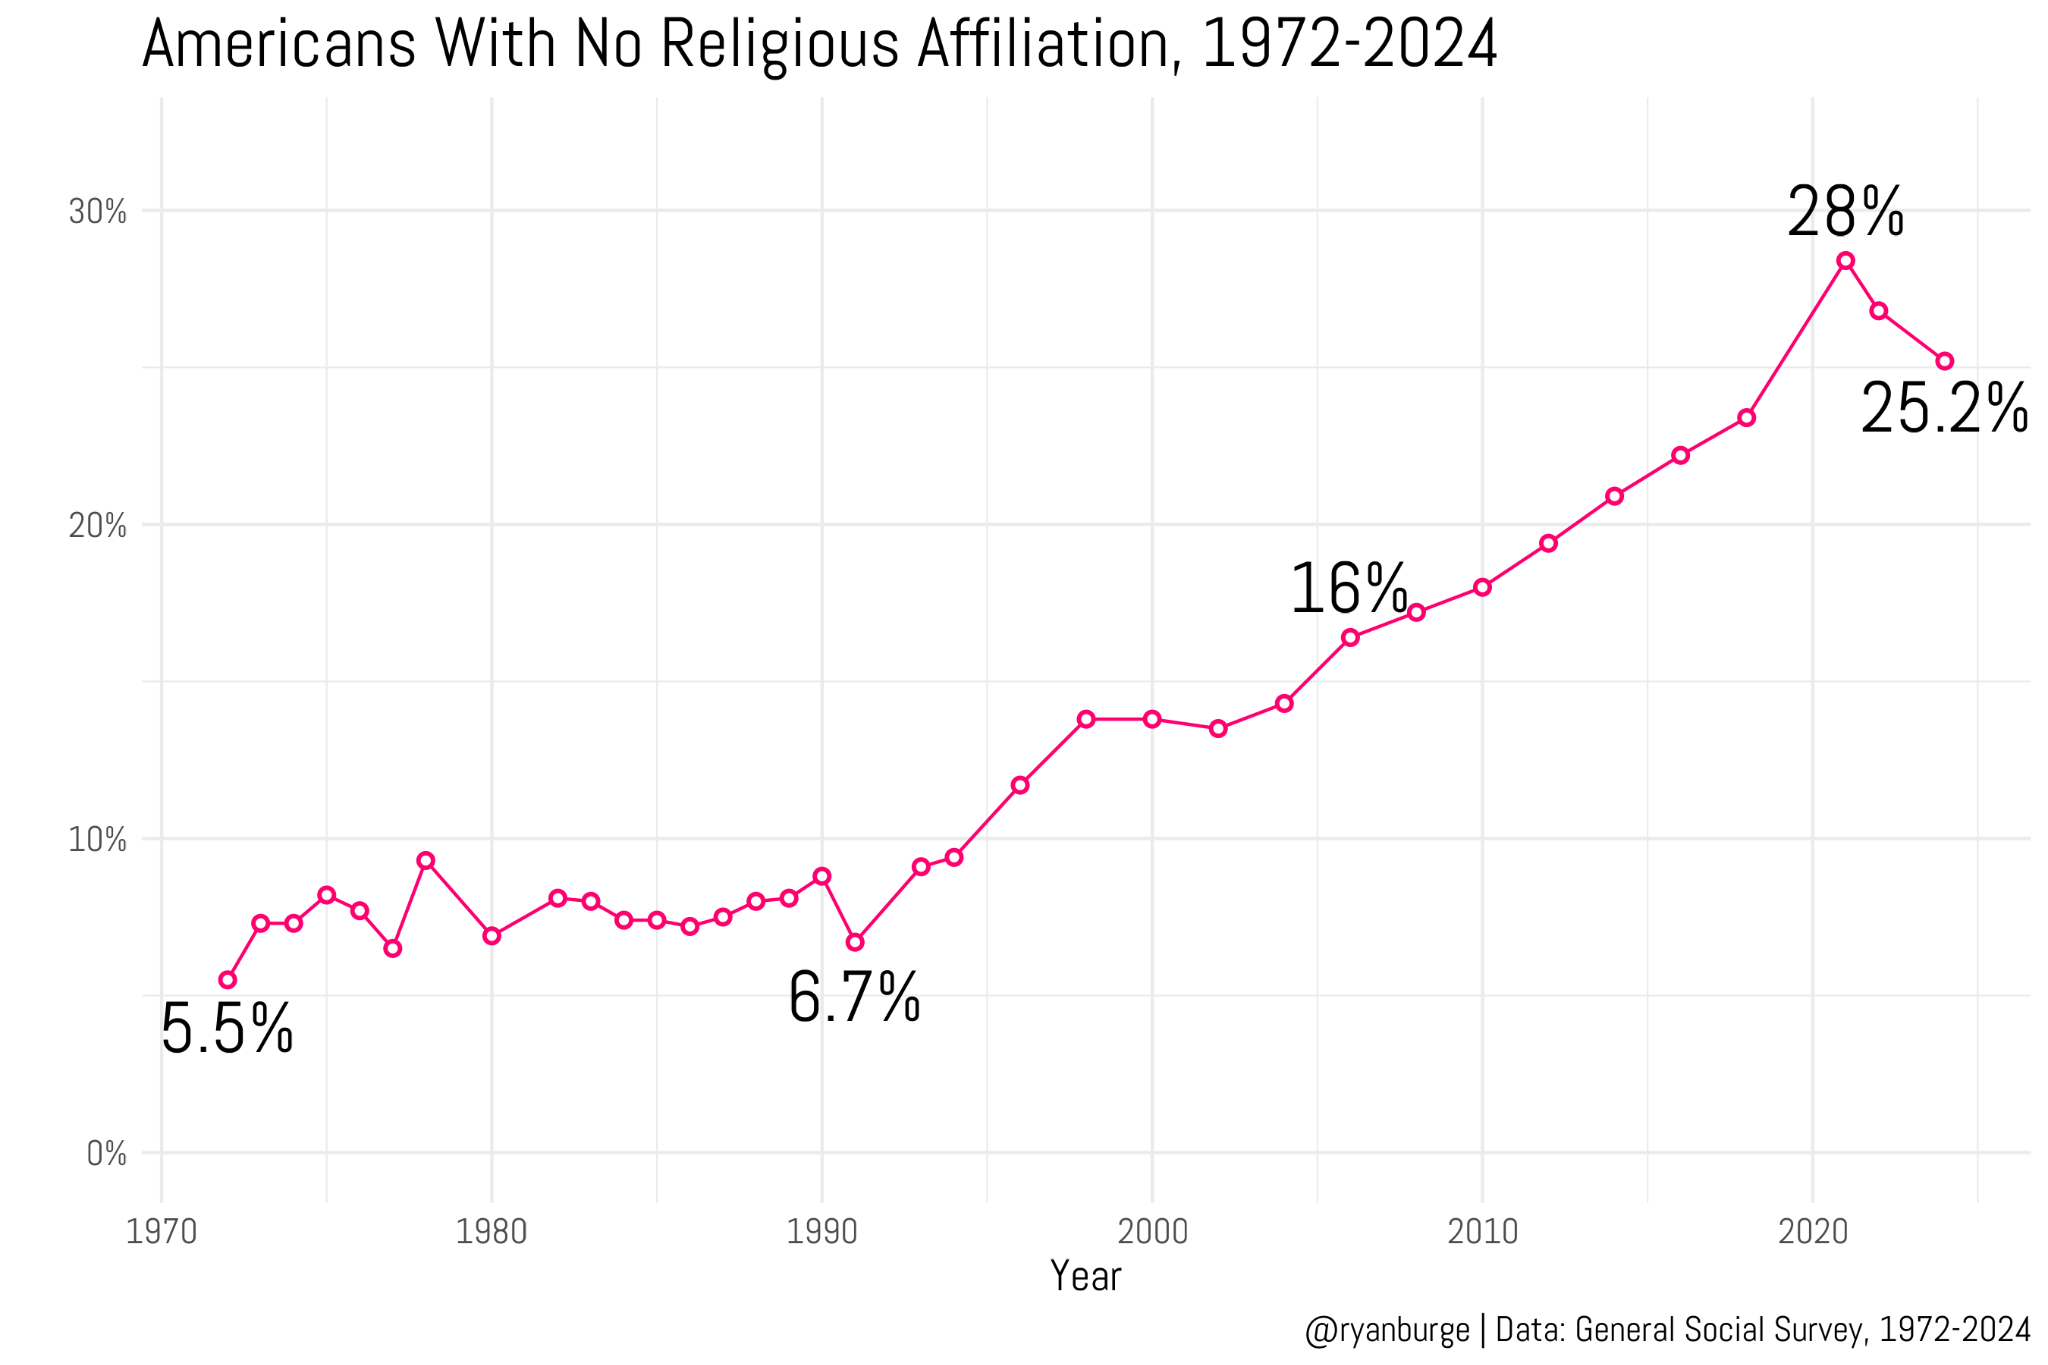
This is not the only data source that points to a decline in the nones, by the way. The aforementioned General Social Survey records a drop in the non-religious in the last few years, too. In 2021, 28% of people indicated no religious affiliation. But that was a weird year for the GSS. They had to change methodologies because of COVID, which caused problems with capturing a good sample (see here for a discussion about that).
But the GSS does point toward a decline in the nones, too — down to 25.2% in 2024. They are putting another wave of the GSS in the field this year, I’ve been told, so we will have an update on this in probably a year from now.
So that’s two surveys pointing to a drop in the nones. That’s not nothing. Let’s dig deeper.
There are three types of non-religious Americans under the Pew typology (which is used in the CES): atheists, agnostics, and people who claim no religion in particular. Here’s how those three groups have changed over time.
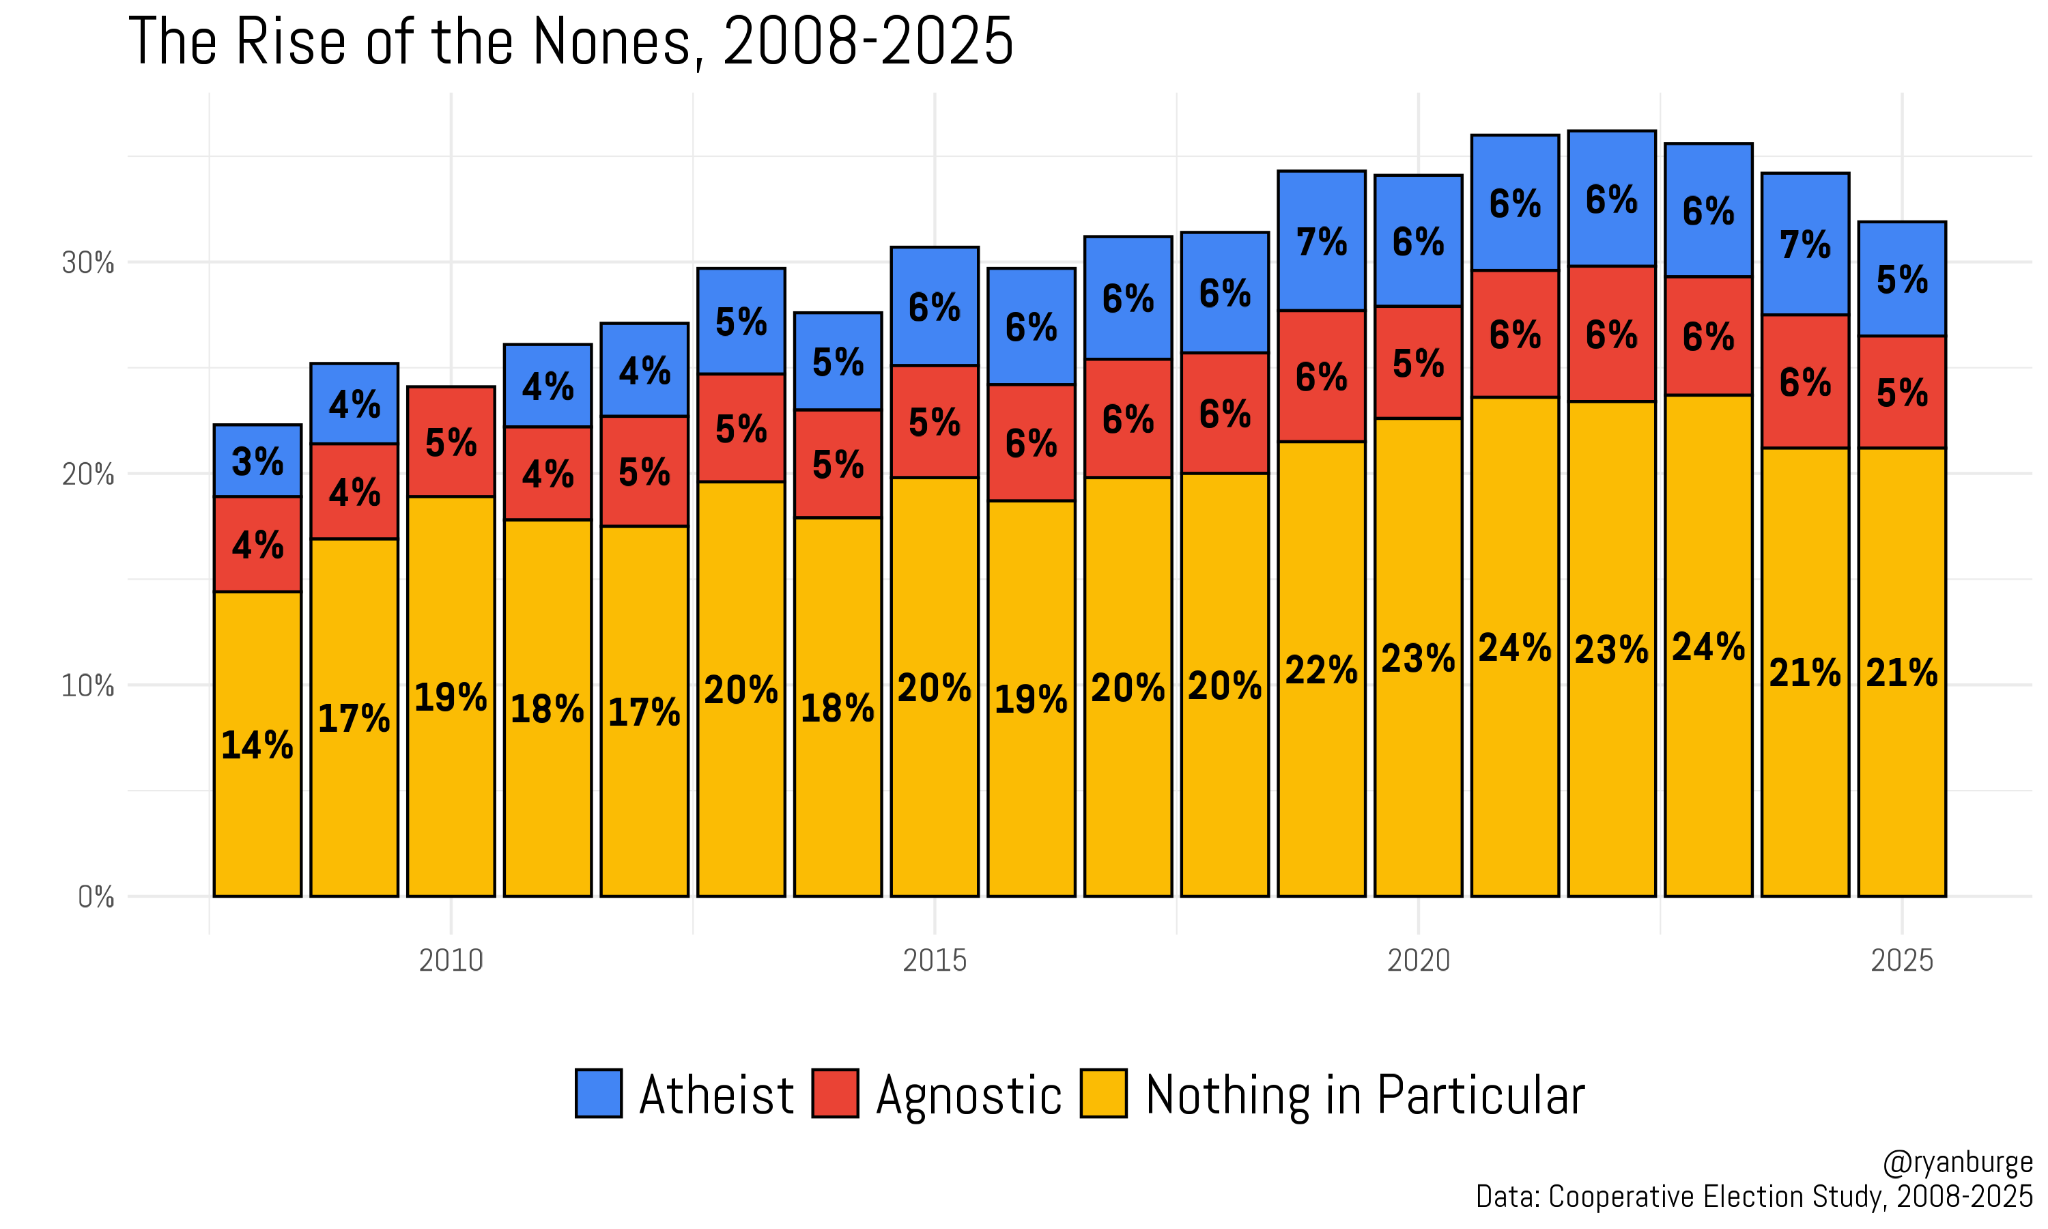
The first thing that I always point out with this graph is that most nones are not atheists or agnostics. Instead, they claim that their affiliation is “nothing in particular.” If there are five nones in a room: one is an atheist, one is an agnostic, and three are nothing in particular. All three groups have grown over time.
However, that growth has been arrested — if not reversed — in the last couple of surveys. Atheists were 6–7% of the sample between 2015 and 2024. Agnostics were in the 5–6% range during this same time period. Nothing in particulars clearly rose between 2015 and 2023, though: from 20% to 24%. That’s not what we see in the 2025 data.
The share of atheists and agnostics dropped to 5% each. They were 13% of the sample just last year and 12% in 2023. The nothing in particular percentage has dipped down to 21% in both 2024 and 2025. That’s lower than it was back in 2019. So it’s really a decline among all three types of nones.
There’s clearly been a numerical decline in the nones. That seems pretty hard to ignore now, and it’s showing up in multiple data sources. Where are those drops coming from?
One source is partisanship.