

What 12 Denominations Tell Us About American Christianity
What I Learned From Tracking Denominations for the Past Decade

I am running a holiday special - 20% off an annual subscription to this newsletter. That brings the cost down to just $48 per year. Take advantage by clicking this button:
And Tony Jones and I are teaching a four week class on the Nones, using all that good data from our Templeton Grant.
You can register here. It’s a “pay what you want” deal.
For the last seven or eight years, I’ve been keeping a spreadsheet that has a whole bunch of membership data from every denomination that has a consistent track record of keeping good data and releasing (at least some of it) to the general public. This is something that I don’t think a whole lot of people think about too much — but this type of information is not really disseminated in a consistent and predictable way. It’s not like there’s a day every year when the ten largest Protestant denominations release all their data in a big press release.
Do you know how it actually happens? In a completely uncoordinated and unorganized manner. There are certain denominations that do tend to keep a regular schedule, but that’s certainly not the norm. Instead, what’s happening more and more is that I’ll just get a random email or a DM on some social media platform that points me to some data that was just released. That’s actually become really helpful in the last few years, so keep those messages coming. I do appreciate the tips.
The end result is a spreadsheet where I’ve kept pretty consistent records of twelve Protestant denominations in the United States. Why these twelve? Honestly, there’s not a good answer. I first started with the Seven Sisters of the Mainline and then added the Southern Baptist Convention because that data was easy to acquire. But over time, I’ve thrown a few more in the mix like the Lutheran Church–Missouri Synod and the Assemblies of God because both are pretty large and good at publishing data. But I also have two smaller denominations on my list, too: the Anglican Church in North America and the Presbyterian Church in America.
I’ve written individual reports about many of these denominations - all of which are behind a paywall:
Southern Baptists
The 2022 Data on the Southern Baptist Convention is Out
The State of the Southern Baptist Convention in 2023
2024 Marks Another Chapter in the SBC’s Long Slide
ELCA
The State of the Evangelical Lutheran Church in America
The Episcopal Church
The State of the Episcopal Church in 2022
Did The Episcopal Church Experience Growth in 2023?
The Post-COVID Plateau of The Episcopal Church
The United Methodist Church
The Aftermath of the Schism in the United Methodist Church
Presbyterian Church in America
Everything You Could Ever Want to Know About Membership and Attendance in the Presbyterian Church in America
A Deep Dive into the Presbyterian Church in America
Assemblies of God
The Assemblies of God: A Denomination That May Be Growing
Not Enough Pastors? A ‘Problem’ for the Assemblies of God
The Assemblies of God in 2024
PCUSA
What Does Denominational Decline Look Like?
I make no illusions that these dozen organizations can accurately assess the contours of American Protestant Christianity, but I do think that analyzing their membership data over the last couple of decades can give us a really nice window into how Protestantism is changing over time. To start with, let me show you how much data I have on each of these traditions.
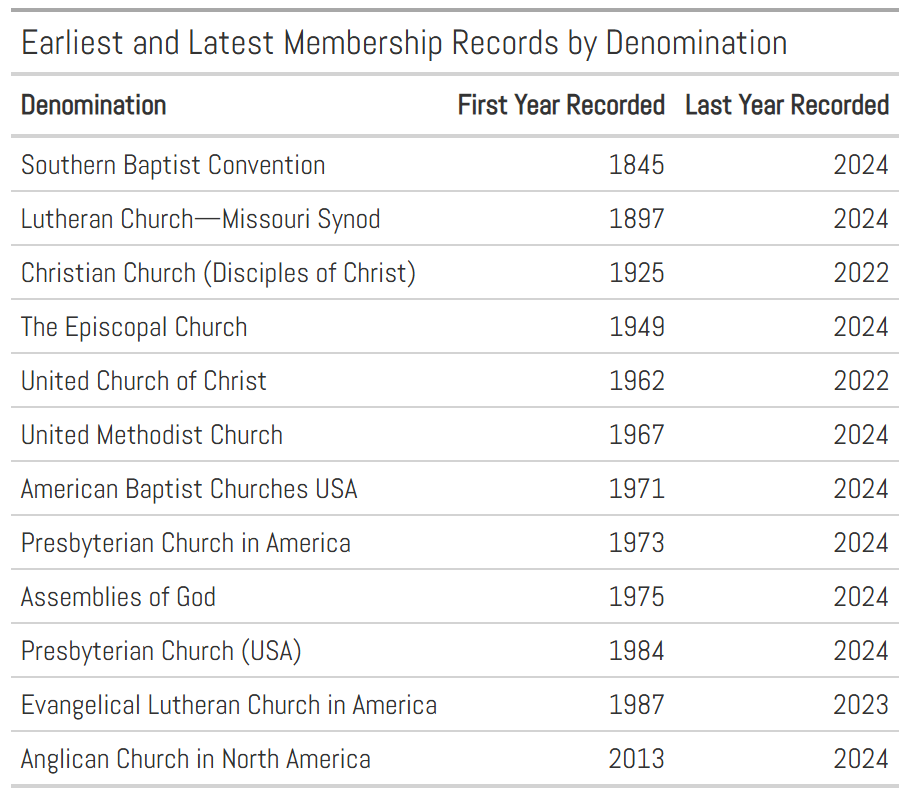
As you quickly ascertain, some of these denominational records go back a very long way. I can trace two back to the 1800s, and another three have records that stretch back before 1950. But for a bunch of them, the data starts in the 1960s and 1970s because that’s when these denominations officially formed through mergers and other organizational changes. The denomination that is clearly the youngest here is the Anglican Church in North America, which was established in 2013.
But also notice how I don’t have really recent data on some of these denominations? Yeah, that’s a real pain in my behind when I’m trying to do analysis, because I can’t just write code to compare 1980 to 2024 — that would leave some of these behind. For instance, the United Church of Christ’s membership data hasn’t been released in three years. It’s the same for the Disciples of Christ (who also make you pay to have access to their data).
And I don’t even want to get into the fact that there are tons of missing years in the sequence, too. (I’ll discuss that more a bit further down.)
So let me show you the basic size and trajectory of these denominations in a line graph that starts with 1960, because most of my traditions go back that far.
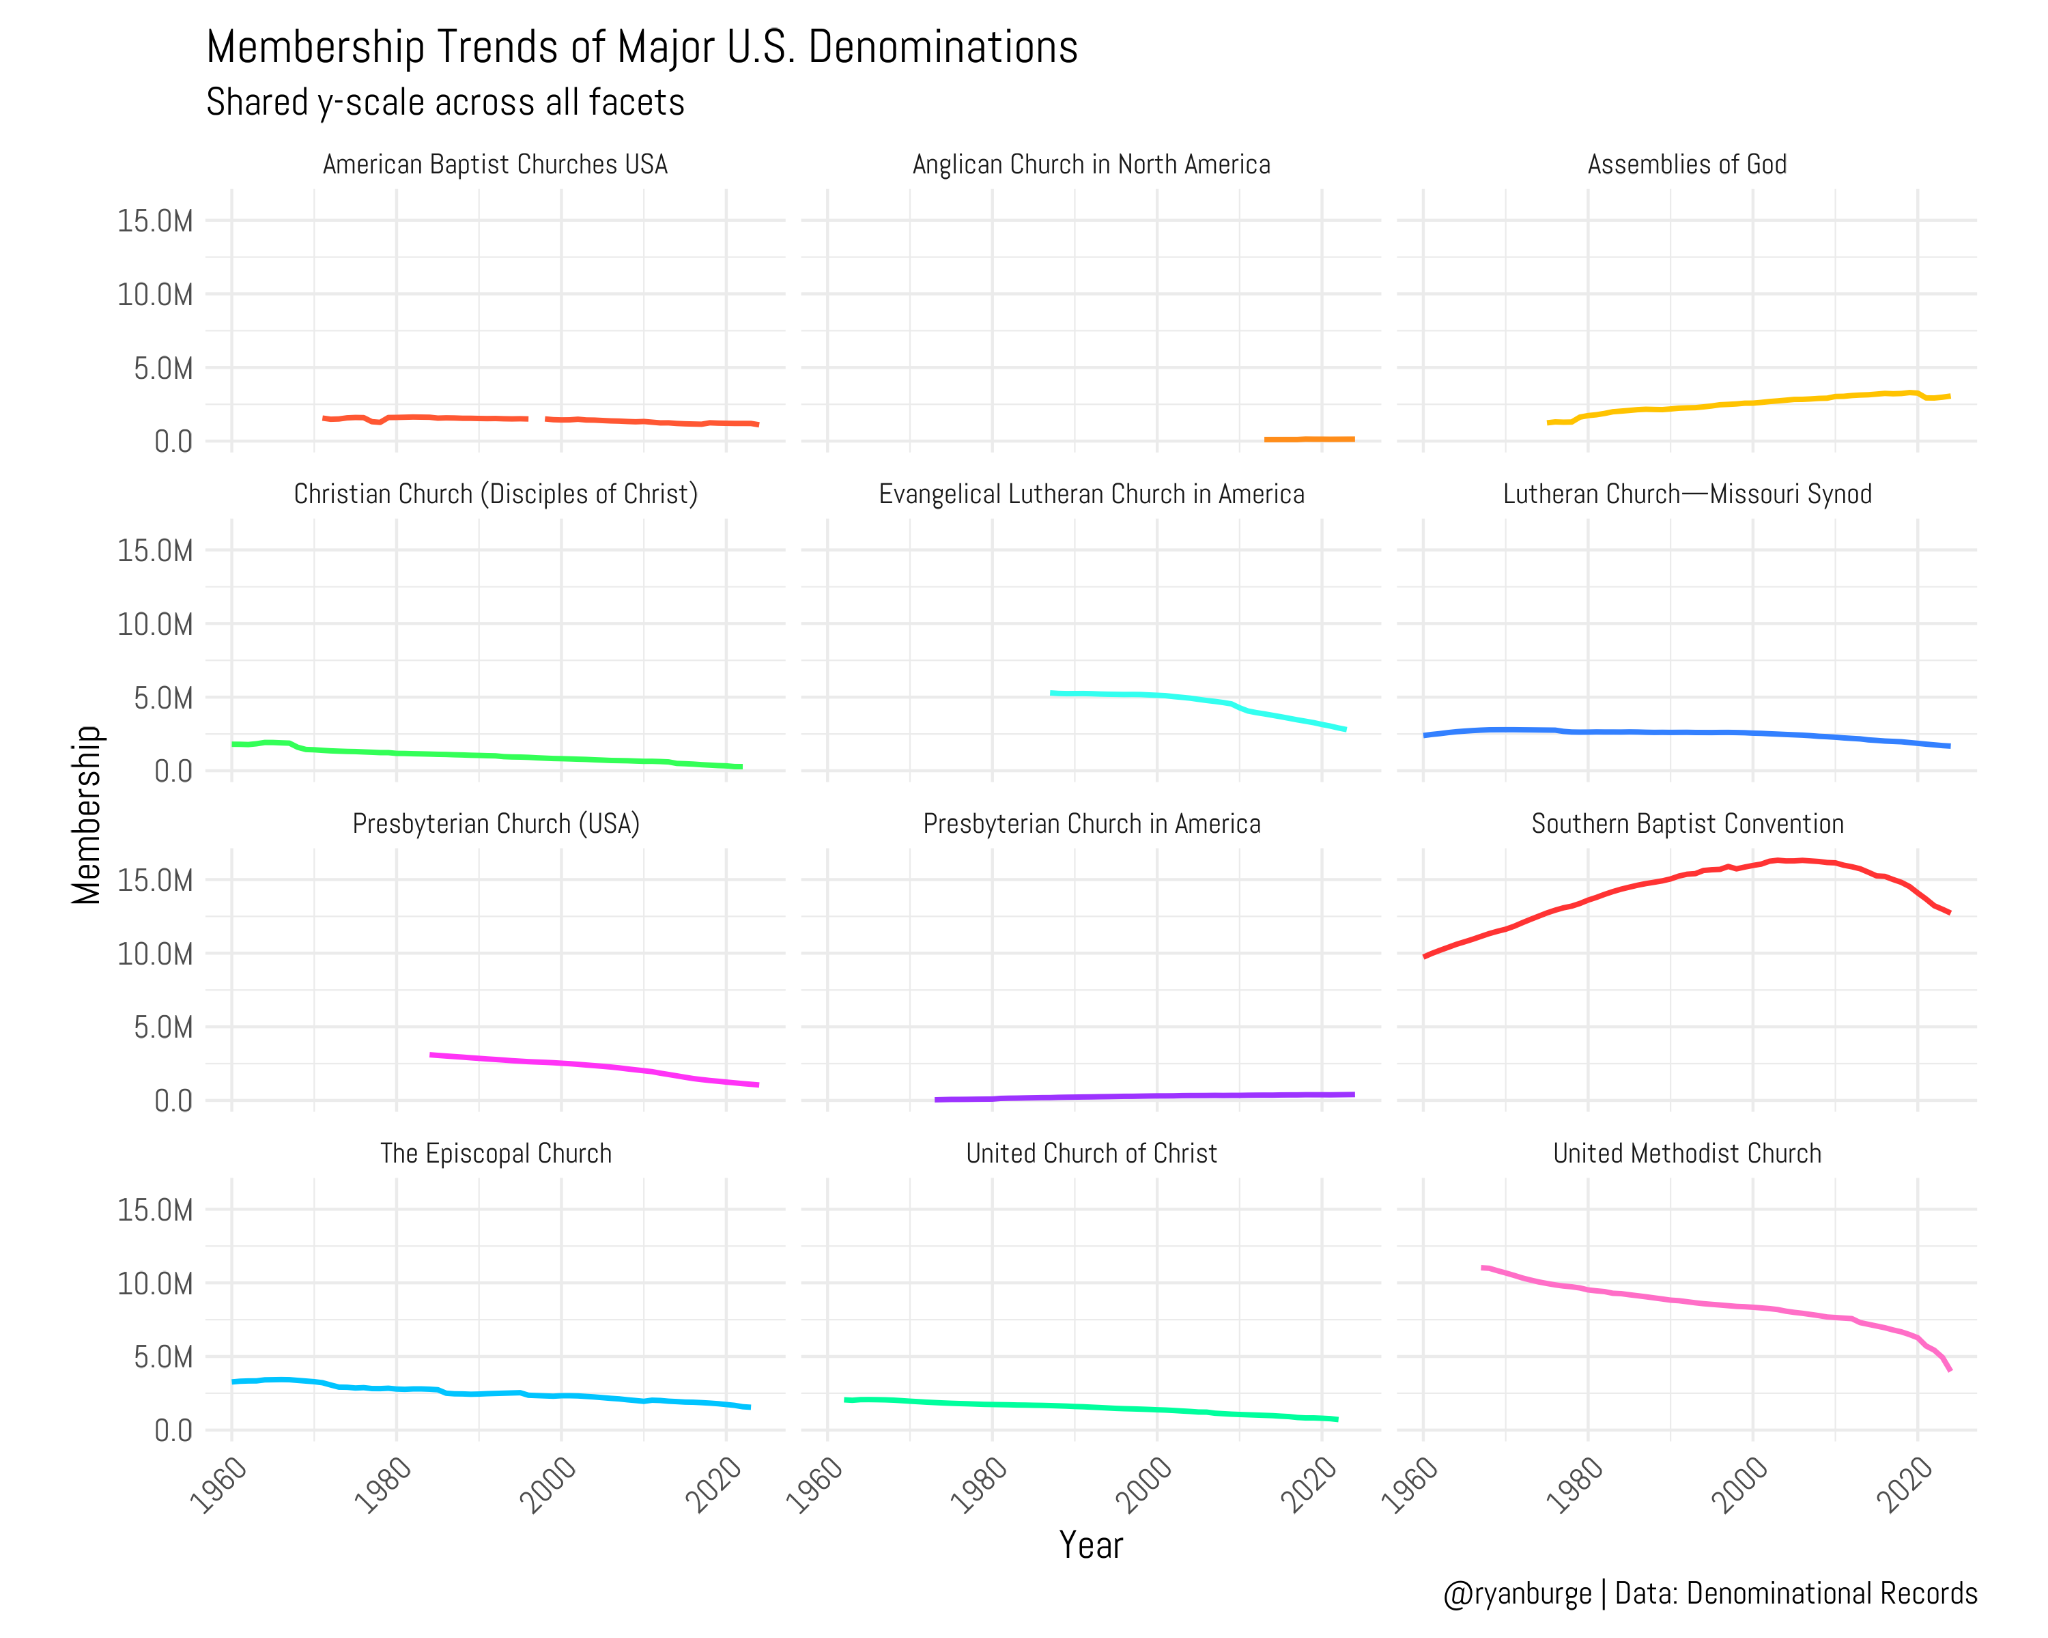
This graph is kind of terrible, right? I know it is, and there’s a good reason for it — I’m comparing denominations that are vastly different in size. For instance, the Southern Baptist Convention had over 16 million members at its peak in 2006. The United Methodist Church was north of 10 million back in the 1960s. So those two groups really mess up the scale of the y-axis.
While this graph does a good job of showing us which denominations are large, it doesn’t do a good job of showing the changes in smaller denominations like the ACNA and the PCA, which are both under 500,000 members. To do a better job of that, I just let the y-axis vary for each denomination in a way that makes the trends more discernible.