

A Deep Dive into the Presbyterian Church in America

PCA folks, it’s your moment — few denominations punch above their weight online like you do. I’ve tweeted about this before, but you all play an outsized role in the online discourse about American Protestant Christianity. To celebrate that, I just did a pretty deep dive into the statistical data released by the Presbyterian Church in America. Thanks to their meticulous recordkeeping, I didn’t have to spend hours cleaning and merging data. I can get right to the fun stuff. And let me say: I’ve just scratched the surface of what this data can tell us.
For the uninitiated, here’s a really quick background on the PCA. It was founded in 1973, when a group of theologically conservative congregations broke away from the Presbyterian Church in the United States (PCUS) — the southern mainline Presbyterian body — not from the Presbyterian Church (USA), which didn’t even exist yet. The PC(USA) was later formed in 1983 when the PCUS merged with the northern branch, the United Presbyterian Church in the U.S.A.
We would classify the PCA as evangelical, and their major doctrinal positions reinforce this: they don’t ordain women, they maintain that marriage is between a man and a woman, and they are unabashedly Reformed in their doctrine.
They aren’t a particularly large denomination. They have about 400,000 members and less than 1,700 churches. But they are growing at a nice clip - adding 1.5% to 2% to their membership rolls each year. If you are trying to identify a prominent member of the PCA, the answer is easy: the late Tim Keller.
What Does Denominational Decline Look Like?

I love data. I love religion. I love religious denominations that make their data publicly available.
Let’s get to the analysis now, right? The first thing I want to reiterate is that the PCA is pretty darn good at record keeping. Here’s something that not many people think about but a whole bunch of churches are non-responsive to annual surveys from denominational offices. Many of them just carry over their numbers from the previous year. Which is incredibly problematic, by the way. But that’s a whole different issue.
The PCA’s website has this cool option to only include the ‘last submitted’ report from each church. That makes it easy for me to figure out compliance rates.
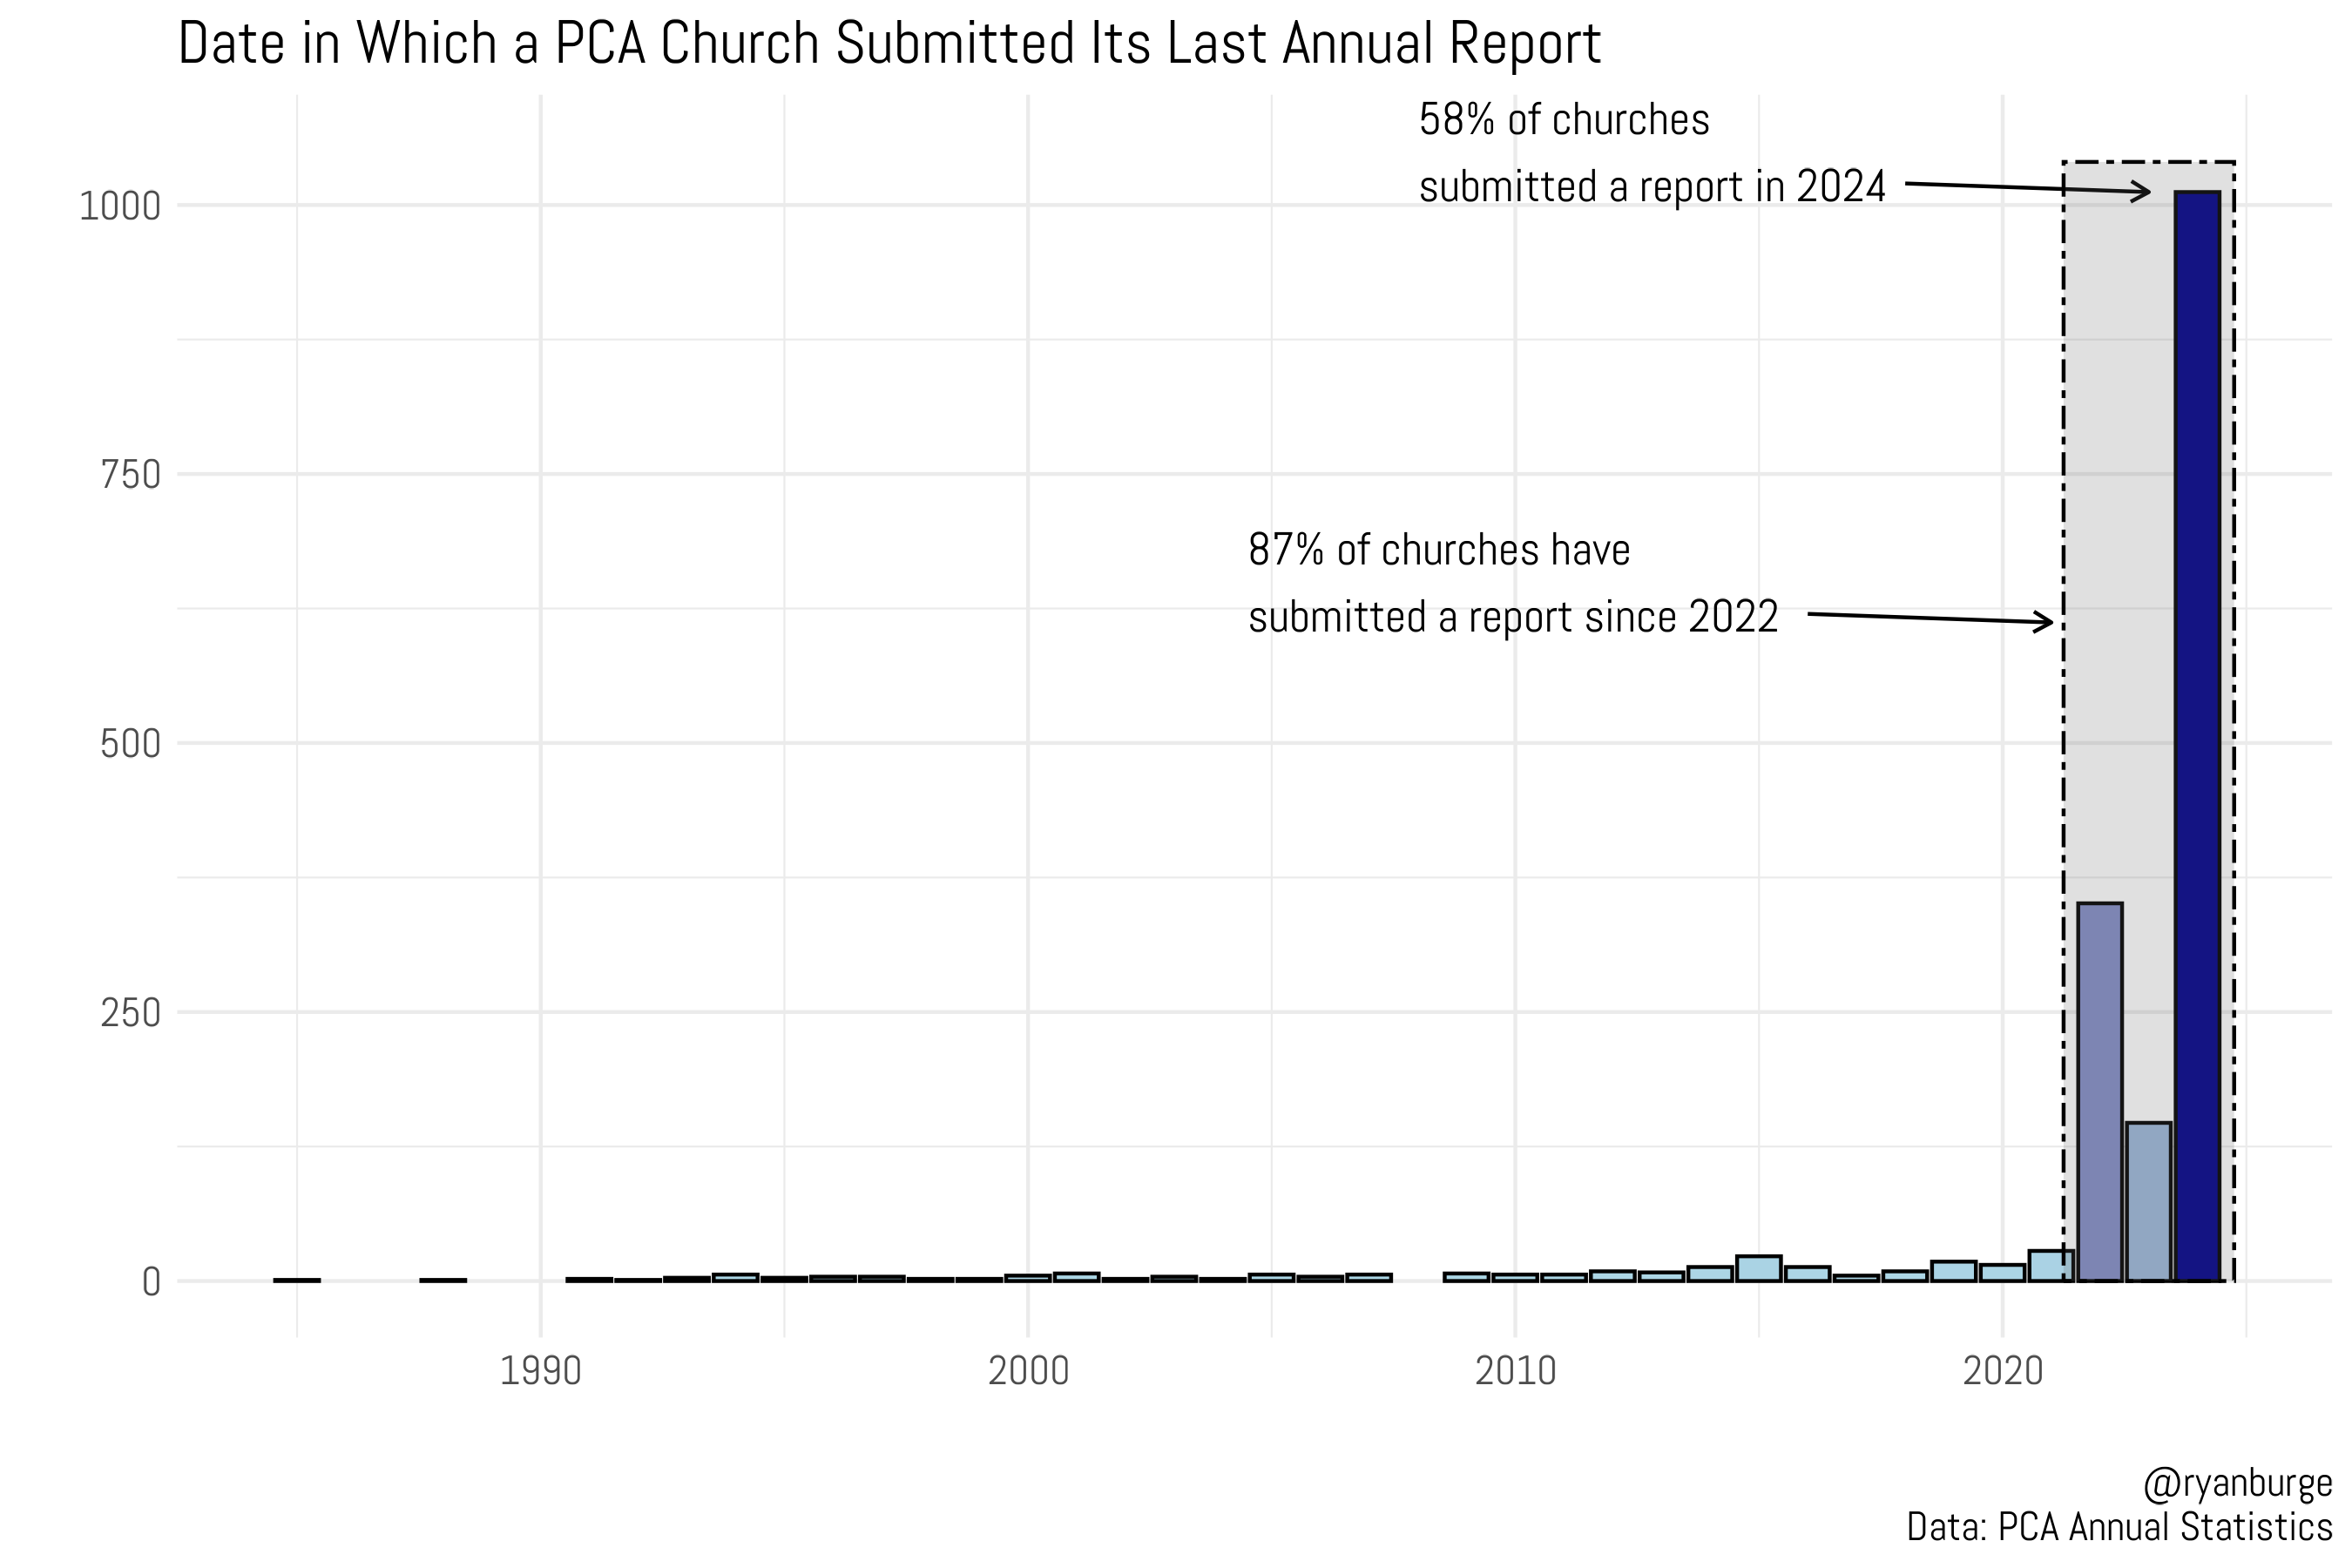
Here’s an interesting data nugget - there’s a PCA church that last submitted an annual report in 1985. But that’s certainly not the norm. In fact, most churches are really good at submitting statistics on a regular basis. According to the file I downloaded, 58% of them put together a submission in 2024 and nearly 90% of all the churches in the database had furnished information in 2022 or later. That’s a strong compliance rate! That means that we aren’t dealing with stale numbers here.
For this point forward, I am just going to restrict my sample to churches that have submitted a report from 2022, 2023, or 2024. Let’s start by showing you some information about the size of churches in the PCA.