


Today’s post is going to be a bit different than the usual stuff you get on my newsletter. Instead of just focusing on a single question and making a bunch of graphs that try to figure out that causal puzzle, I am going to share a few things that I’ve learned after doing this kind of work for the last ten years.
I see people make assumptions about data and statistical analysis that just make me scratch my head. So, this is a rant of sorts. A short list of things that come up again and again when I post any type of graph on social media.
You better believe that I’m going to be dropping this link into my replies on dozens of occasions in the future.
The average rate of public opinion change is much slower than people anticipate.
I can’t tell you how many times I will post a graph that has data collected in 2024 and shows no major changes in public opinion and someone will reply, “If you had data from 2026, I’m sure it would show a lot of movement.” That kind of response is just so divorced from how public opinion actually works that I feel like I need to take some time to really lay out how wrongheaded it is.
For those aspiring data analysts out there who are just learning how to code and make graphs, let me give you a piece of advice — if you see a survey question that has been asked with regularity over a long time move more than 3-4 points in a short window of time (less than two years), then you need to check your code again. It is highly unusual for stuff to shift that much that quickly.
Take, for instance, the General Social Survey’s question about allowing a woman to have access to an abortion if she wants one for any reason.
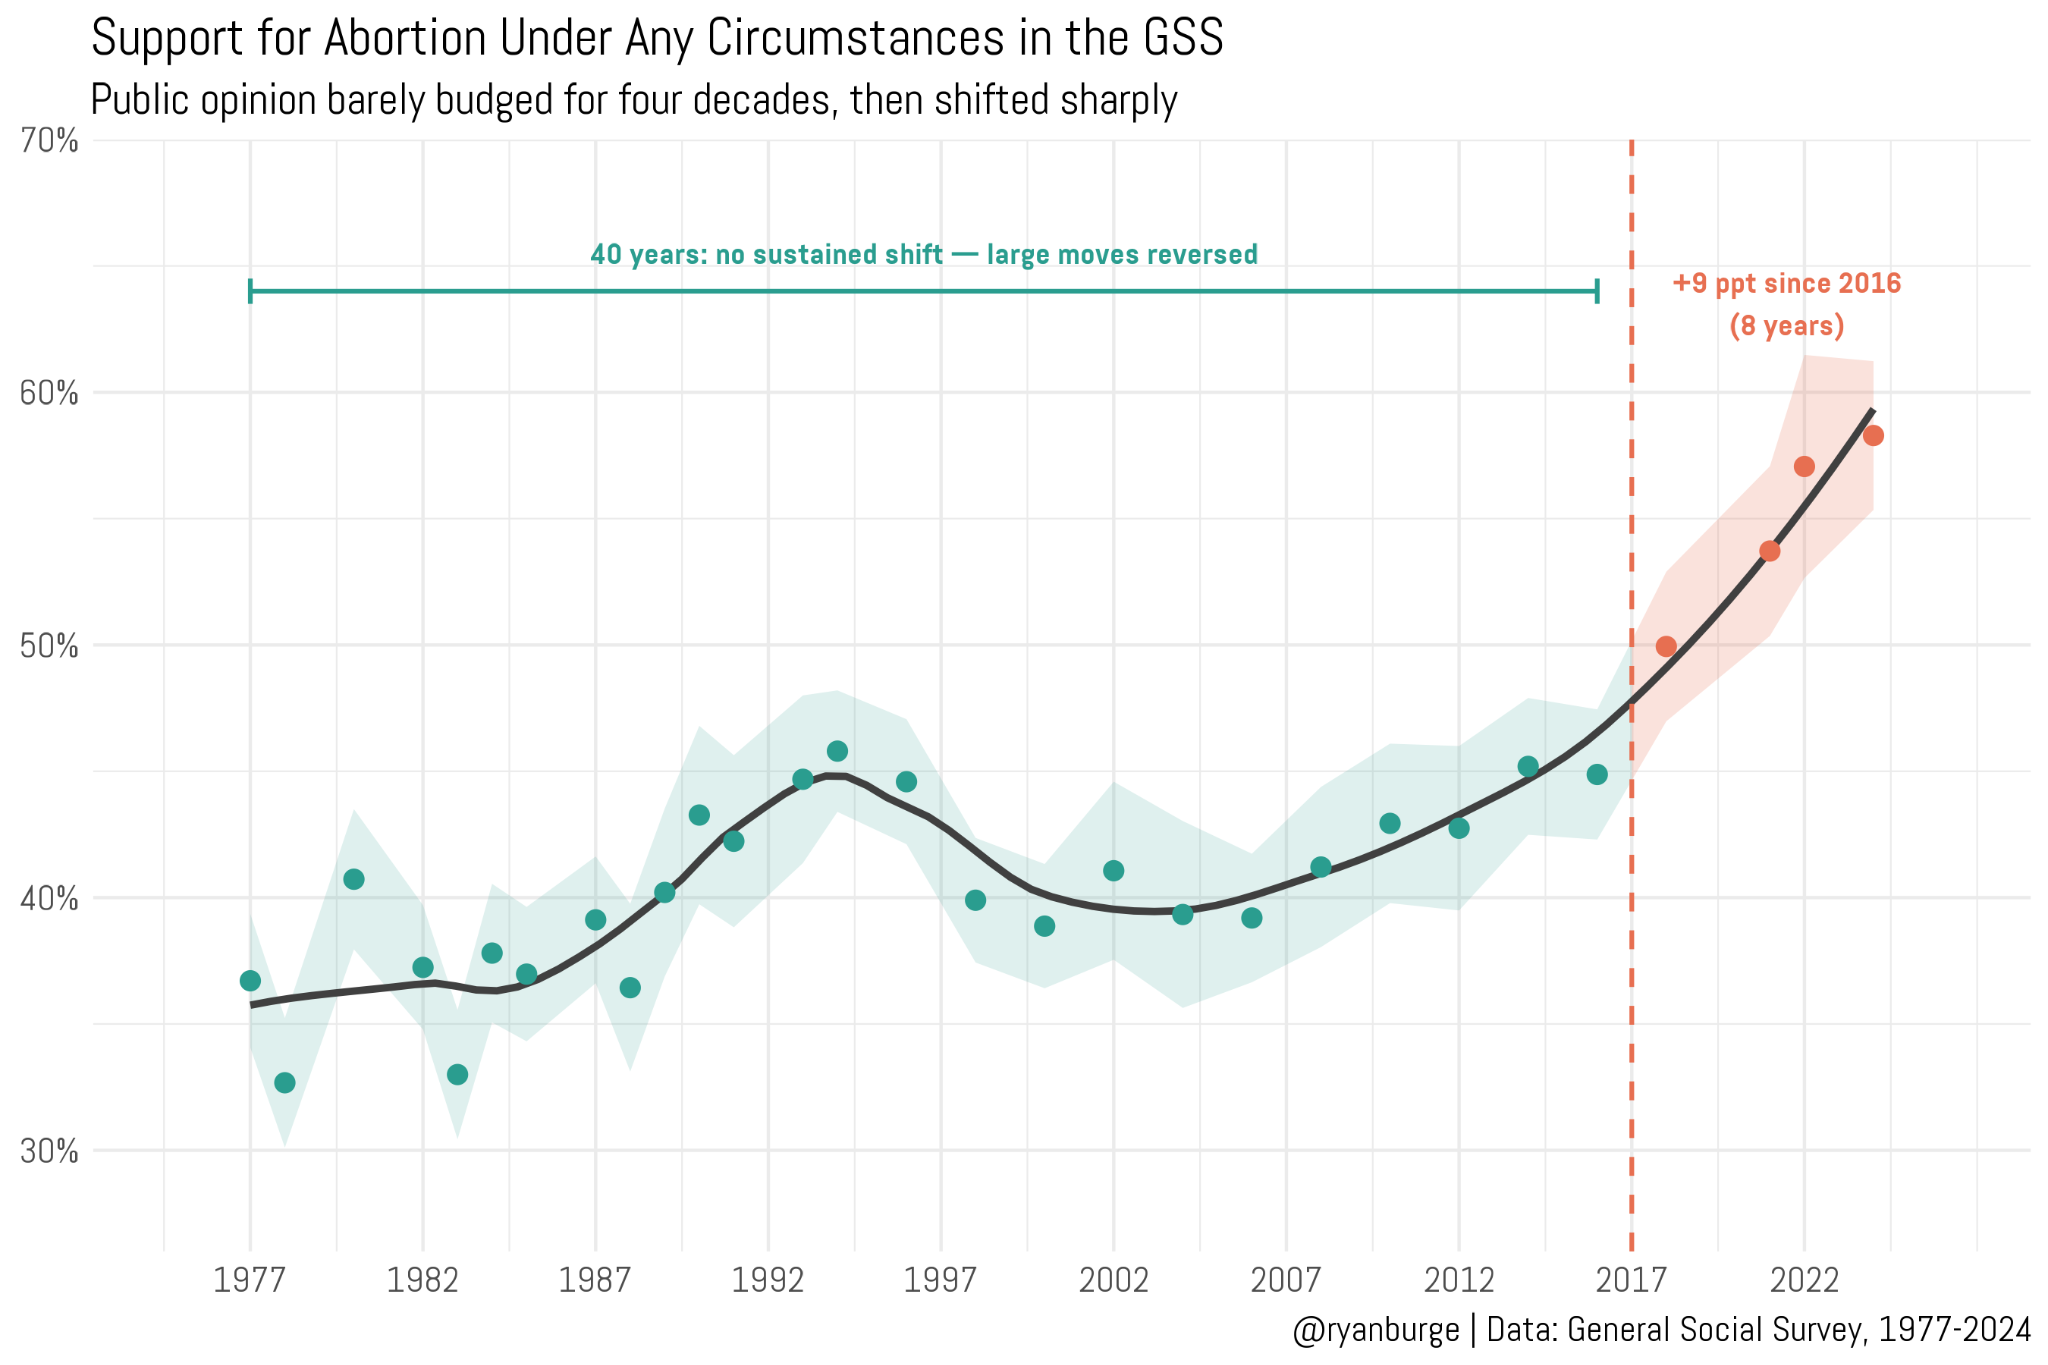
If you track the individual points over time, there’s one really weird aberration between 1978 and 1980 when support for abortion jumped 8 points. In terms of actual percentages, it was 33% to 41%. But here’s the other part of the story — in 1982 it was already down to 37% and then it declined to 33% in 1983. So a complete reversal in a span of five years. You see this same thing happen between 1991 and 1998 — a temporary rise, then all those gains were given back.
You know what the average change is year to year in this graph? It’s 2.6 points. Which is inside the margin of error for most samples. But as you can tell in how I annotated the graph — something happened between 2016 and 2018. I think we all know what I’m talking about right now. In that two-year window, support for access rose from 44.8% to 49.9%. A full five percentage points. Now, that could have just been polling noise, right? We would be right to be cautious about writing a story with a headline about the huge surge in pro-choice views.
But here’s how we know that’s the real deal — the trend has continued. In 2021 it rose again to 53.1%, up nearly four more points from the prior survey. Then in the last two years it was 57% and 58% respectively. Which is more plausible: that every year of the GSS from 2018 through 2024 has just “missed” on this question in the same way? Or did an external event (or series of events) lead to a macro-level change in opinion?
Also, don’t let me forget to point out the fact that the last couple of surveys have “calmed down” on the movement after a whole bunch of rapid change. There was a total of ten points of change in four decades of polling. Then, we see a clear directional shift that can be easily traced to an external set of political events.
The average person thinks that THEIR world is THE world.
I get a version of this email about once a week. A reader, usually a thoughtful one, writes in with a question they’re sure is right in my wheelhouse. Here’s a recent example: “Have you worked on the question of whether the error of Christian Zionism and/or Dispensational theology is waxing or waning in American or global Christianity? Seems right up your alley.”
I understand why people think this is a survey question. It’s about religion. It’s about change over time. Those are the two things I write about every single week. The person that emailed is probably an evangelical pastor and went to seminary. They can read Hebrew and they listen to podcasts about minute details of Koine Greek. A lot of their friends are pastors and they stay up late at night debating pre-trib vs. post-trib.
In other words, they come from a very specific subset of the American population. Which makes a question like this basically unanswerable with survey data, and the reasons why tell you a lot about what surveys can and cannot do.
Think about what happens if I field a general population survey of 1,000 Americans (which would cost thousands of dollars) and try to say something about dispensationalism.
Start at the top: about 60% identify as Christian. We’re already down to 600.
But dispensationalism is a particularly evangelical phenomenon. Catholics don’t teach it. I don’t think that the local Episcopal Church is holding a mid-week Bible study on the rapture. The Orthodox have never heard of it. So we’re really talking about the quarter or so of the country that’s evangelical. Now we’re at roughly 230 (maybe even less).
But a belief system doesn’t transmit itself — somebody has to teach it to you, and that means being in the room. Less than half of self-identified evangelicals are in church on a given weekend, and regular exposure is what it takes to absorb an entire theological framework — not just watching Kirk Cameron in a low-budget movie about eschatology.
We’re now down to 110 people.
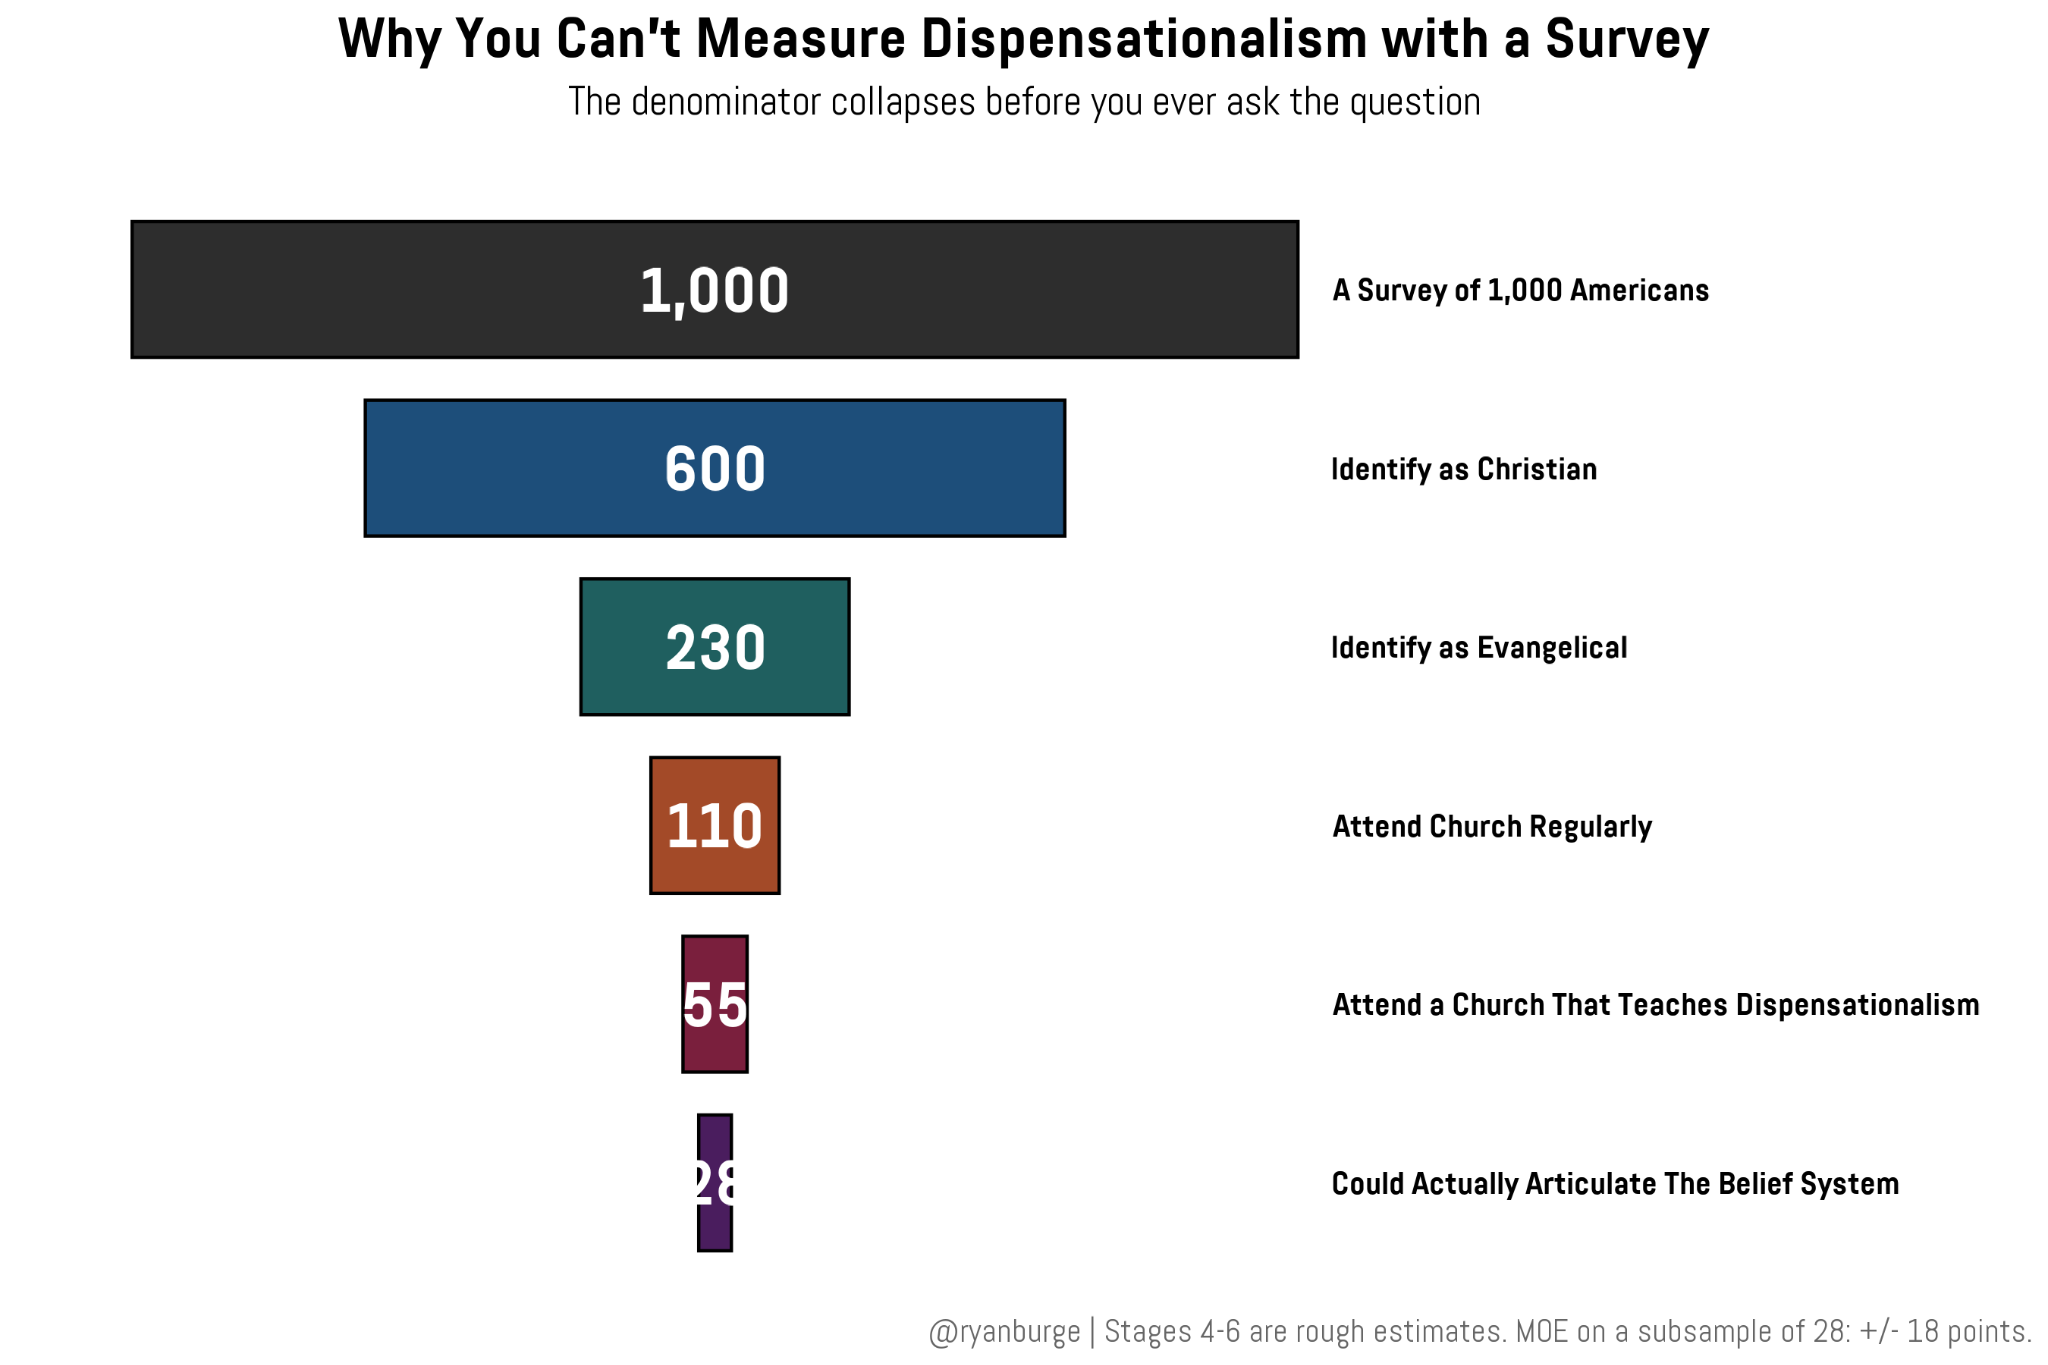
Now, of those 110, how many attend a church where the pastor actually teaches dispensational eschatology? Plenty of evangelical pulpits — and nearly all of the non-denominational megachurches absorbing everyone these days — are functionally agnostic about the end times. The pastor is vaguely premillennial, never preaches Revelation, and would rather talk about your marriage or how to raise decent kids. When’s the last time Joel Osteen preached about this topic? Without googling it, I’m going to say “never.” But I’m going to be generous and say half. We’re at 55.
And then the final cut: of the people sitting under that teaching, how many could articulate it well enough to answer survey questions about it? Knowing your church believes in the rapture is not the same as holding a position on the timing of the tribulation. Maybe half again, and I think that’s on the high side.
So my survey of 1,000 Americans contains perhaps 25 or 30 people capable of telling me anything meaningful about dispensationalism. The margin of error on a subsample of 30 is plus or minus 18 points. I could field that survey twice and “find” that dispensationalism doubled. Any trend I claimed to detect would be statistical noise wearing a headline.
This is the part of survey research nobody tells you about: the questions get harder to answer not because they’re more profound but because the denominators get smaller. I can tell you about Christians with great precision. Evangelicals, very good precision. Weekly-attending evangelicals, decent. Weekly-attending evangelicals in prophecy-teaching churches who know what pre-tribulationism is? At that point I’m not doing statistics anymore. I’m doing anthropology with extra steps.
The average American is really bad at guessing the size of religious groups.
If you’ve hung around here enough, you’ve heard me bellyache about this one on a regular basis. So much so that I wrote a full post entitled, “Why I Can’t Tell You How Quakers (or Unitarians) Voted in 2024.” I just can’t tell you the number of comments I get on a weekly basis that ask me to include groups like the Unitarians, Latter-day Saints, Anglican Church of North America, or Presbyterian Church in America. (And yes, I chose those specific groups on purpose, by the way, because those are the ones that appear in my replies with the highest frequency.) In contrast, it’s very rare to have someone ask me about Buddhists or Hindus. The social media crowd is not a complete representation of American religion.
Before I go any further, I want you to stop and in your mind just estimate the sizes of the four groups that I’ve mentioned in the previous paragraph. I know the answer to this because I get asked about it all the time:
UUs have 130,000 members. The Latter-day Saints are comparatively large at ~7 million. The ACNA is 125,000 and the PCA is 405,000. The only one that gets to 1% of the population is the LDS. The other three groups are rounding errors in the grand scheme of things. You want to guess how many Protestant denominations have at least one million members? It’s around 15 of them. How many are larger than 5 million members? It’s one — the Southern Baptist Convention.
A couple of years ago YouGov did this really fun polling experiment where they asked respondents to simply guess what share of the population met a whole bunch of criteria. For instance, what share of Americans are transgender? The YouGov sample said it was 21%. The actual percentage is certainly below 1%.
Well, there were a couple of religious groups that were asked as part of that battery.
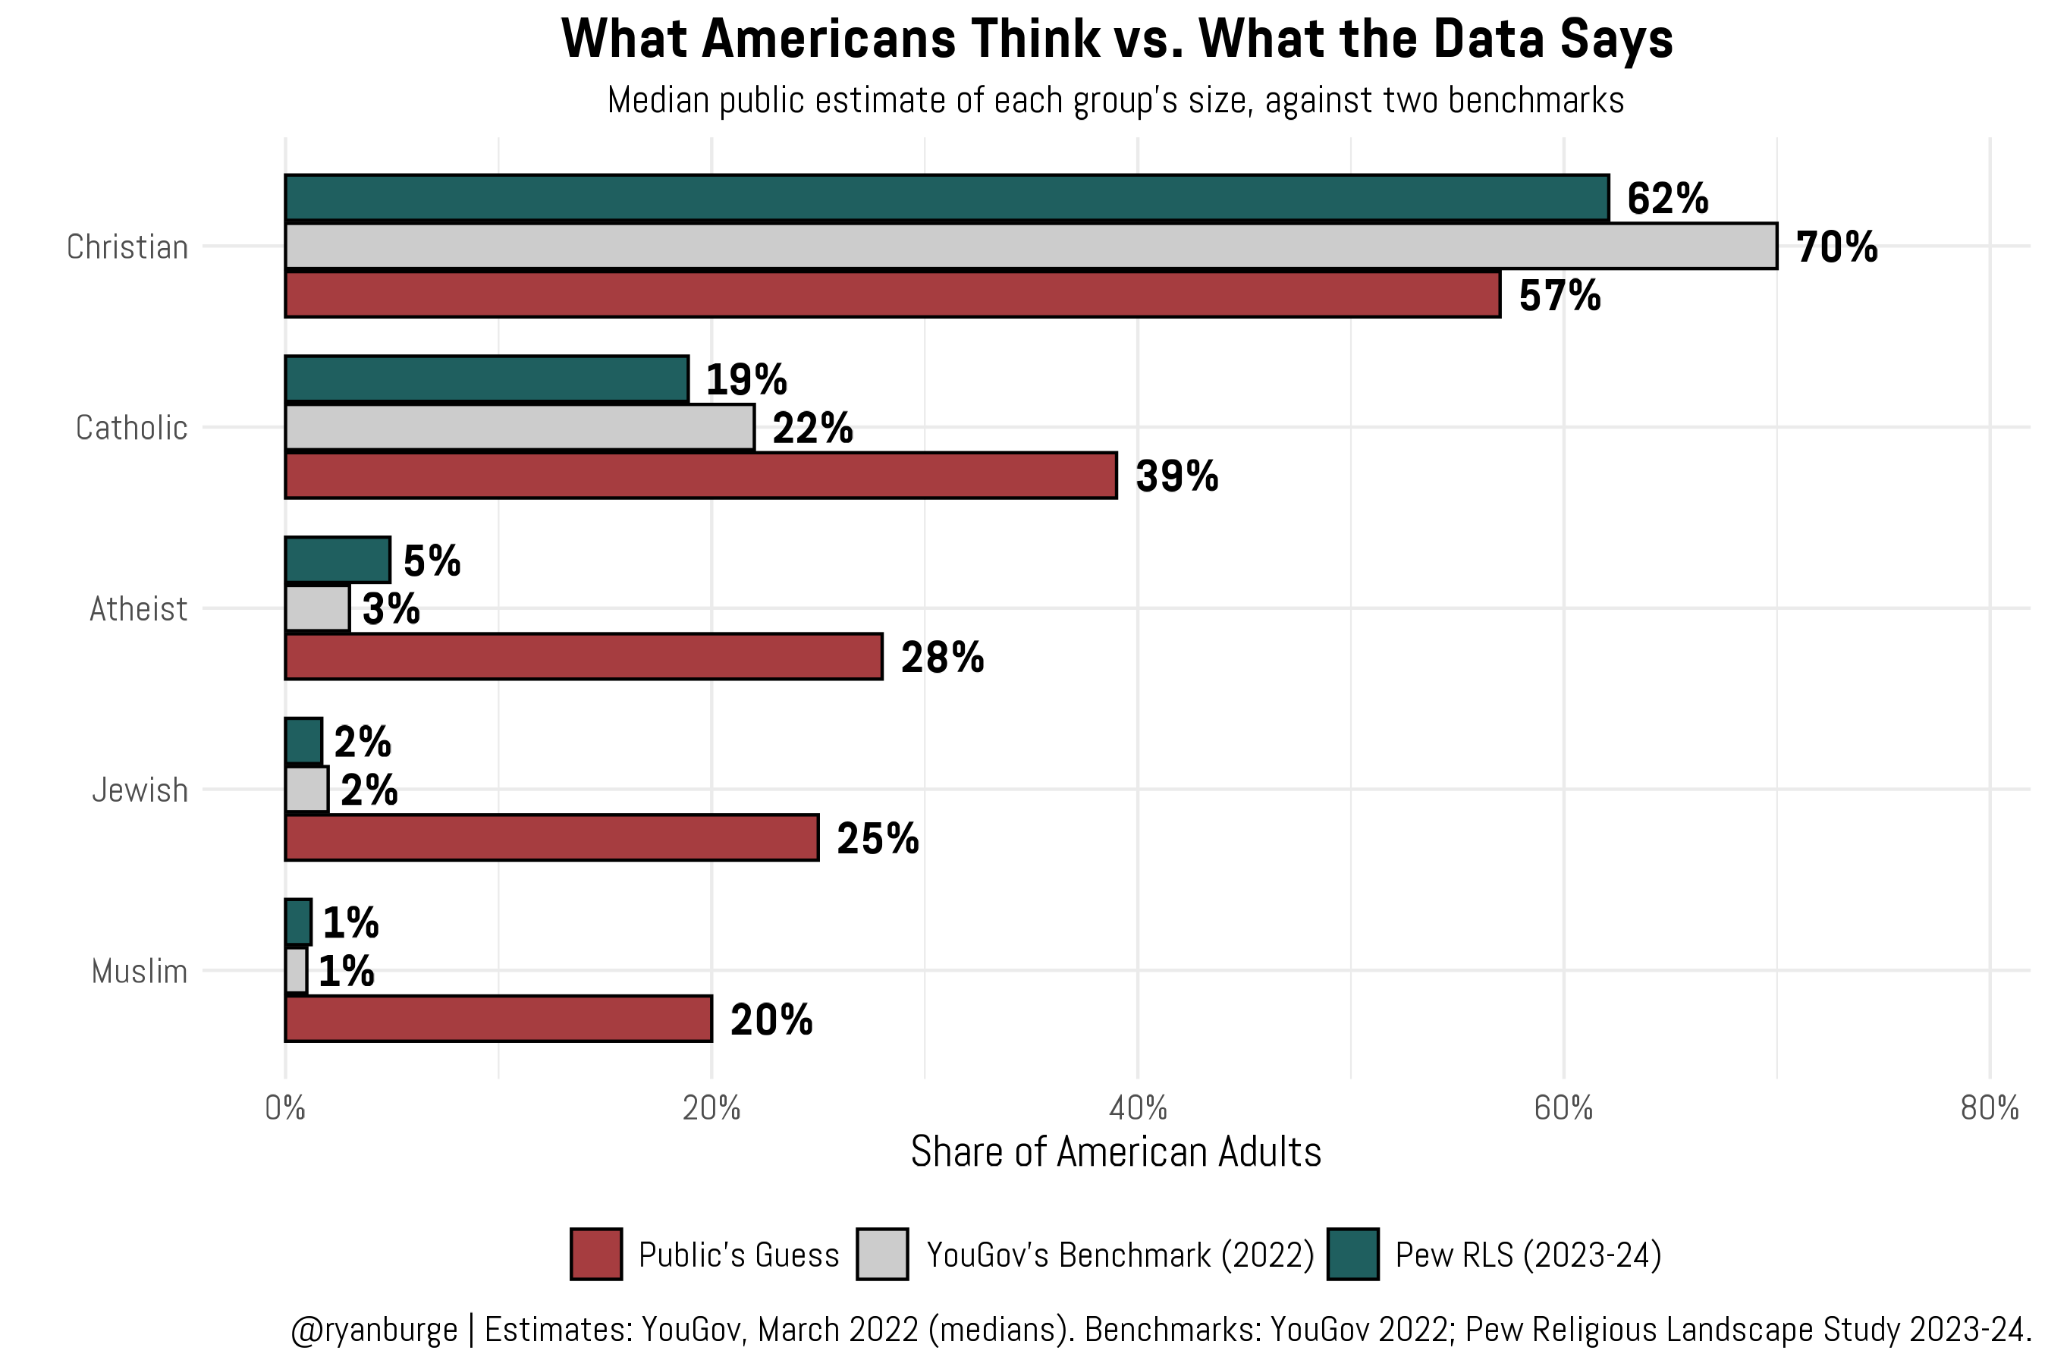
You can see the only one that they got even close on was Christians. The median guess among the respondents was that the United States was 57% Christian. According to YouGov’s numbers back in 2022, it was 70% (which is not right, by the way). The Pew estimate in 2023-2024 was 62%. So, that’s not too bad at all. And even when it comes to Catholics, the public wasn’t off by that much. The median guess was that 39% of Americans are Catholic. The real number is closer to 20%.
But when it comes to really small religious groups, things just go sideways. The median guess as to the share of Americans who are atheist was 28%. It’s about 5% in actuality. Americans think that a quarter of our country is Jewish when it’s really about 1.5%. And then the median guess regarding Muslims was 20%, when it’s really closer to 1%.
This touches on something that I have been thinking a lot about lately — people LOVE the idea of outliers. Their minds fixate on the one person who bucks the trend or the one religious group that they don’t know much about but have seen a few TikToks that describe them. There are shows about the secret lives of Mormon wives. There aren’t shows about a bunch of Methodists living in Cedar Rapids, Iowa. The LDS seem exotic for some reason.
Whenever I post a graph that points to the fact that a significant majority of Americans will die with the same faith that they were born into (65-70% of us), you know what the first comment will be? “Well, I grew up a fundamentalist Pentecostal, then converted to Orthodox Judaism, and am now a pantheist who dabbles in Buddhism.” Americans hate being average. They want to be different and they are very proud of that fact.
My job, though, is to describe the median outcome, not the odd one. The work of quantitative social science is to generalize. That really rubs a lot of people the wrong way. Such is my lot in life.
After all that, I can only say one of two things: “You’re welcome” or “I’m sorry” for taking you through what the world looks like from my perspective on a day-to-day basis. It’s fun. And frustrating.
I’m probably going to be doing this for the rest of my life. Maybe one day I’ll get used to it.
Code for this post can be found here.
Ryan P. Burge is a professor of practice at the Danforth Center on Religion and Politics at Washington University.

"After all that, I can only say one of two things: “You’re welcome” or “I’m sorry” for taking you through what the world looks like from my perspective on a day-to-day basis. It’s fun. And frustrating."
I say that your work is very interesting and I look forward to every post. I can't believe that you're able to post not one but two compelling article every week. Where do you get the time?
Question, since I do not have your email address: Can you (or have you) post on the average number of parishioners per minister/priest/whatever per denomination?
Thanks or your work!
I might watch a show about Cedar Rapids Methodists!