

How Many Weekly Attenders Are There in Major Denominations?
My best guess using all the data I can get my hands on

Sometimes the best questions come in emails. That’s the case for the post today. The query was a pretty simple one - “could you tell me how many Presbyterians or Lutherans are attending church every week?” That, surprisingly, is not a really easy question to answer. Some denominations are very good at releasing high level statistics like total number of members, very few actually get into much more nuance.
However, I know of two denominations where that information exists and I can get my hands on it (reasonably) easily. One is The Episcopal Church (TEC). They are great because they are so forthcoming with their data. They not only publish members and attendance, they also put together statistics on baptisms, confirmations, weddings, and burials. What a treasure trove of information that allows post like this to happen:
The State of the Episcopal Church in 2022

For whatever reason, people want to read about the demise of the Episcopal Church. I know this for a fact because every time I would pull together the latest stats about TEC for Religion in Public, it would give tons more clicks than anything else I wrote.
The other denomination that is good about publishing a fair amount of data is the Southern Baptist Convention. They have an entire research group called Lifeway Research that is tasked with collecting and analyzing data about Southern Baptists in every state. Getting yearly attendance numbers was a bit harder (it required digging through dozens of PDFs from the last several decades), but the data is still out there if you look hard enough.
The 2022 Data on the Southern Baptist Convention is Out

I grew up Southern Baptist. Went to church every Sunday as a kid - morning and night! We were committed. Baptized in an SBC church. Went to SBC church camps. Then, I left when I went to college and never really came back. My story is not at all unique. But that doesn’t mean I still don’t have a connection with the Southern Baptist Convention. I track th…
So, those two denominations are going to serve as my benchmarking cases to try and figure out the normal ratio of members to actual attenders. Then, I am going to use that calculation to give some best guesses about the actual number of butts in seats for a bunch of other denominations.
Let’s start by comparing the membership of the Southern Baptist Convention with the actual reported attendance of the SBC. I have membership data on the SBC dating back to the 1840s, but I don’t have attendance data. But I just want to look at the more recent numbers. That seems more relevant given the task at hand. So, this is both statistics visualized from 1991-2022.
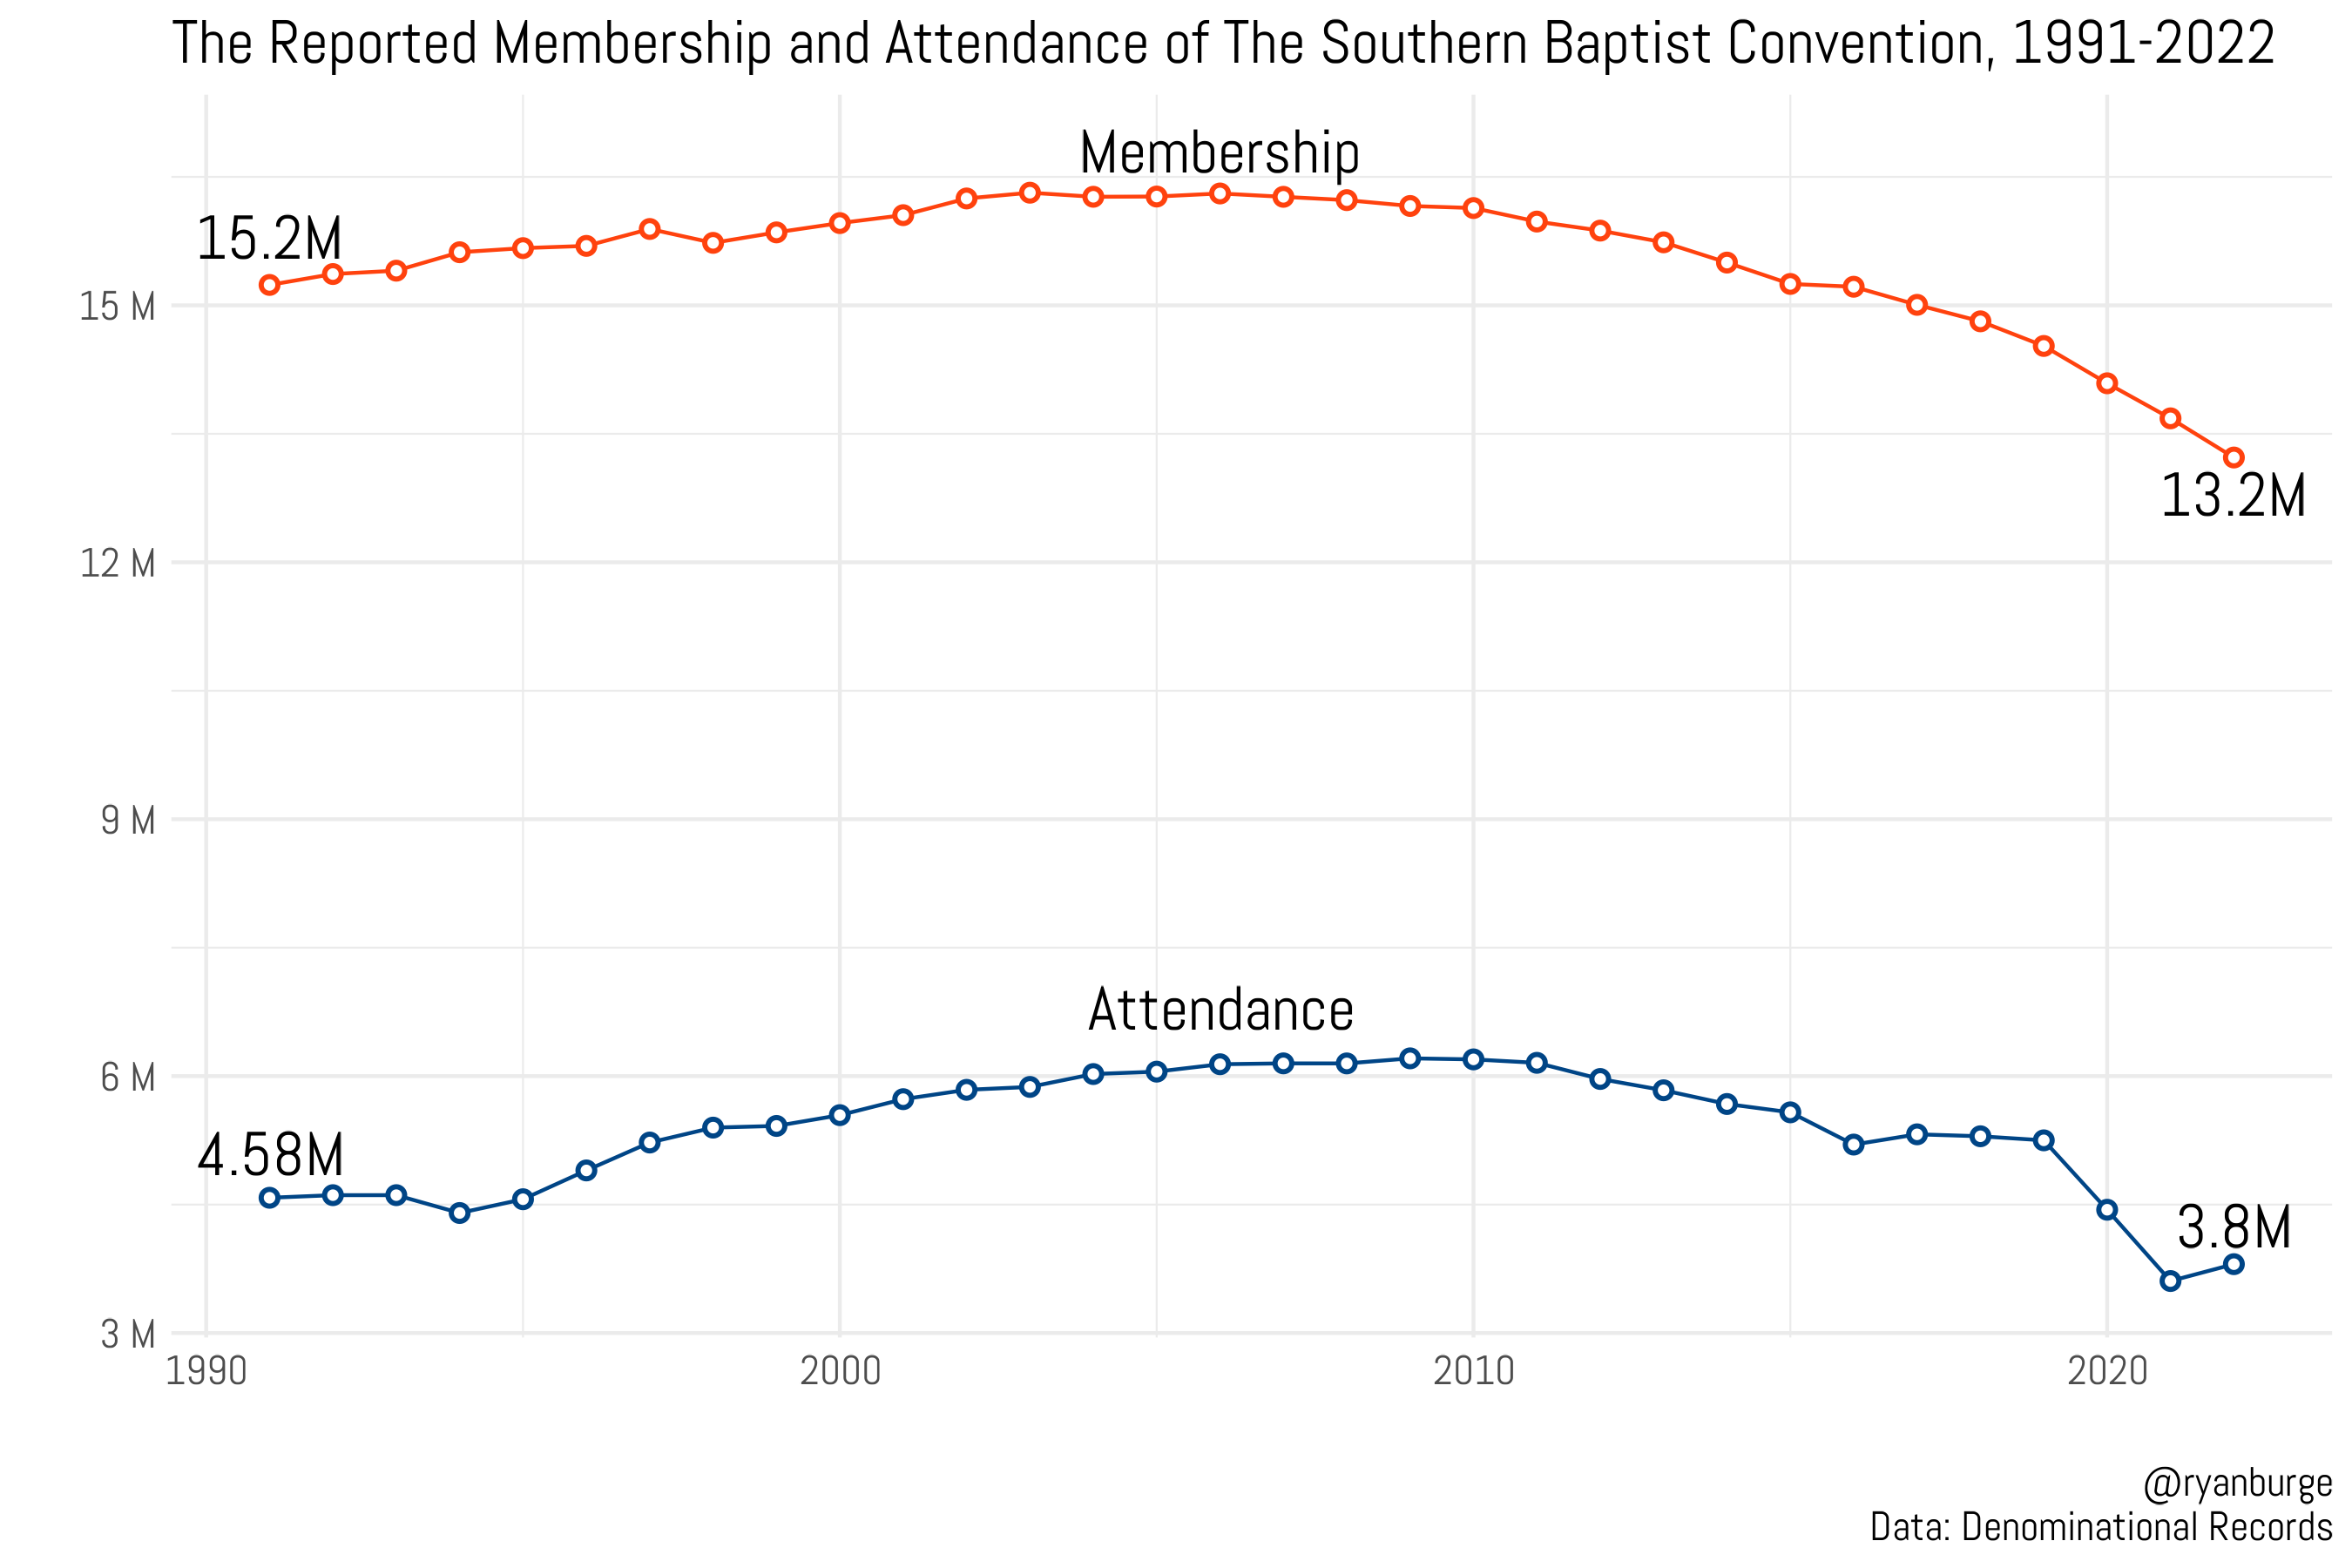
Membership in the early 1990s was just north of 15 million for the Southern Baptists. Growth was very modest during this time period. In the previously linked post I wrote about how unbelievably fast the SBC was gaining members in the post-war period. There was a stretch of time where they would add a million members every four or five years there. That growth engine had clearly cooled by the 1990s and 2000s.
The high water mark for SBC membership was in 2006 when the denomination reported 16.2 million on the rolls. The rollercoaster crested at the top of that hill for a few years and then started into a descent that only gained speed as time has passed. Now, things are bad. The SBC reported drops of 400K members each of the last three years. The latest figure is 13.2M - down three million since the peak.
Meanwhile, attendance has seen a pretty similar pattern - still rising from the 1990s through the mid-2000s. Then a decline in recent years. In 1991, about 4.6 million Southern Baptists were in the pews each Sunday. That attendance figure hit its numerical peak in 2009 when 6.2 million were counted as regular attendees by Lifeway. It’s interesting to me, by the way, that attendance peaked 3-4 years after membership hit its high water mark.
By 2012, attendance fell below six million for the first time. It’s only shown movement in the downward direction since then. By 2019, the last year before the pandemic threw everything in disarray, weekly attendance numbers stood at 5.25 million - down by nearly a million from 2009. The last three years of attendance were: 4.4M, 3.6M, and 3.8M. Clearly a post-COVID rebound, but still missing 1.4 million folks from the “before times.”
I’m more interesting in the ratio, though. That’s the share of total reported members to the share that are actually attending services on a regular basis. That’s the graph below.
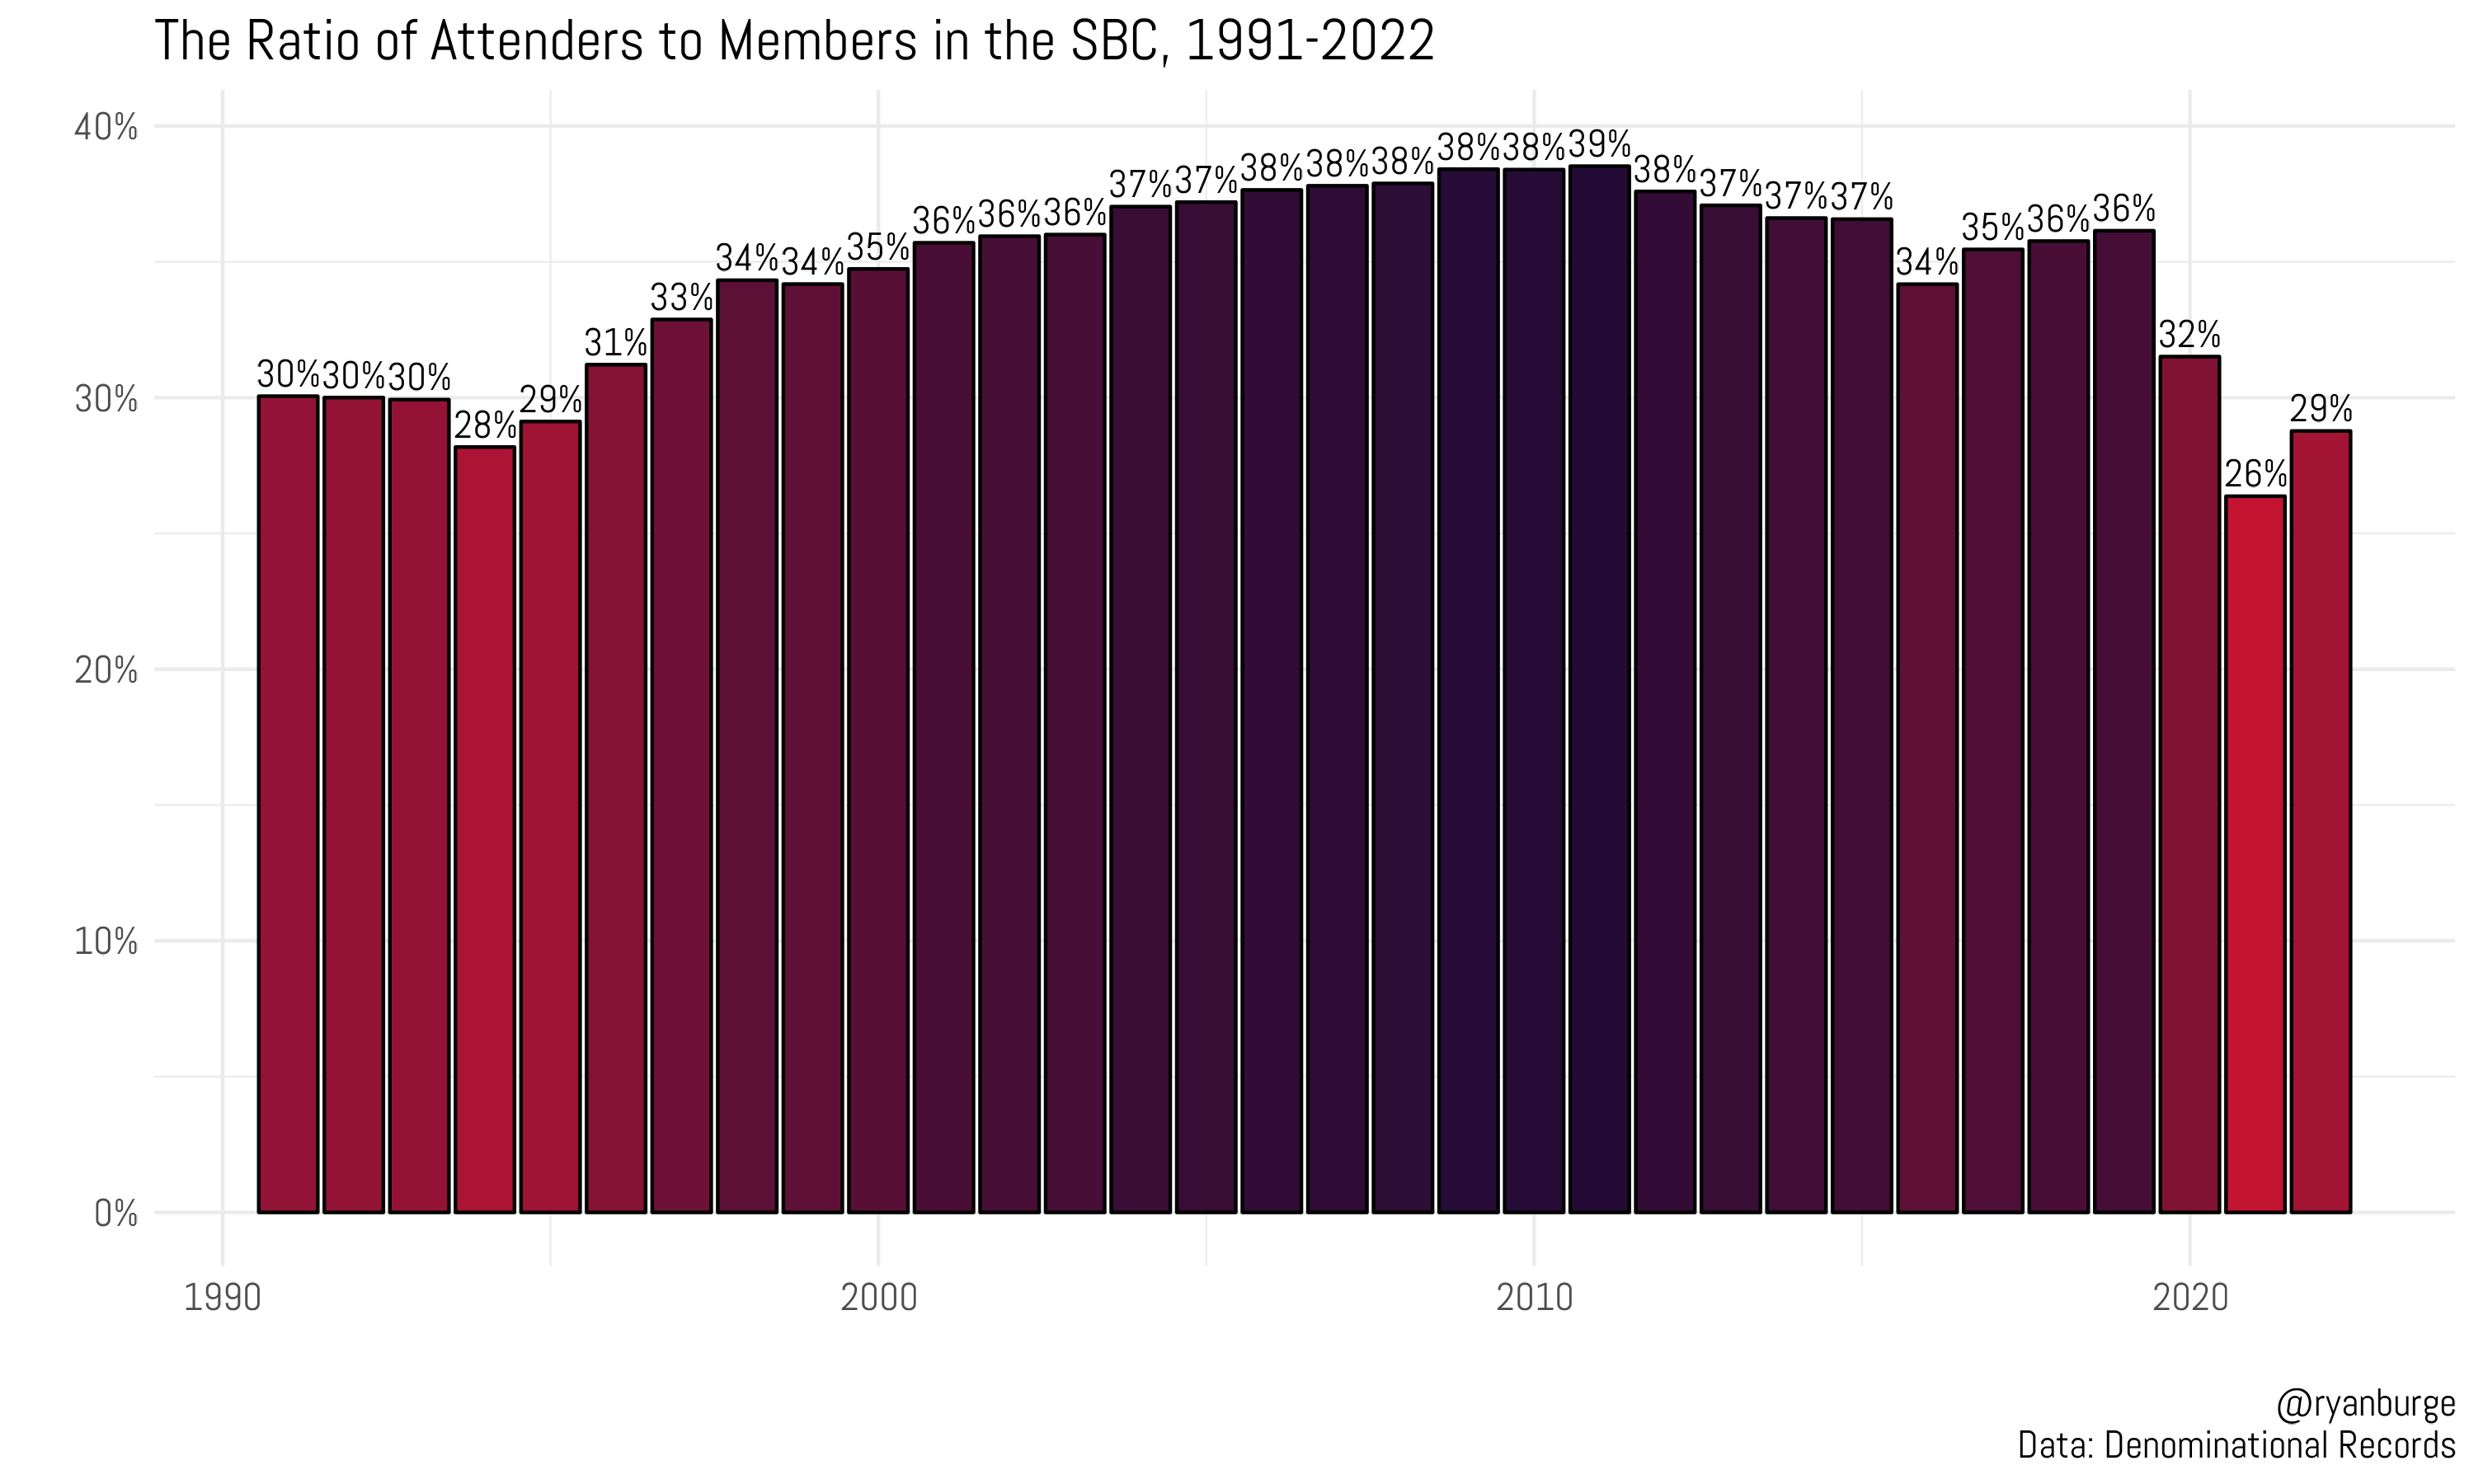
In the early 1990s, the ratio of members to attenders was right at 30%. Then, it started creeping up. By 2000, it was much closer to one in three and continued to move upward for the next decade. The ratio was the highest in a time period running from 2006 through 2012 when it was 38-39%. From that point forward, it started dropping again. The last few years have obviously been all over the place, though. It was as high as 36% in 2019 and as low as 26% two years later.
What’s the overall ratio for this time period? 34.5%. But, I wanted to point something out before moving on to the Episcopalians. I’ve heard some folks say that the reason that the SBC membership numbers have dropped so much recently is because the denomination is trying to clean up its book keeping. Or, said another way, they are deleting folks who have been inactive for decades.
If that were the case then the ratio would have been climbing the last several years, not declining. Because the denominator (number of members) would be getting smaller, while the numerator (number of attenders) would be staying the same. Of course, COVID throws a bit of doubt on that ratio the last few years. But it was 29% in 2022 after some membership purges. It was ten points higher a decade earlier when the rolls were (theoretically) bloated.
