


Where do you go to vote on Election Day? I am assuming that all you readers are actually voting. If you don’t, it’s my solemn duty as a classically trained political scientist to tell you that your vote matters and all that. I’ve voted in a bunch of different places in my life, especially when I was in college and graduate school. One was at a strip mall that had an empty storefront. But thinking back on it now, I think I’ve probably voted in churches more than any other location.
My current polling place is St. Mary’s Catholic Church, where we attend Mass on Sundays. It’s less than a mile from my house and they have a really nice fellowship hall and a parking lot that is really close to the door. I can leave my house, do my civic duty, and get back to my graphs in less than ten minutes most of the time. Democracy is awesome.
But what makes my life so convenient on Election Day is the fact that the local Catholic church is willing to spare some space for the community. If they weren’t willing to allow the county clerk to set up shop there, I’m not entirely sure where I would vote. I’m willing to bet an alternate location wouldn’t be nearly as convenient.
A couple of months ago, I wrote a post about the percentage of Alcoholics Anonymous meetings that take place in houses of worship. Really what I was interested in was the role that churches play as community gathering spots. Now, I want to extend that question to polling places.
Lucky for me (and you), there was a wonderful repository of polling places accessible on the internet. It was compiled by The Center for Public Integrity. Now, they didn’t grab every single state for reasons that I bet they can explain more clearly, but they got most of them. My analysis will include 35 states in total, and I think this data is more than adequate to address the question: How many polling places are in houses of worship?
Now, the data file didn’t have a specific column that denoted which locations were actually in churches, synagogues, mosques, etc. Instead, I had to build a keyword database of terms that would likely show up when that location actually was a house of worship. I tweaked it a bunch and finally got to a spot where I felt comfortable with the analysis.
I had a total of 62,481 polling places from 2020. Of those, 13,598 got classified as a house of worship using my lookup table. That results in 21.8% of polling places being in houses of worship. I think there’s some wiggle room in that, of course. But I feel very confident that 20-25% of polling locations in the United States are in churches, synagogues, mosques, temples, etc.
It varies a bunch by state, though!
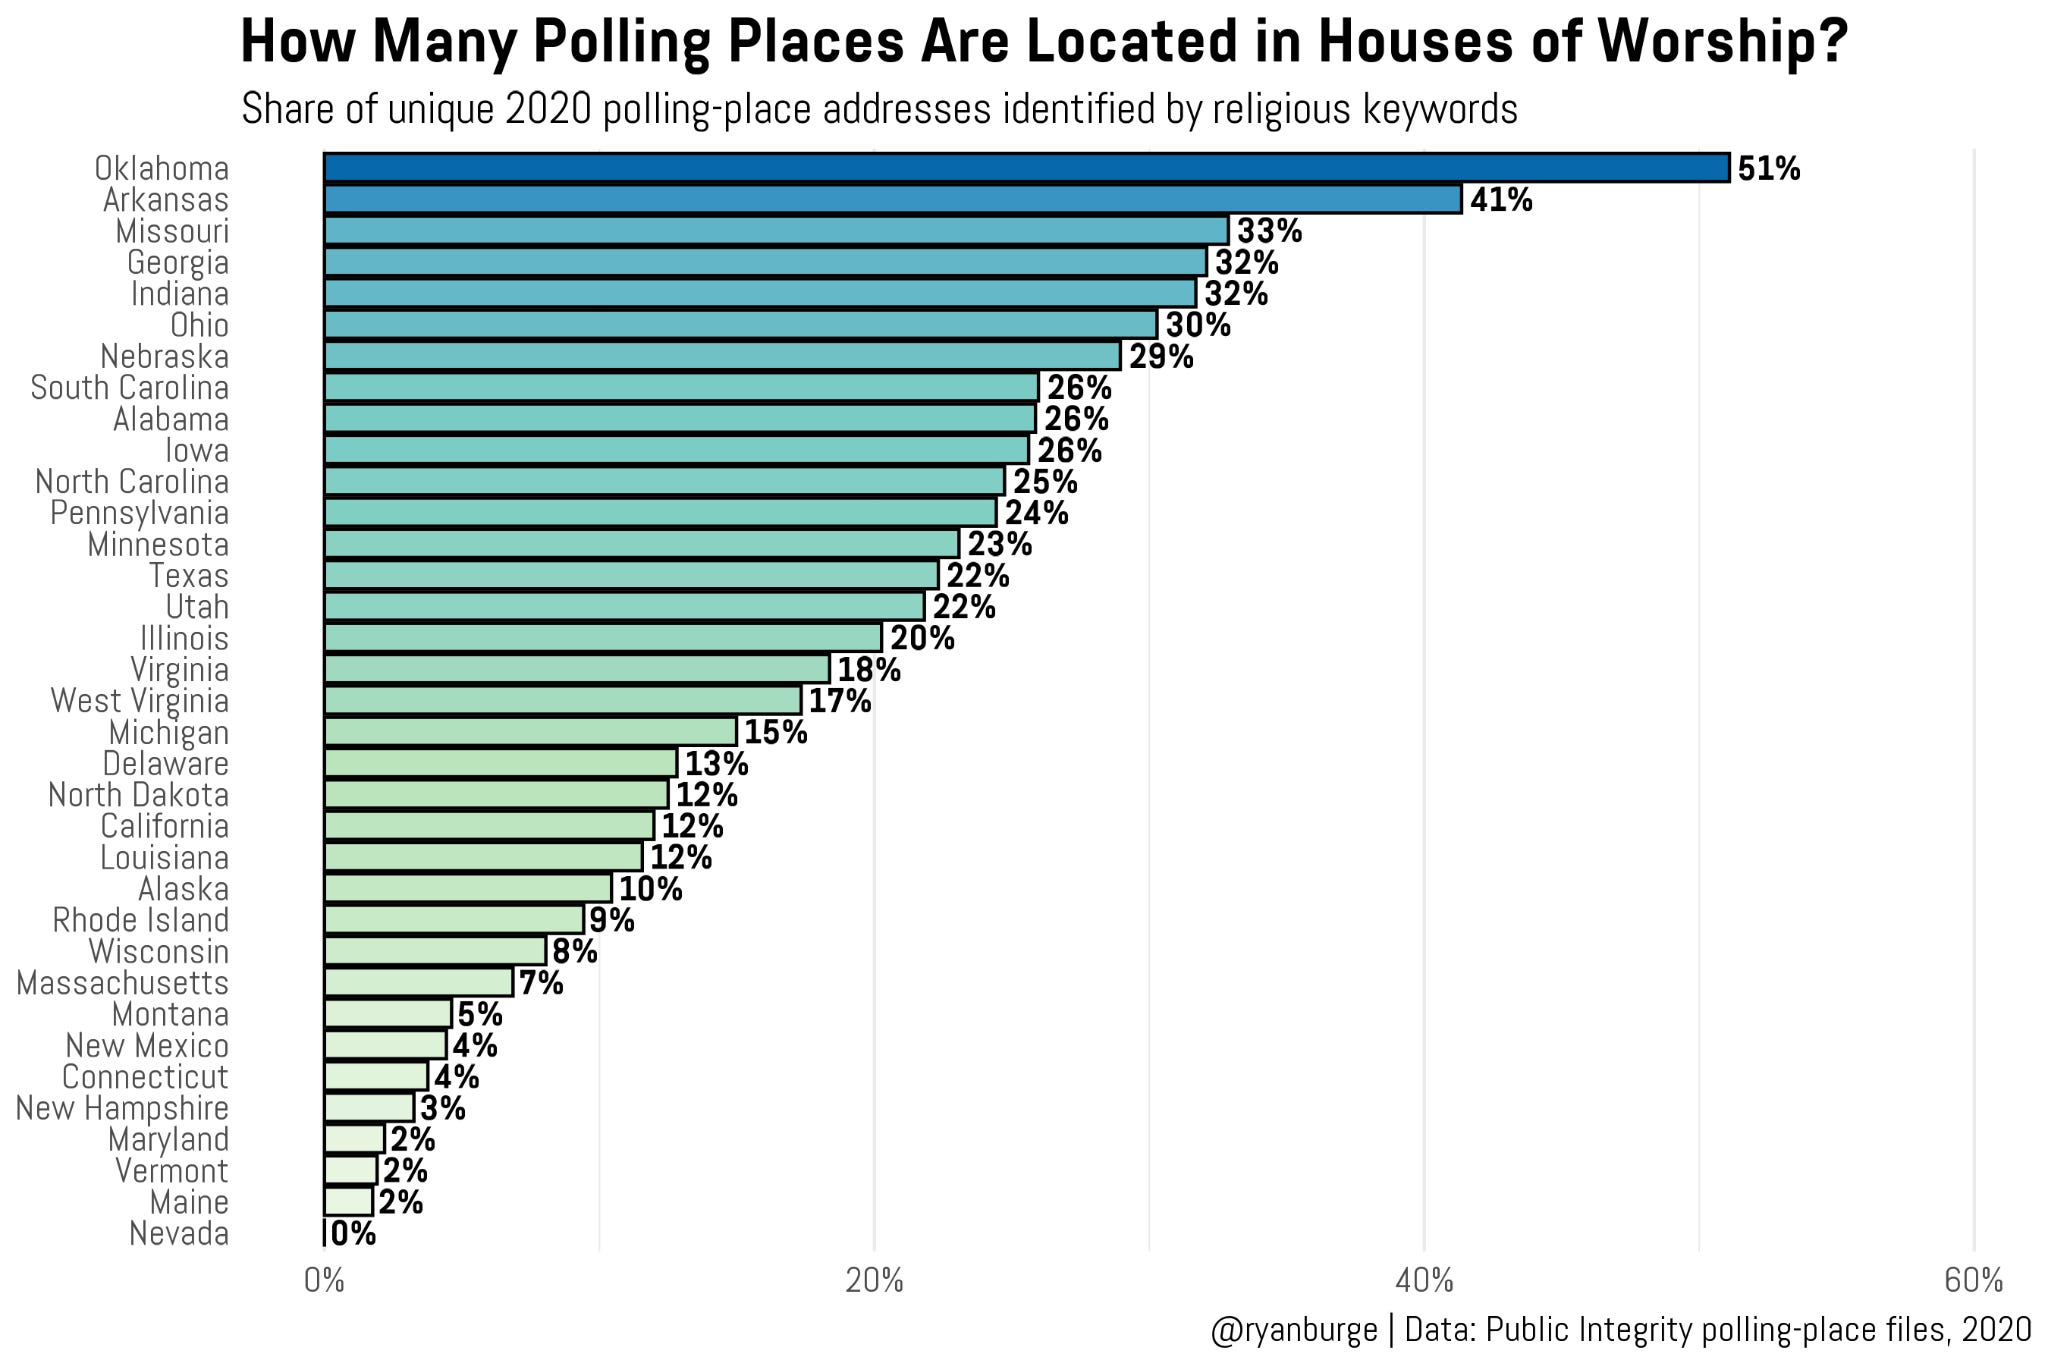
For instance, a majority of polling places in the state of Oklahoma are in churches. That’s the only state where it’s a majority, by the way. You are going to see throughout the rest of this analysis—Oklahoma elections are just different than any other state. The state in second place was Arkansas at 41%. Then, there’s a really big gap before you get to a whole bunch of states that are clustered around 30%.
The states that are the least likely to have a polling place in a church are Nevada at zero percent and then a couple of states up in New England. It was just 2% of polling places in Maine and Vermont, and only slightly higher in New Hampshire at 3%.
But the middle band of entries is this really weird hodgepodge of seemingly random states from all over the country. You have Georgia at 32%, Nebraska at 29%, Iowa at 26%, and Utah at 22%. I just don’t know if there’s any kind of trend there when it comes to the region. I thought that visualizing this as a map would make the spatial component easier to parse out.
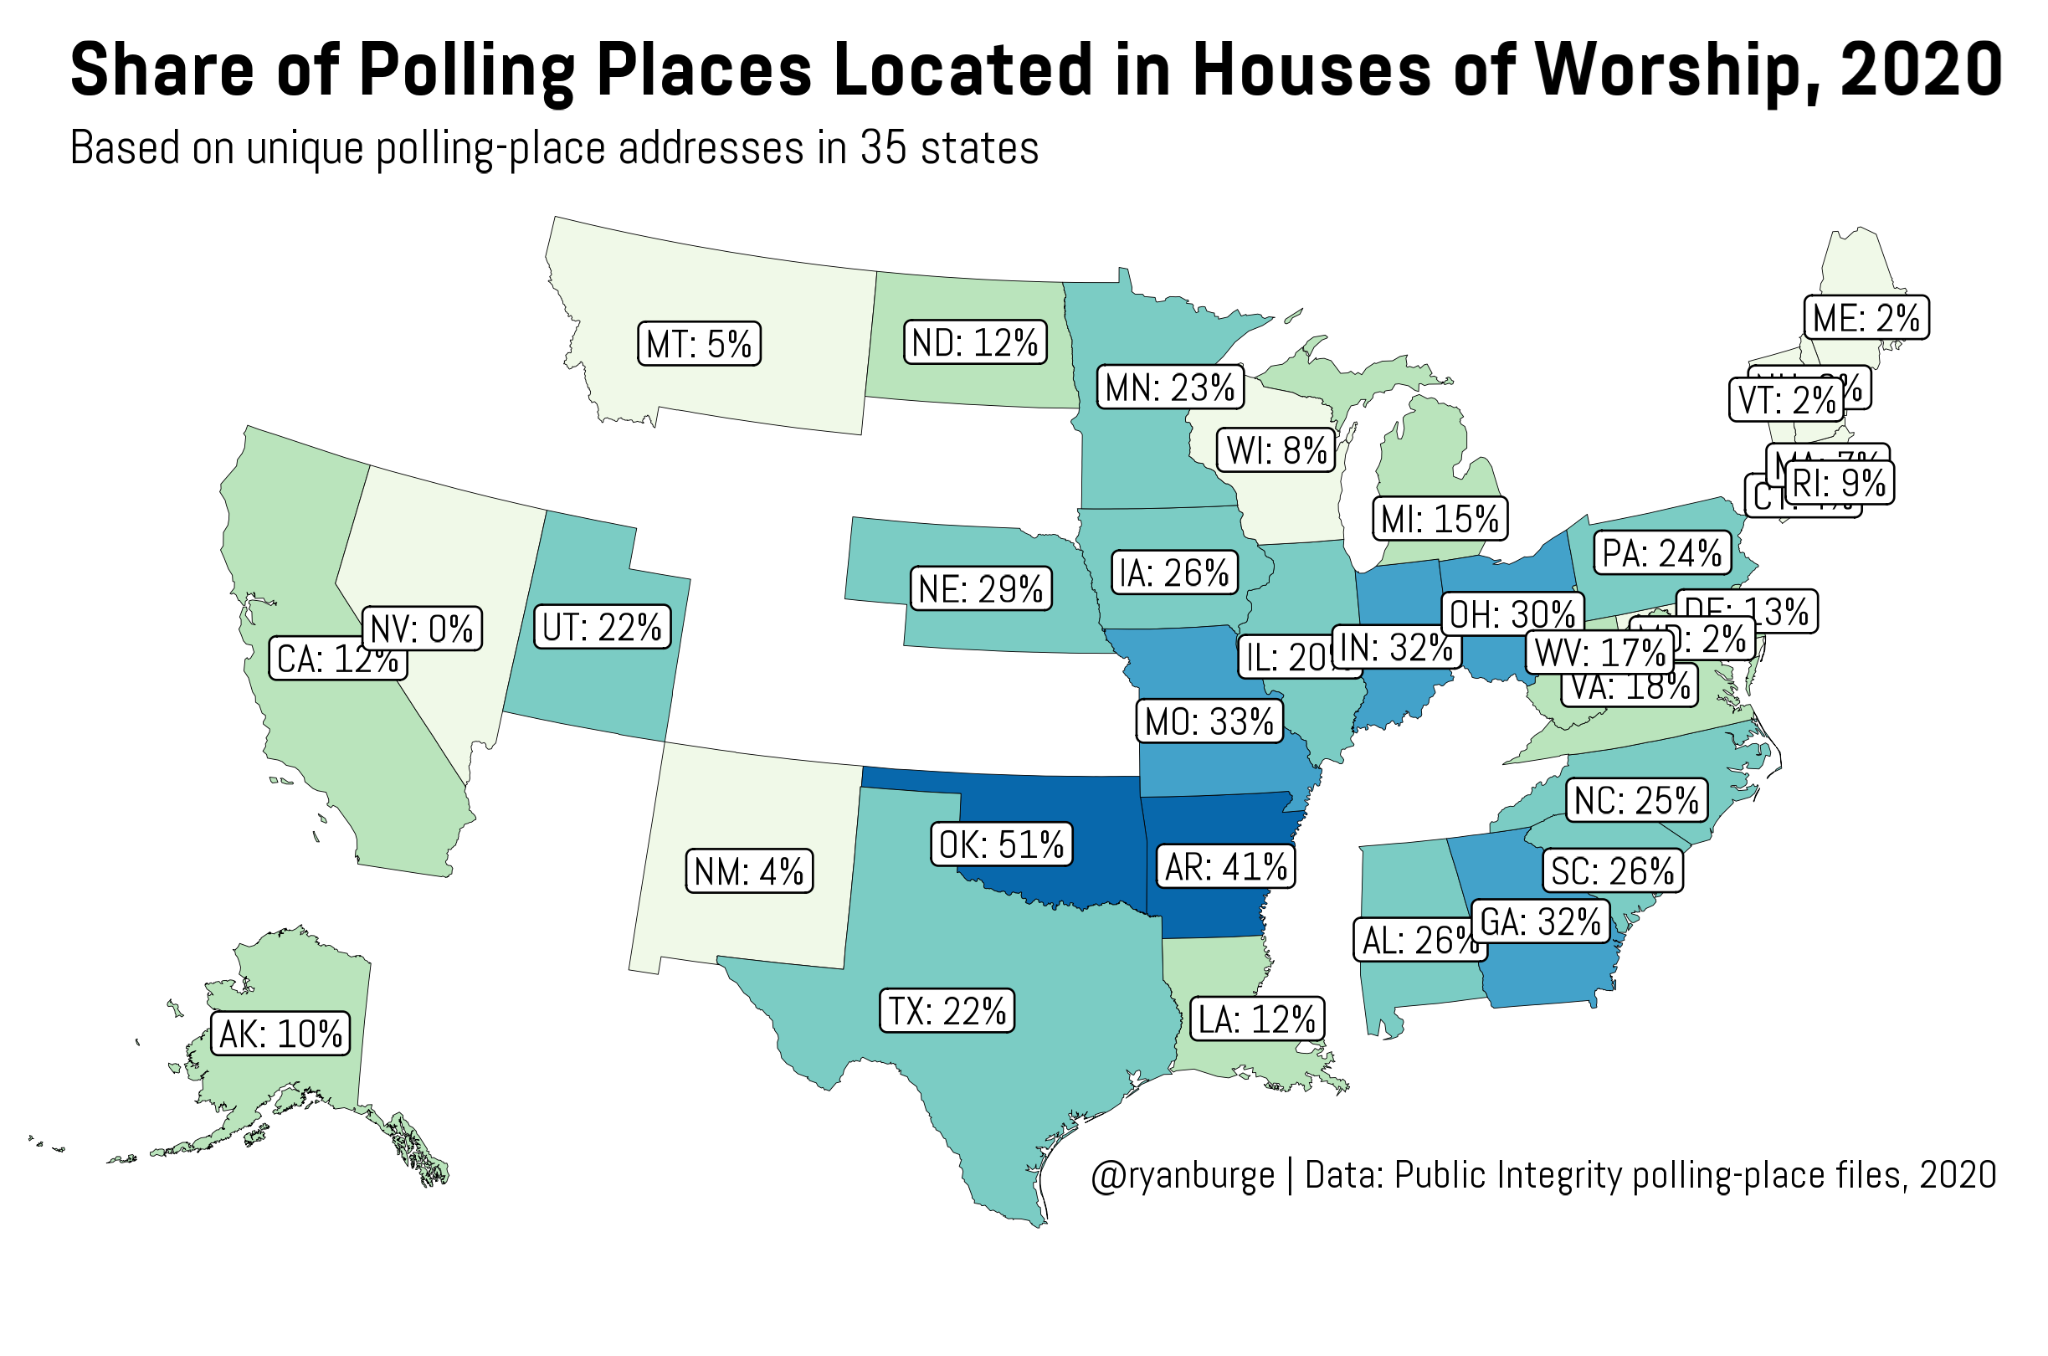
I think seeing the darker blue like this does point to the fact that there is a regional concentration. The clustering of Oklahoma, Arkansas, and Missouri in that top tier really stands out from the rest of the country. But I don’t know if we would typically group those three states together in any regional way. I mean, they are kind of adjacent to the South, but not exactly. Maybe if the database included Kentucky, Tennessee, and Mississippi, it would make it clearer. But I can only work with the data I have.
What’s interesting to me is that as you move away from that deep blue in the epicenter, the shades get lighter and lighter. You still see fairly high percentages in places like Alabama, Georgia, and the Carolinas. But then as you get even further away, you can find places like New Mexico at 4% and Wisconsin at 8%.
Again, I am not entirely convinced that there’s some kind of regional thing going on here. And I’m going to poke around on that a bit more later on in the post.
But before I get to that bit of analysis, I wanted to see if I could identify what type of religious organizations are more inclined to host a polling place. This part wasn’t actually that hard when it came to searching for terms like Methodist, Presbyterian, Baptist, etc. A lot of churches (thankfully) still include their denominational affiliation in the name of the church.
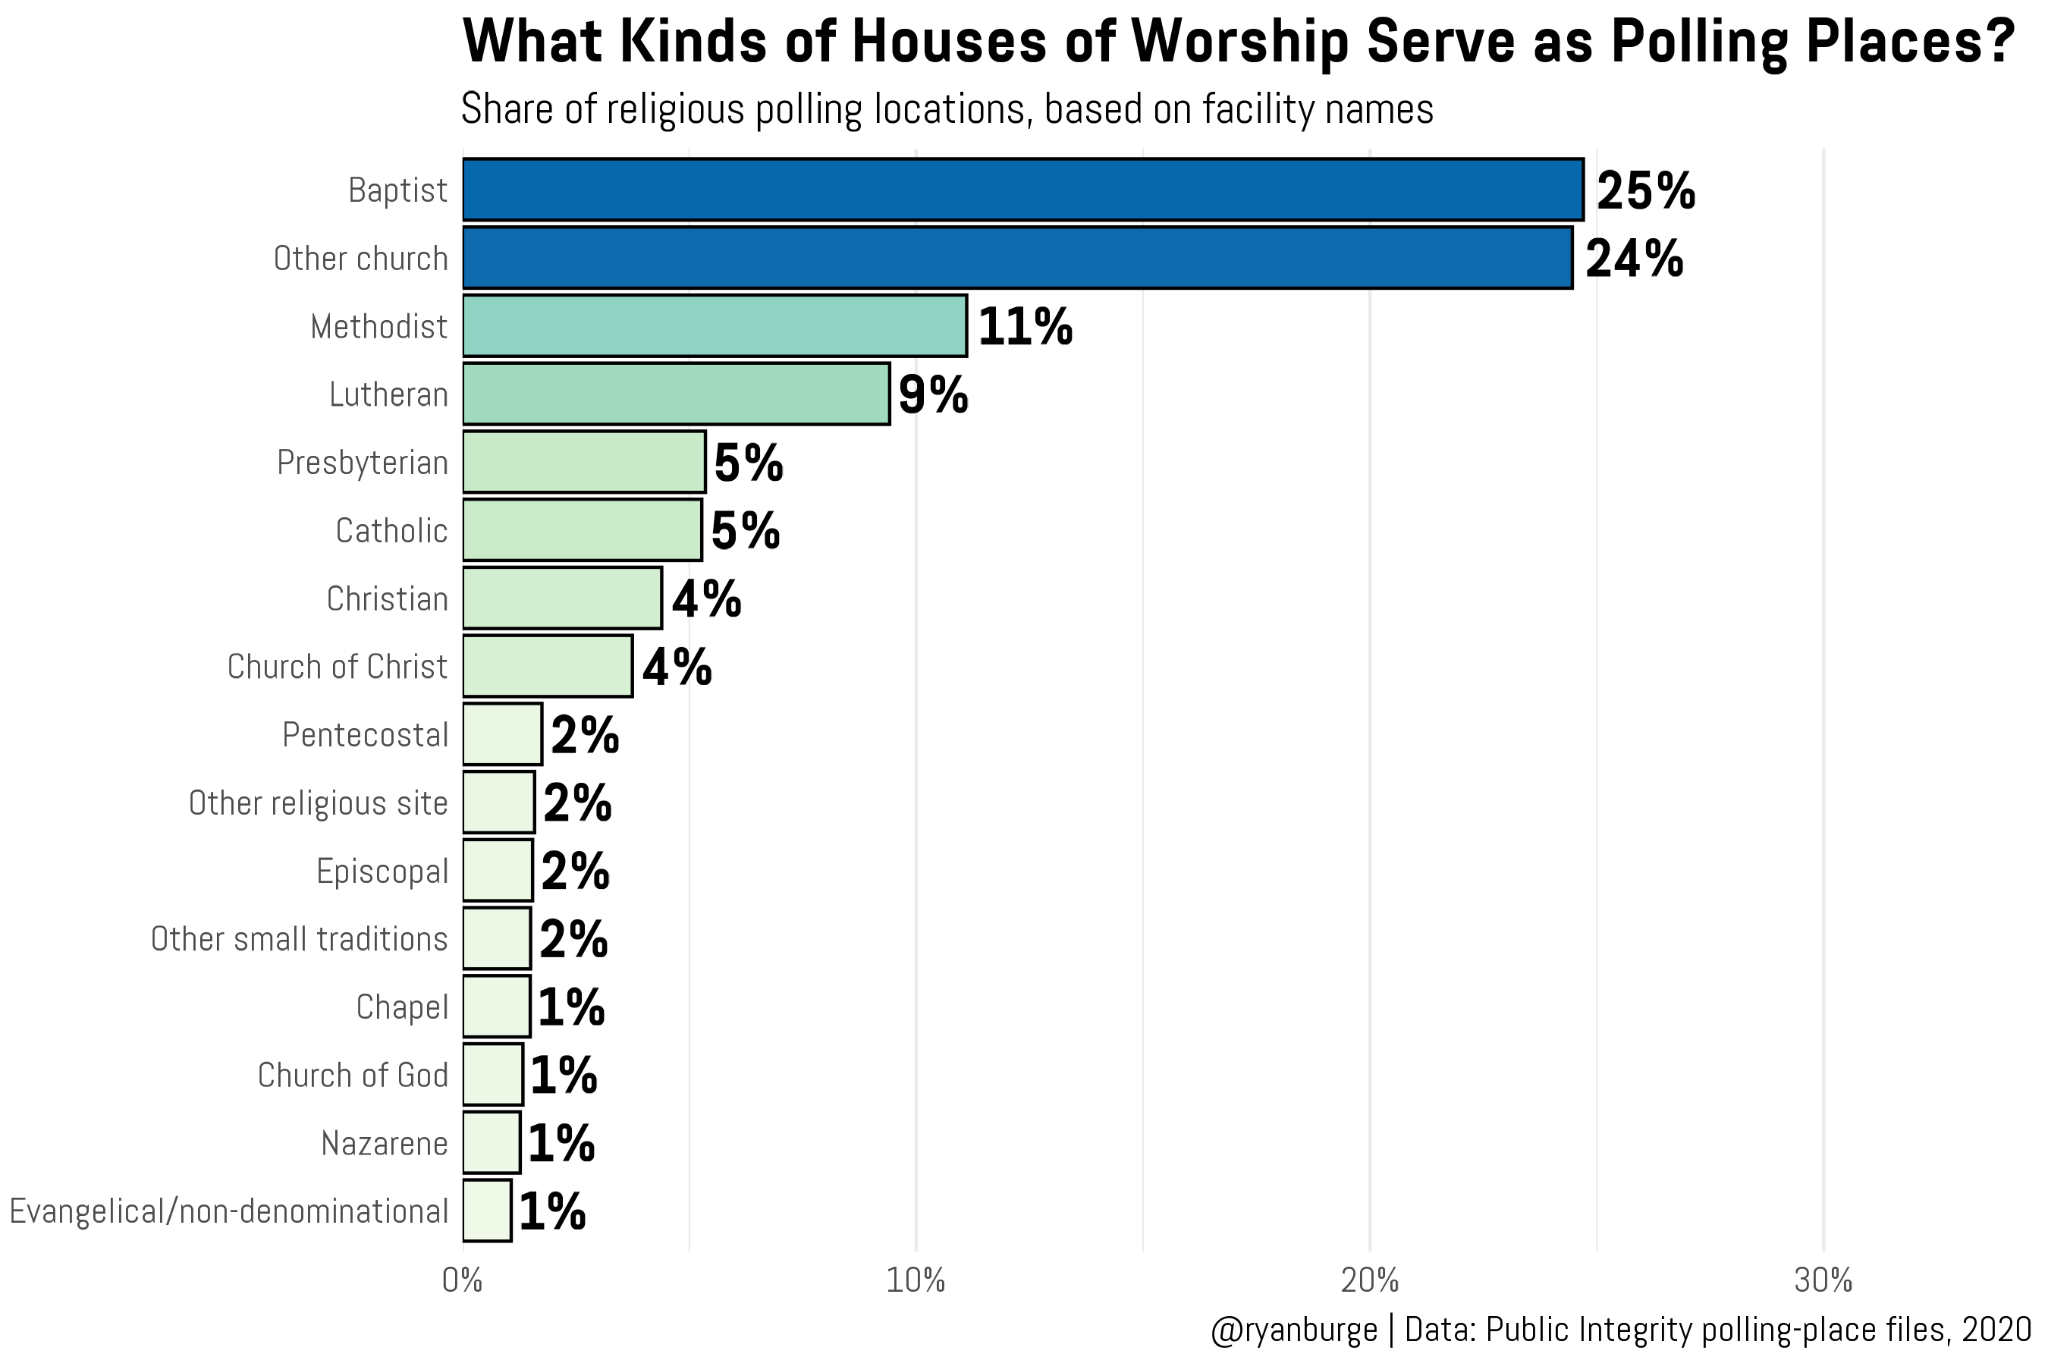
The one tradition that stands out immediately is Baptist. About a quarter of all polling places located in houses of worship were in Baptist churches, compared with just 11% in Methodist churches.
I went back to the 2020 Religion Census to see whether that pattern simply reflected the overall size of these traditions. My best estimate is that Baptist congregations outnumber Methodist congregations by roughly 3 to 2. In other words, for every two Methodist churches in the United States, there are about three Baptist churches. That larger congregational footprint helps explain why Baptist churches appear so frequently as polling locations.
Every other group was down in the single digits. Just 9% of polling places were in Lutheran churches and it was only 5% for Presbyterians. The one that I had a really hard time parsing was the Catholic calculation. Most Catholic churches don’t include the word “Catholic” in their official name. So I messed around with “Saint” and “St.” and such. But the problem there is that some non-Catholic churches use Saint names, as well. So I don’t feel as confident about that estimate compared to the others.
And don’t get me started on the non-denominational problem. You see that 24% in “other church” up top there? That’s places like “The Journey” or “Community Church.” Take theology out of the equation – I’m not a fan of non-denominationalism just because it makes classification like this so much harder.
But I know what all of you die-hards really want. You want an interactive county level map of all 35 states so you can mouse over to figure out what percentage of polling places in your locale are in a house of worship. Of course, I can’t disappoint on that front.
I do think that this is a better way of visualizing than just the state level map. I mean, the state of Texas is just fascinating. A lot of darker counties in the eastern part of the state but as you start to move out to the oilfields of West Texas, it just gets a whole lot lighter and almost blends into New Mexico completely.
Looking over that county-level map did trigger something in my mind, though. I was mousing around my home state of Illinois. In Cook County (that’s Chicago), only about 10% of polling places were in houses of worship. But then you go down to Coles County—that’s where EIU is located—and it’s 44% of polling places in churches. You can probably see where this is headed:
Are you more likely to find a polling location in a house of worship in a densely packed urban county or a really sparsely populated rural part of the United States?
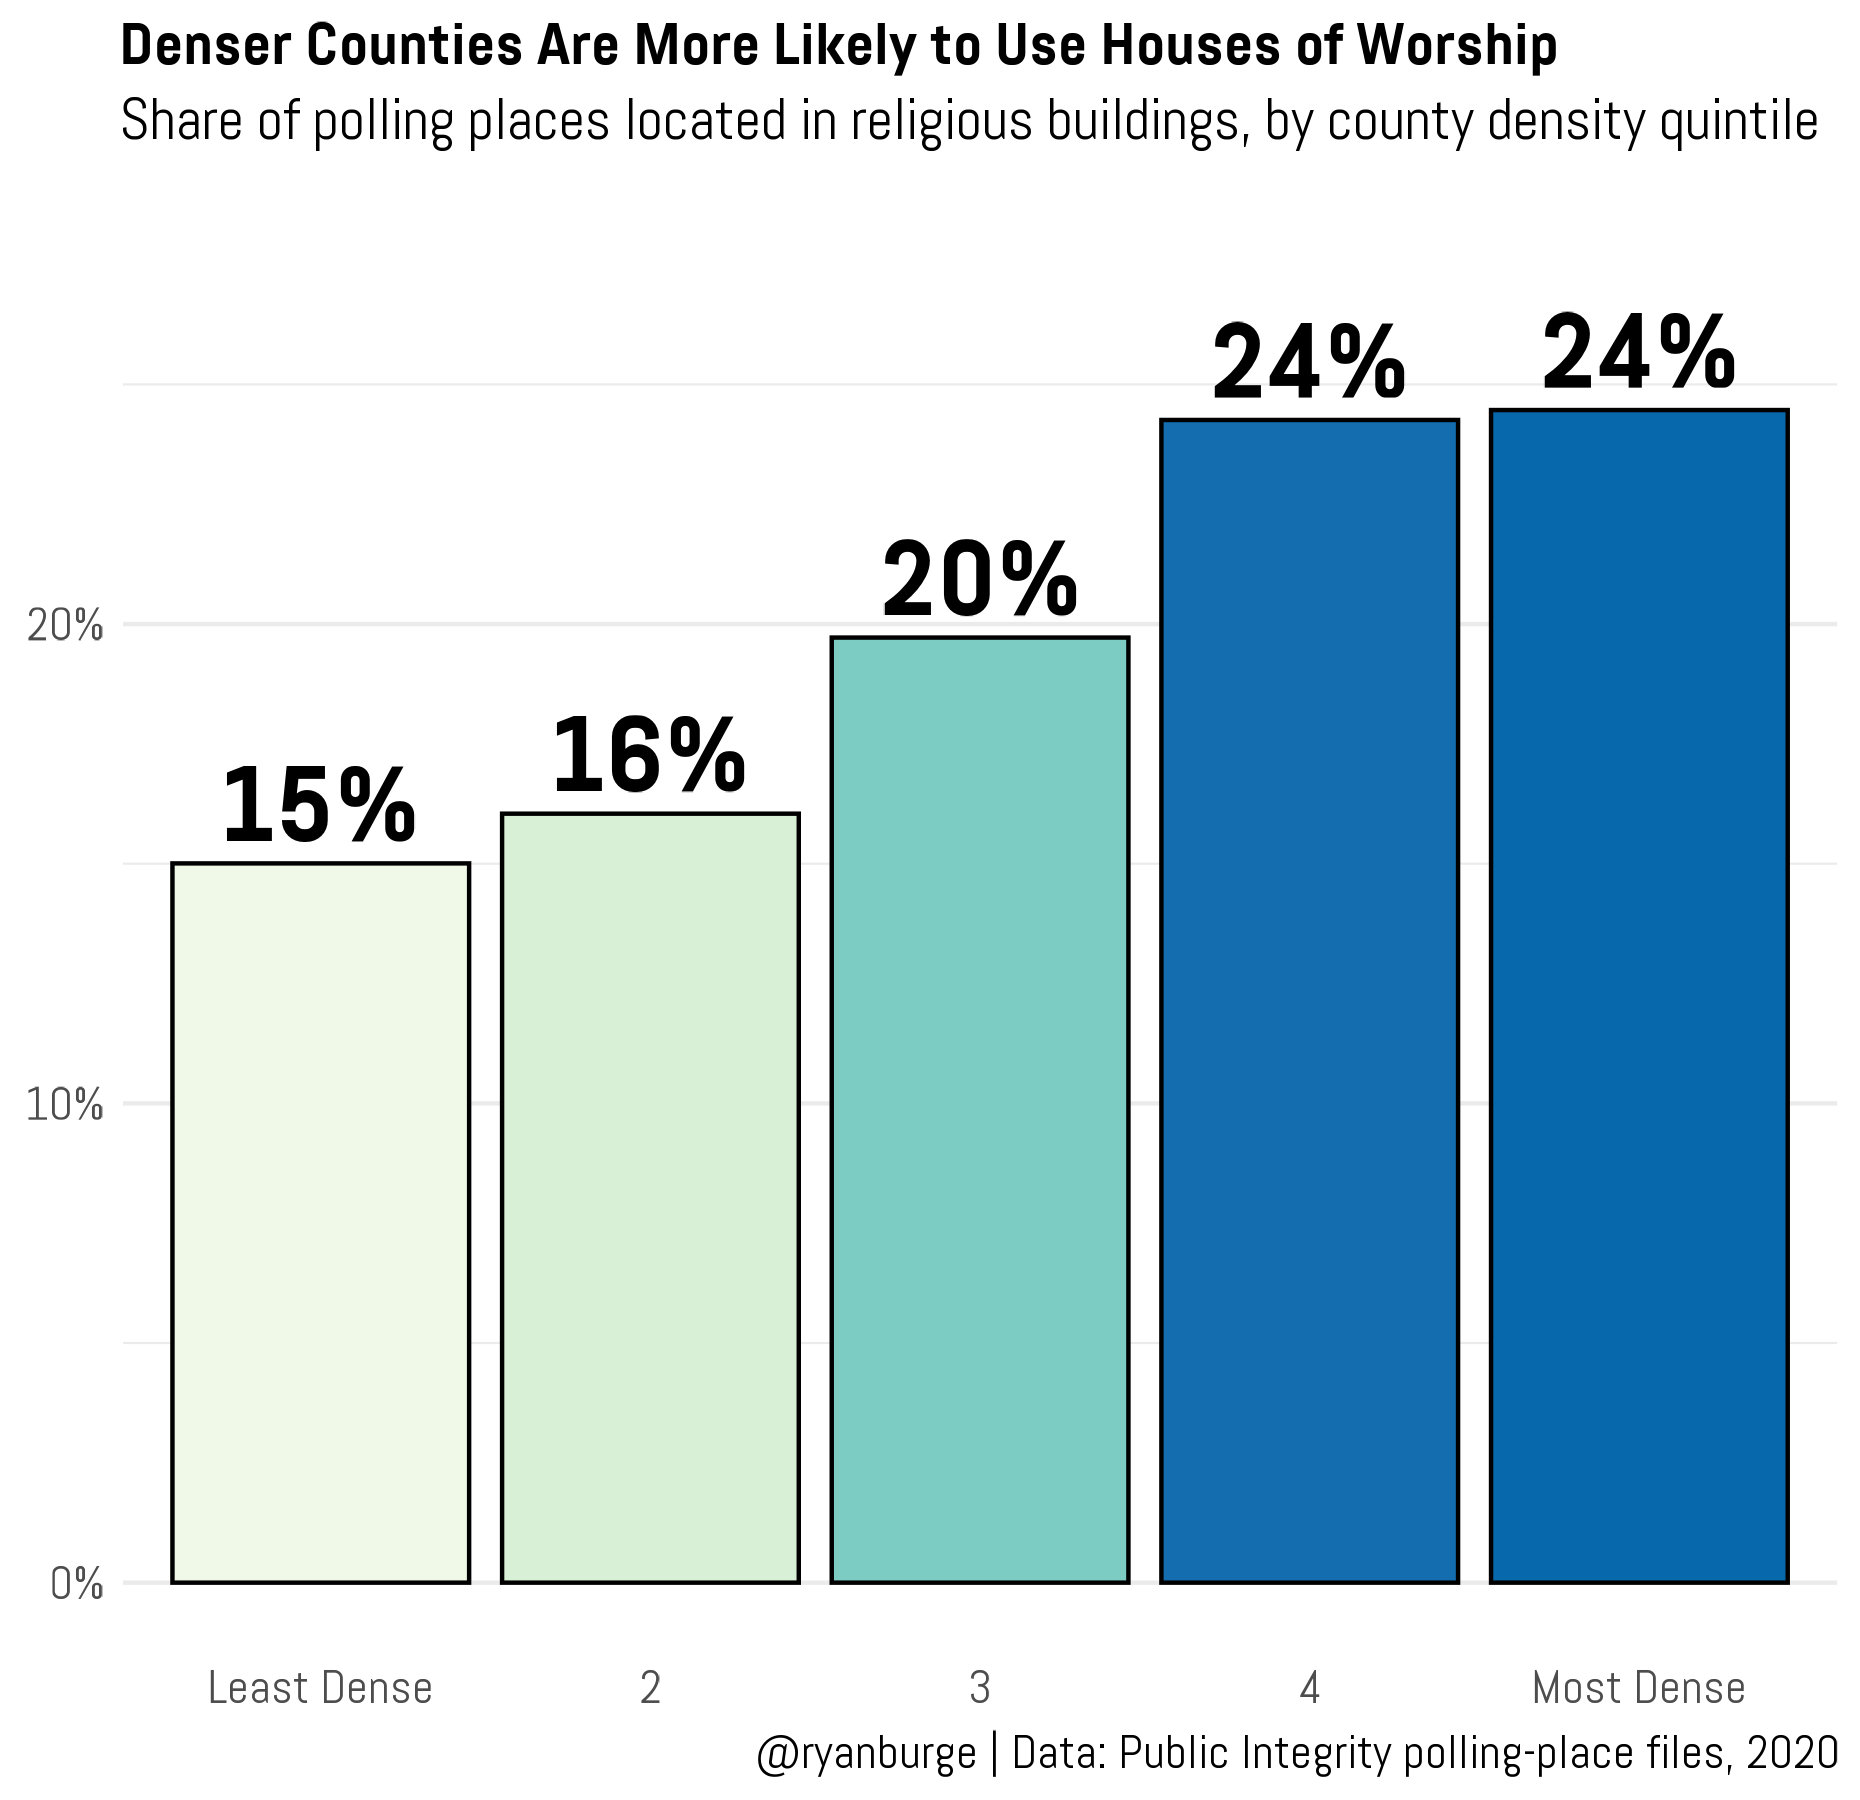
This is why doing data analysis is so much fun – I can prove myself wrong with actual evidence. I was convinced that rural America was way more likely to have polling places in churches than a place like Chicago or Indianapolis. Yeah, that’s not even close to true. In fact, it’s the very opposite of my assumption.
Among the least populated counties in the United States, just 15% of polling places are in houses of worship. As we move up the density scale, that share just continues to slowly climb. For the counties that score in the top 20% for density, almost a quarter of polling places are in houses of worship. I guess since I’ve never lived in an urban area, I had no idea about this. For those who read this and live in the big city, chime in for me: Where do you vote?
Okay, so back to that state variation thing. Oh my goodness, did I toil over this so much. I ran about a dozen regression models. I subbed in all kinds of variables. I was trying to figure out just how much state context mattered when predicting the share of polling places in churches. I finally landed on a model that just included: county population, number of congregations, and religious adherence rate.
So here’s what we’ve got: Imagine identical counties with the same population (median ≈26,600), same number of congregations (median = 57), and same religious adherence (median ≈49%). The only thing we change is the state they are located in. What is the predicted probability that the county has at least one polling place in a religious building?
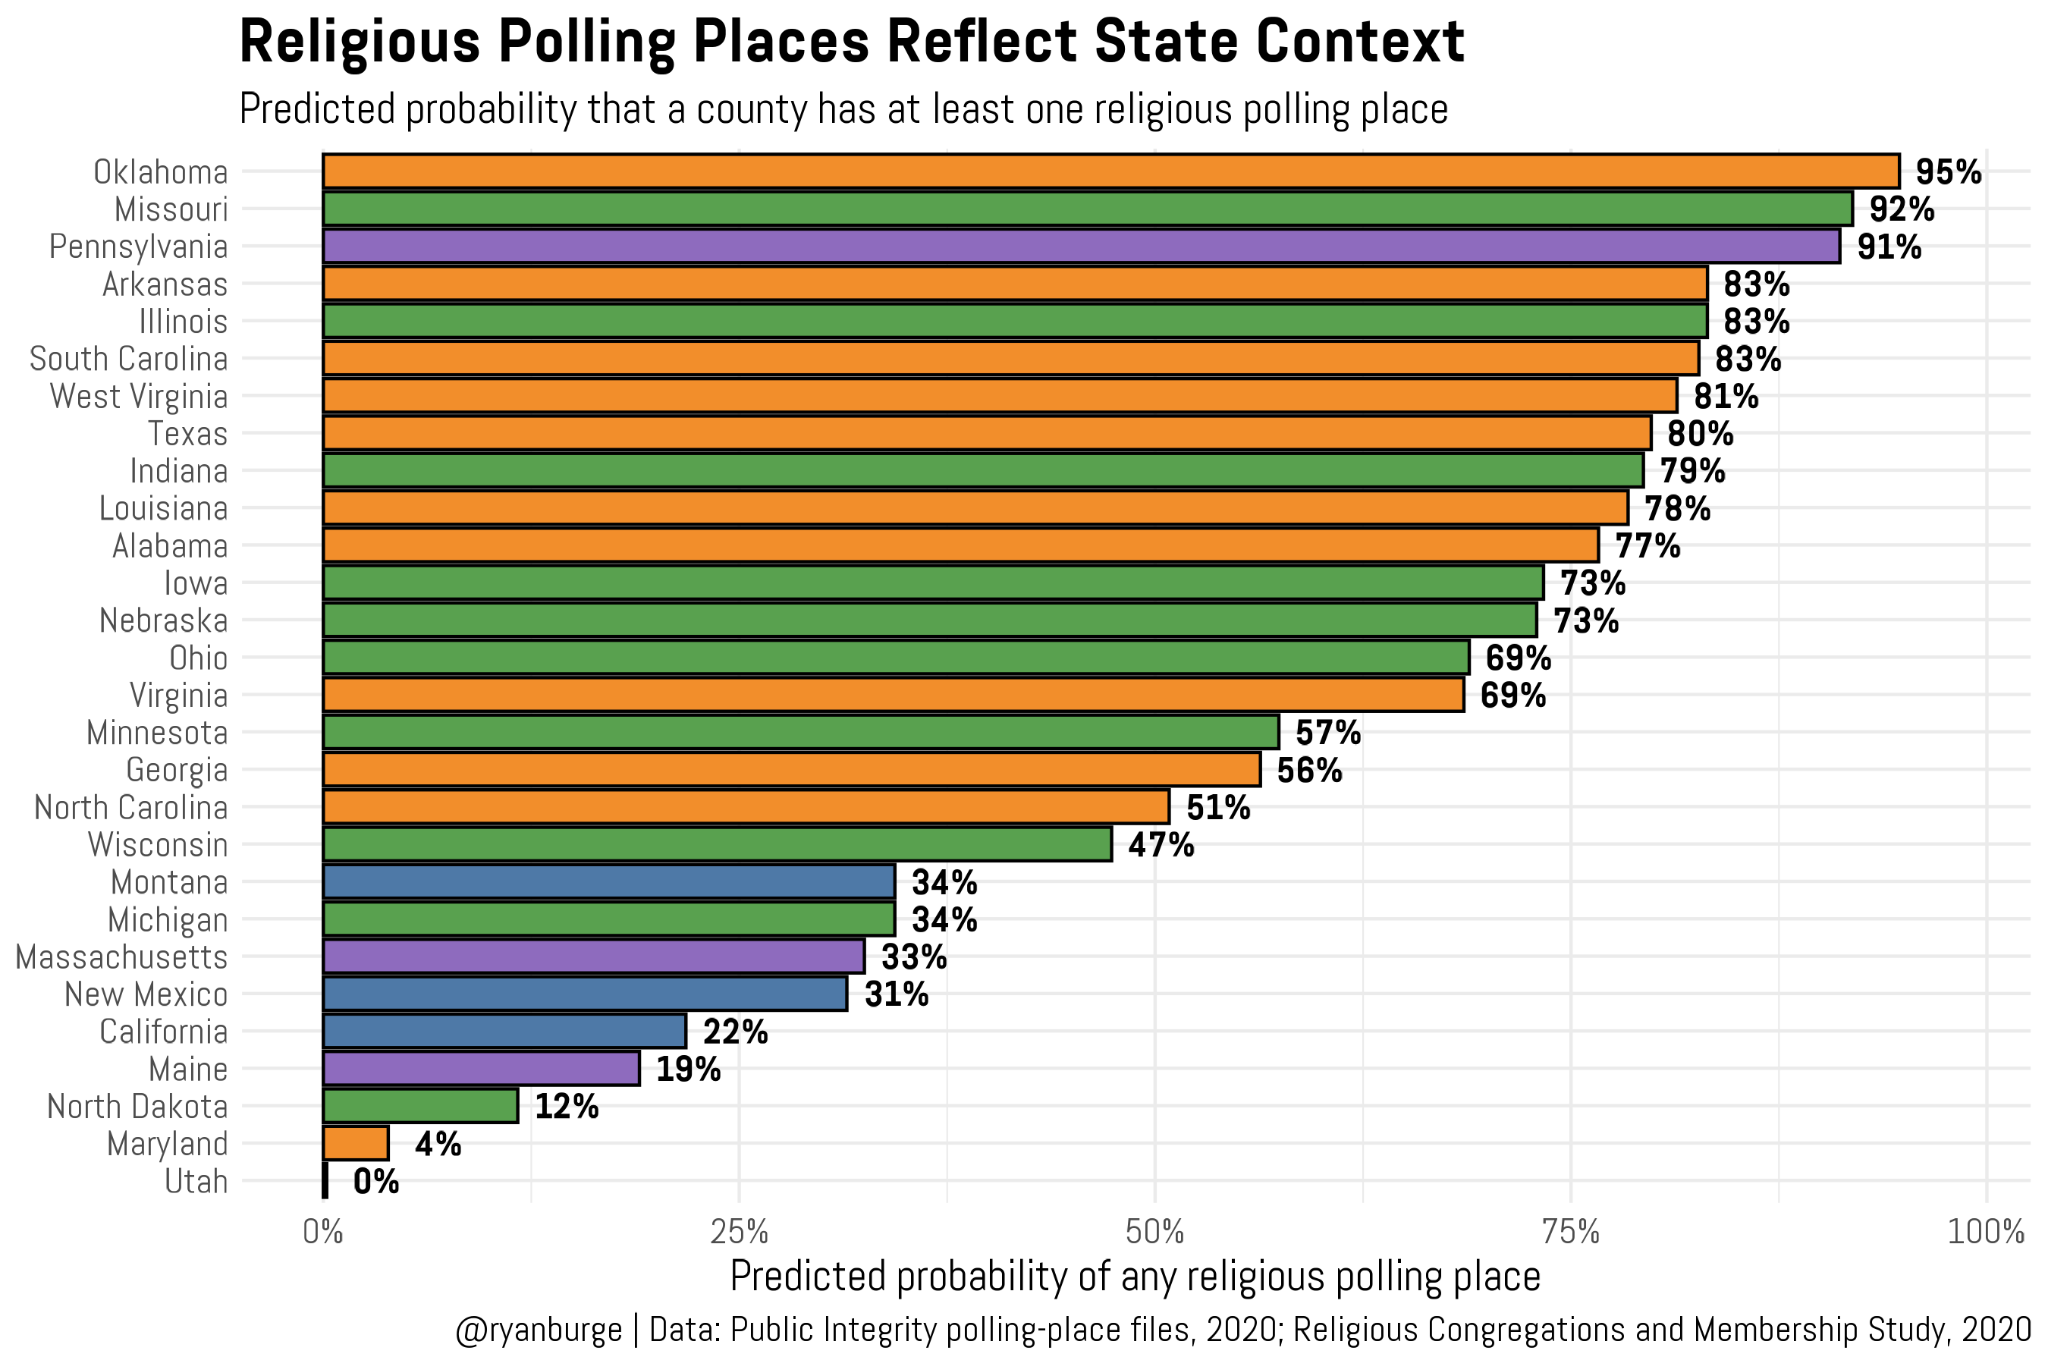
In Oklahoma, it’s a near certainty that this hypothetical county will have a polling place in a church (~95%). It’s also above 90% in both Missouri and Pennsylvania. Try to find any kind of connection between those three places. But there are a whole bunch of states where the predicted probability is still really high. In fact, in 25 of the 35 states I included, the probability was north of 50%.
Then, look at those states at the bottom. That random hypothetical county in Maryland only has a 4% chance that it’s got a voting location in a church. It’s just 12% in North Dakota. So I don’t know if we can even point to anything like a regional factor. It’s probably more about weird little historical quirks in certain places. Oklahoma was probably putting polling places in churches for decades, so when a new one was needed it was just assumed that the county clerk would call up churches and ask for permission to use their fellowship hall. That same culture didn’t exist in Maine.
And I do have to mention Utah. Why is it basically zero percent? Utah is an outlier because religious polling places are concentrated almost entirely in just two counties: Utah County and Salt Lake County. There are 29 counties in the state, but only two have any polling places in houses of worship. Salt Lake County alone accounts for 17 of the state’s 24 religious polling places. But the model is predicting the probability for a typical county with Utah’s characteristics — and the typical Utah county is one of the other 27 counties that have none.
The thing that surprised me most in this analysis is that houses of worship are not simply a reflection of how religious a place is. A state can have lots of churches, high religious adherence, and still rarely use those buildings as polling places. What matters is the relationship between religious institutions and the broader civic life of a community. In some places, the local church has long been understood as a gathering space for the entire community — not just a place for Sunday worship. In others, elections happen somewhere else.
Churches, synagogues, mosques, and temples have always played roles beyond their primary religious purpose. They host recovery meetings, food pantries, community events, and, yes, sometimes elections. The polling place data gives us another glimpse into how deeply religious organizations are woven into the everyday infrastructure of American communities.
Code for this post can be found here.
Ryan P. Burge is a professor of practice at the Danforth Center on Religion and Politics at Washington University.

I vote in a Baptist Church in Memphis, TN.
In Shelby County, TN 18 of the 26 early voting sites are churches, 5 are community centers, and then Arlington Safe Room, the Election Commission at the James Meredith Building downtown, and TN Shakespeare Company (Cordova) for the last three.
We live in rural Idaho. We vote at a non-denominational summer camp, using their dining hall. Beautiful setting. :)