The State of the Southern Baptist Convention in 2023
Some metrics are up. Some are down.

The Southern Baptist Convention is the largest Protestant denomination in the United States. (And, yes, I’ve read the recent discourse about how it’s not really a denomination. From a social science perspective - it’s a denomination). It’s been the largest for the last fifty years and has played an outsized role in every aspect of American culture over the last half century. So, when the numbers from the Convention are released by Lifeway Research, a lot of people pay attention - including myself.
The 2022 Data on the Southern Baptist Convention is Out

I grew up Southern Baptist. Went to church every Sunday as a kid - morning and night! We were committed. Baptized in an SBC church. Went to SBC church camps. Then, I left when I went to college and never really came back. My story is not at all unique. But that doesn’t mean I still don’t have a connection with the Southern Baptist Convention. I track th…
Let me just start by saying that this year’s report is undoubtedly a mixed bag of results for Southern Baptist leaders. There are some metrics that are undeniably bad, and there are others that point to some green shoots in the Convention. I try to be objective when looking at reports like this. My goal here is to show you a bit of both: good trend lines as well as more worrisome ones if you are a Southern Baptist.
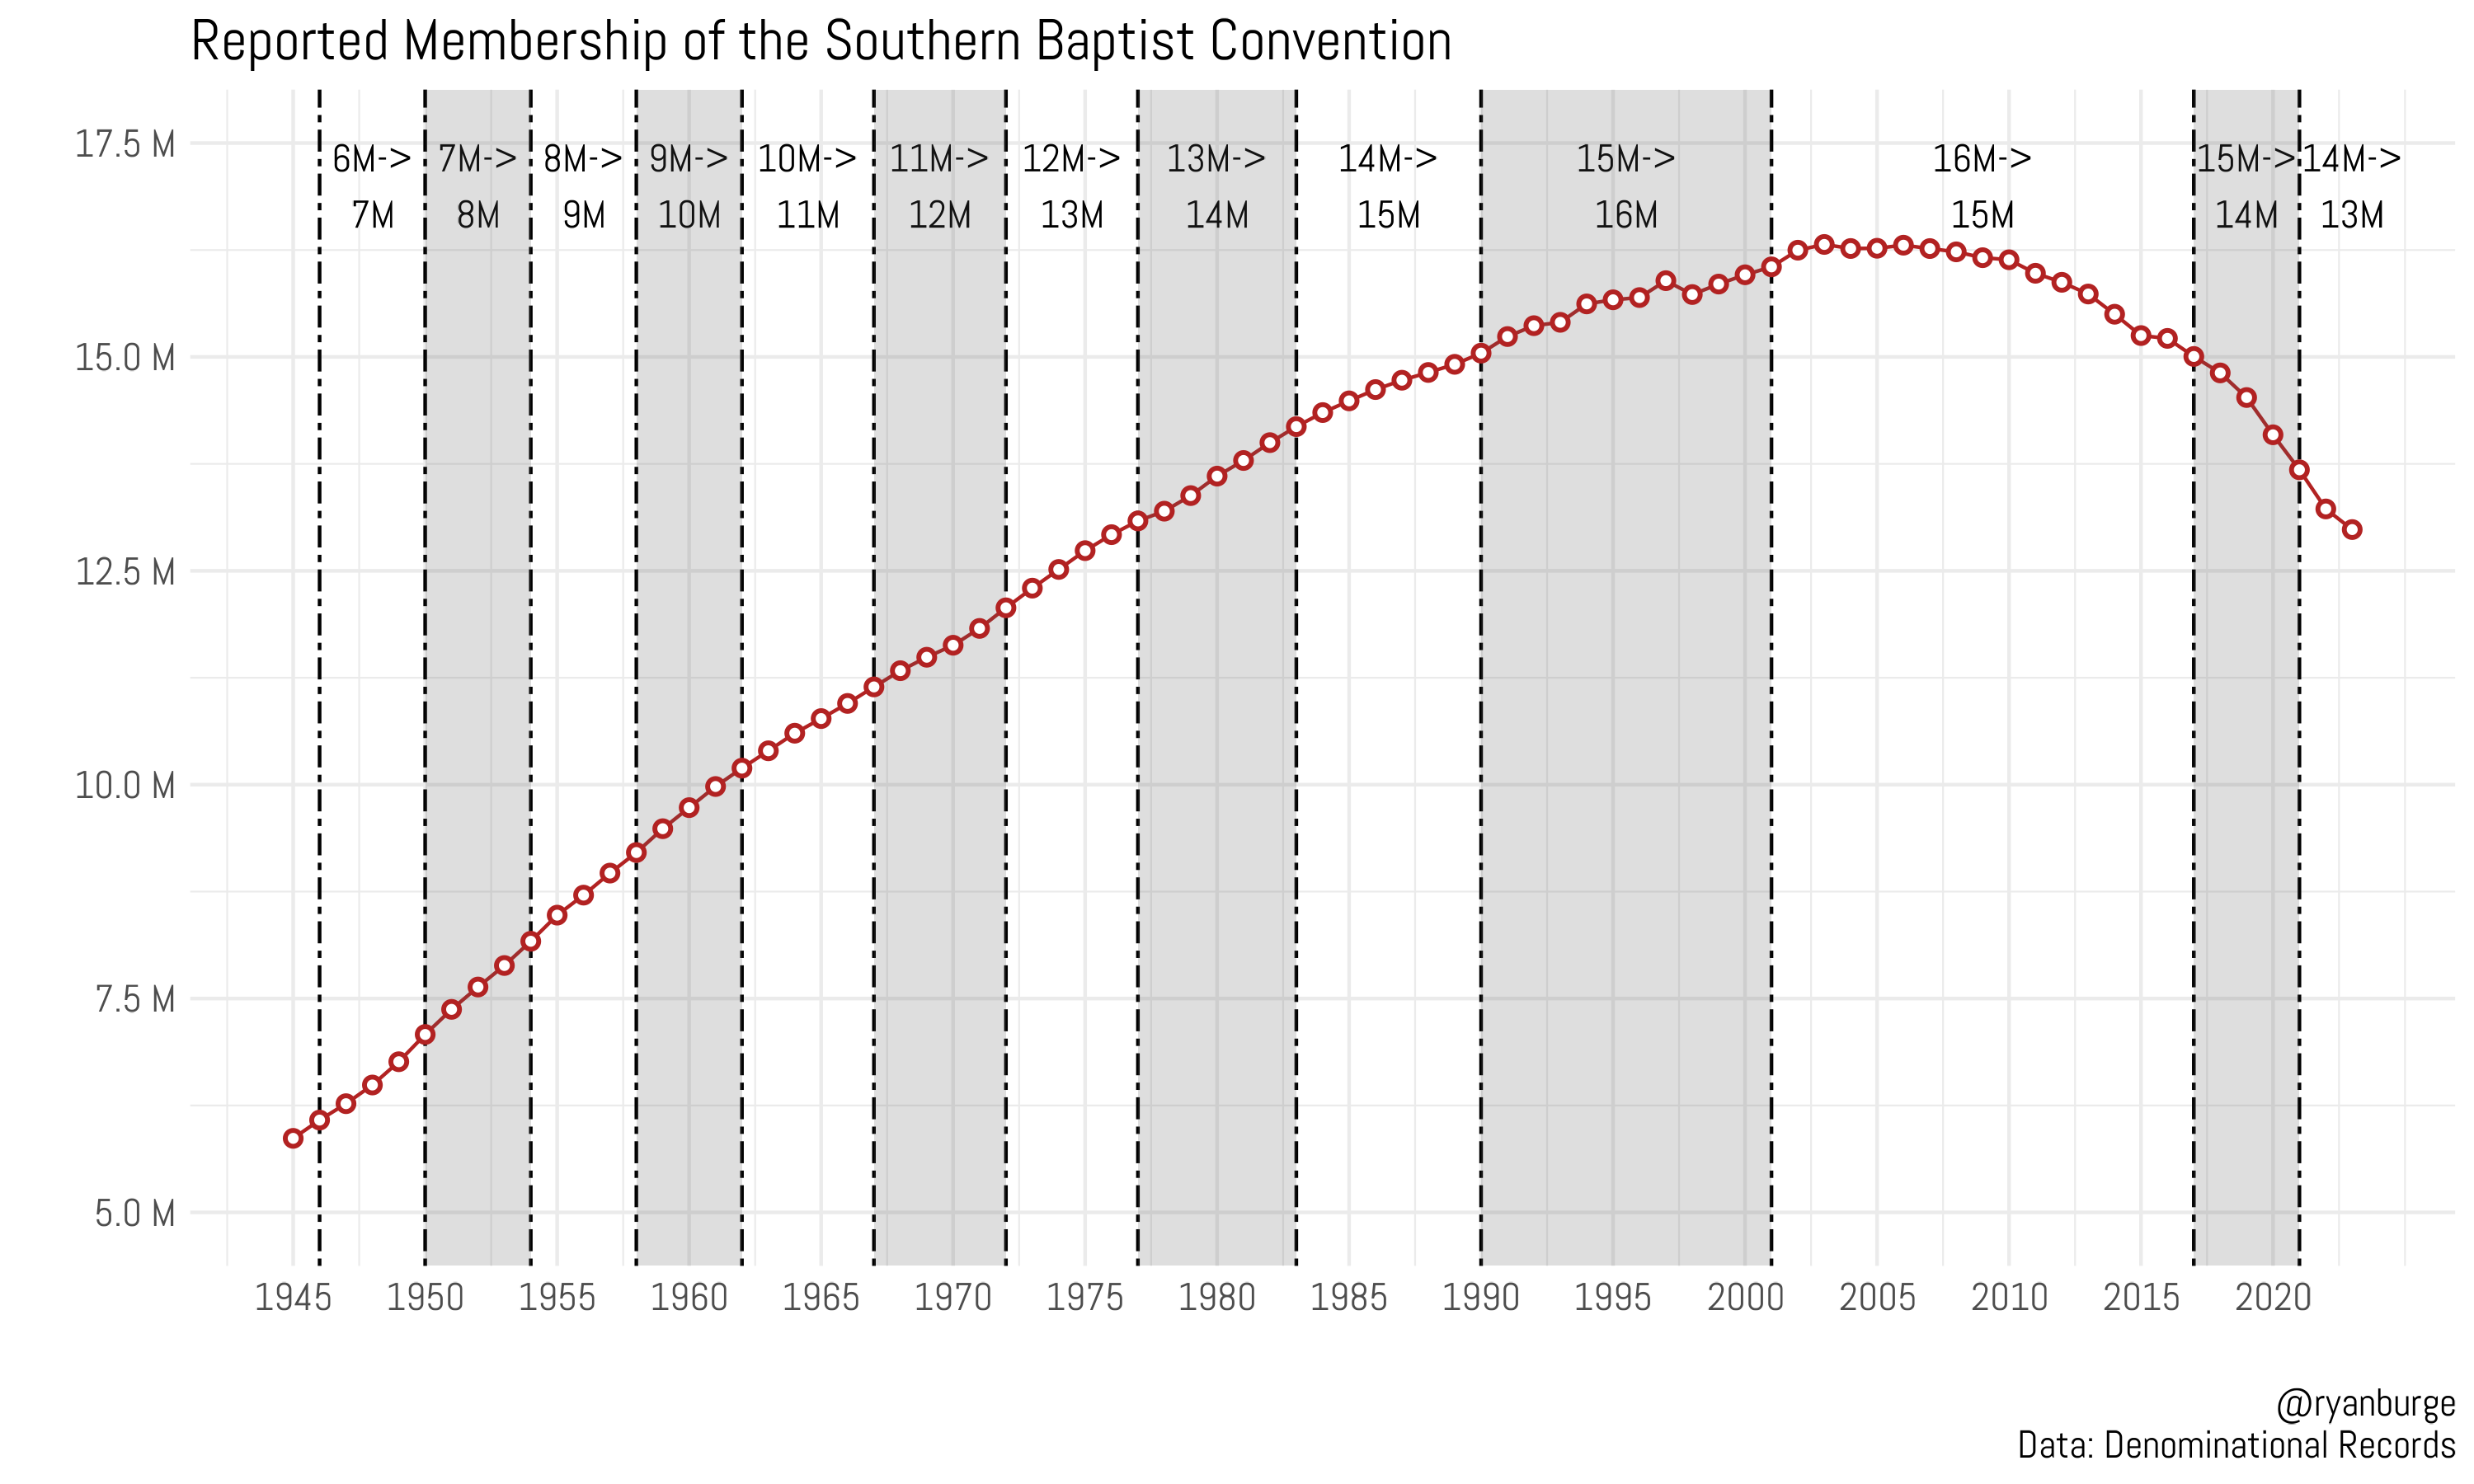
So, let’s just start by recreating the graph that appeared in that post from last year, while adding in the 2023 data. This trend line tracks the membership of the SBC since 1944 - when World War II began to wind down and the Baby Boom started in earnest.