

The Nones Are Everywhere Now
What Fifty Years of Data Tells Us About Religion and Place

I’ve lived in rural America for literally my entire life. I was born in a town of 8,000 people and lived there throughout all of my childhood. I attended college in a place that was even smaller than that. Maybe not in terms of population but we didn’t even have a Walmart in Greenville, so we had to drive about twenty minutes away to avoid paying twice as much for groceries at the local IGA. When I went to graduate school, I never actually lived in Carbondale. I lived about 15 minutes away, so I could be closer to the church I pastored and now I live in a town that has about 15,000 residents in a county that has seen zero population growth in seventy years.
Being around academics for my entire working career has taught me that most of them grew up in highly populated areas and want to live in close proximity to large population centers. I never really wanted to do any of that. I’m happy to live in a small town where housing is cheap, crime is low, and traffic is non-existent. But I also realize that my environment shapes my work. I understand American religion through the lens of a guy who has lived in the rural Midwest for four decades.
Urban White Evangelicals? Yes, they exist!

One thing that I always found astonishing about Tim Keller was where he founded his church, Redeemer Presbyterian. It was right in the middle of Manhattan. That’s not at all where I would expect a large, vibrant, and influential church to start.
Many of the reporters I speak to have grown up in the Beltway bubble for their entire lives, so their understanding of religion is based on their experience living in a highly cosmopolitan, rapidly growing part of the country. Neither perspective is completely accurate, of course. That’s why data is great, though. It helps us move beyond our own bubbles and see the full sweep of American religion.
What I wanted to focus this time is that issue I just spoke of: geography. I wanted to explore whether religiosity has faded more quickly in densely populated areas of the United States or if rural America has secularized faster than suburban areas.
One methodological note before diving in. To measure geography, I’m using a variable in the GSS called srcbelt, which classifies respondents based on where they live relative to metropolitan areas. It has six categories that I’ve collapsed into four for this analysis:
Large metro — respondents living in or around the 12 largest metropolitan areas in the country, things like New York, Chicago, and Los Angeles.
Smaller metro — respondents in other metropolitan statistical areas that didn’t make the top 12. Think mid-sized cities and their suburbs.
Small town — respondents living in areas adjacent to a metro area but not actually part of one. Small cities and towns on the urban fringe.
Rural — respondents living in areas with no meaningful connection to a metropolitan area. The most genuinely rural category in the data.
One caveat worth considering: This is a geographic classification based on where someone lives, not where they grew up or how they identify. Plenty of people in “Large metro” consider themselves small-town at heart, and vice versa.
So, let’s track attendance over time based on these four geographies.

Those red lines really jump off the screen, don’t they? That’s the share of each sample that reports that they never attend religious services. Back in the 1970s, those kinds of folks were basically non-existent. I mean, look at the share of people living in smaller cities and rural areas that were never attenders: it was about 10%. It was about five points higher among folks living in big cities, though. This didn’t last that long. Around 1990, the lines for the three largest geographies began to rise in a noticeable way. It took rural areas another decade to see a discernible increase in never attenders. But from that point, it was just straight upwards for each line. Now, never attenders are 30-35% of each graph.
The other thing that I wanted to highlight was the trend lines for “monthly” and “weekly” attendance. In the top two graphs, those lines lay right on top of each other. That’s not the case for people living in small towns and rural America. In those two places, weekly attendance was always noticeably higher than monthly attendance. Also, I must point out that the only geography where weekly attenders outnumber never attenders are in rural America. Although that may come to an end in the next 5-10 years.
Of course, attendance is just one part of the equation – I was even more intrigued by the results about religious tradition.
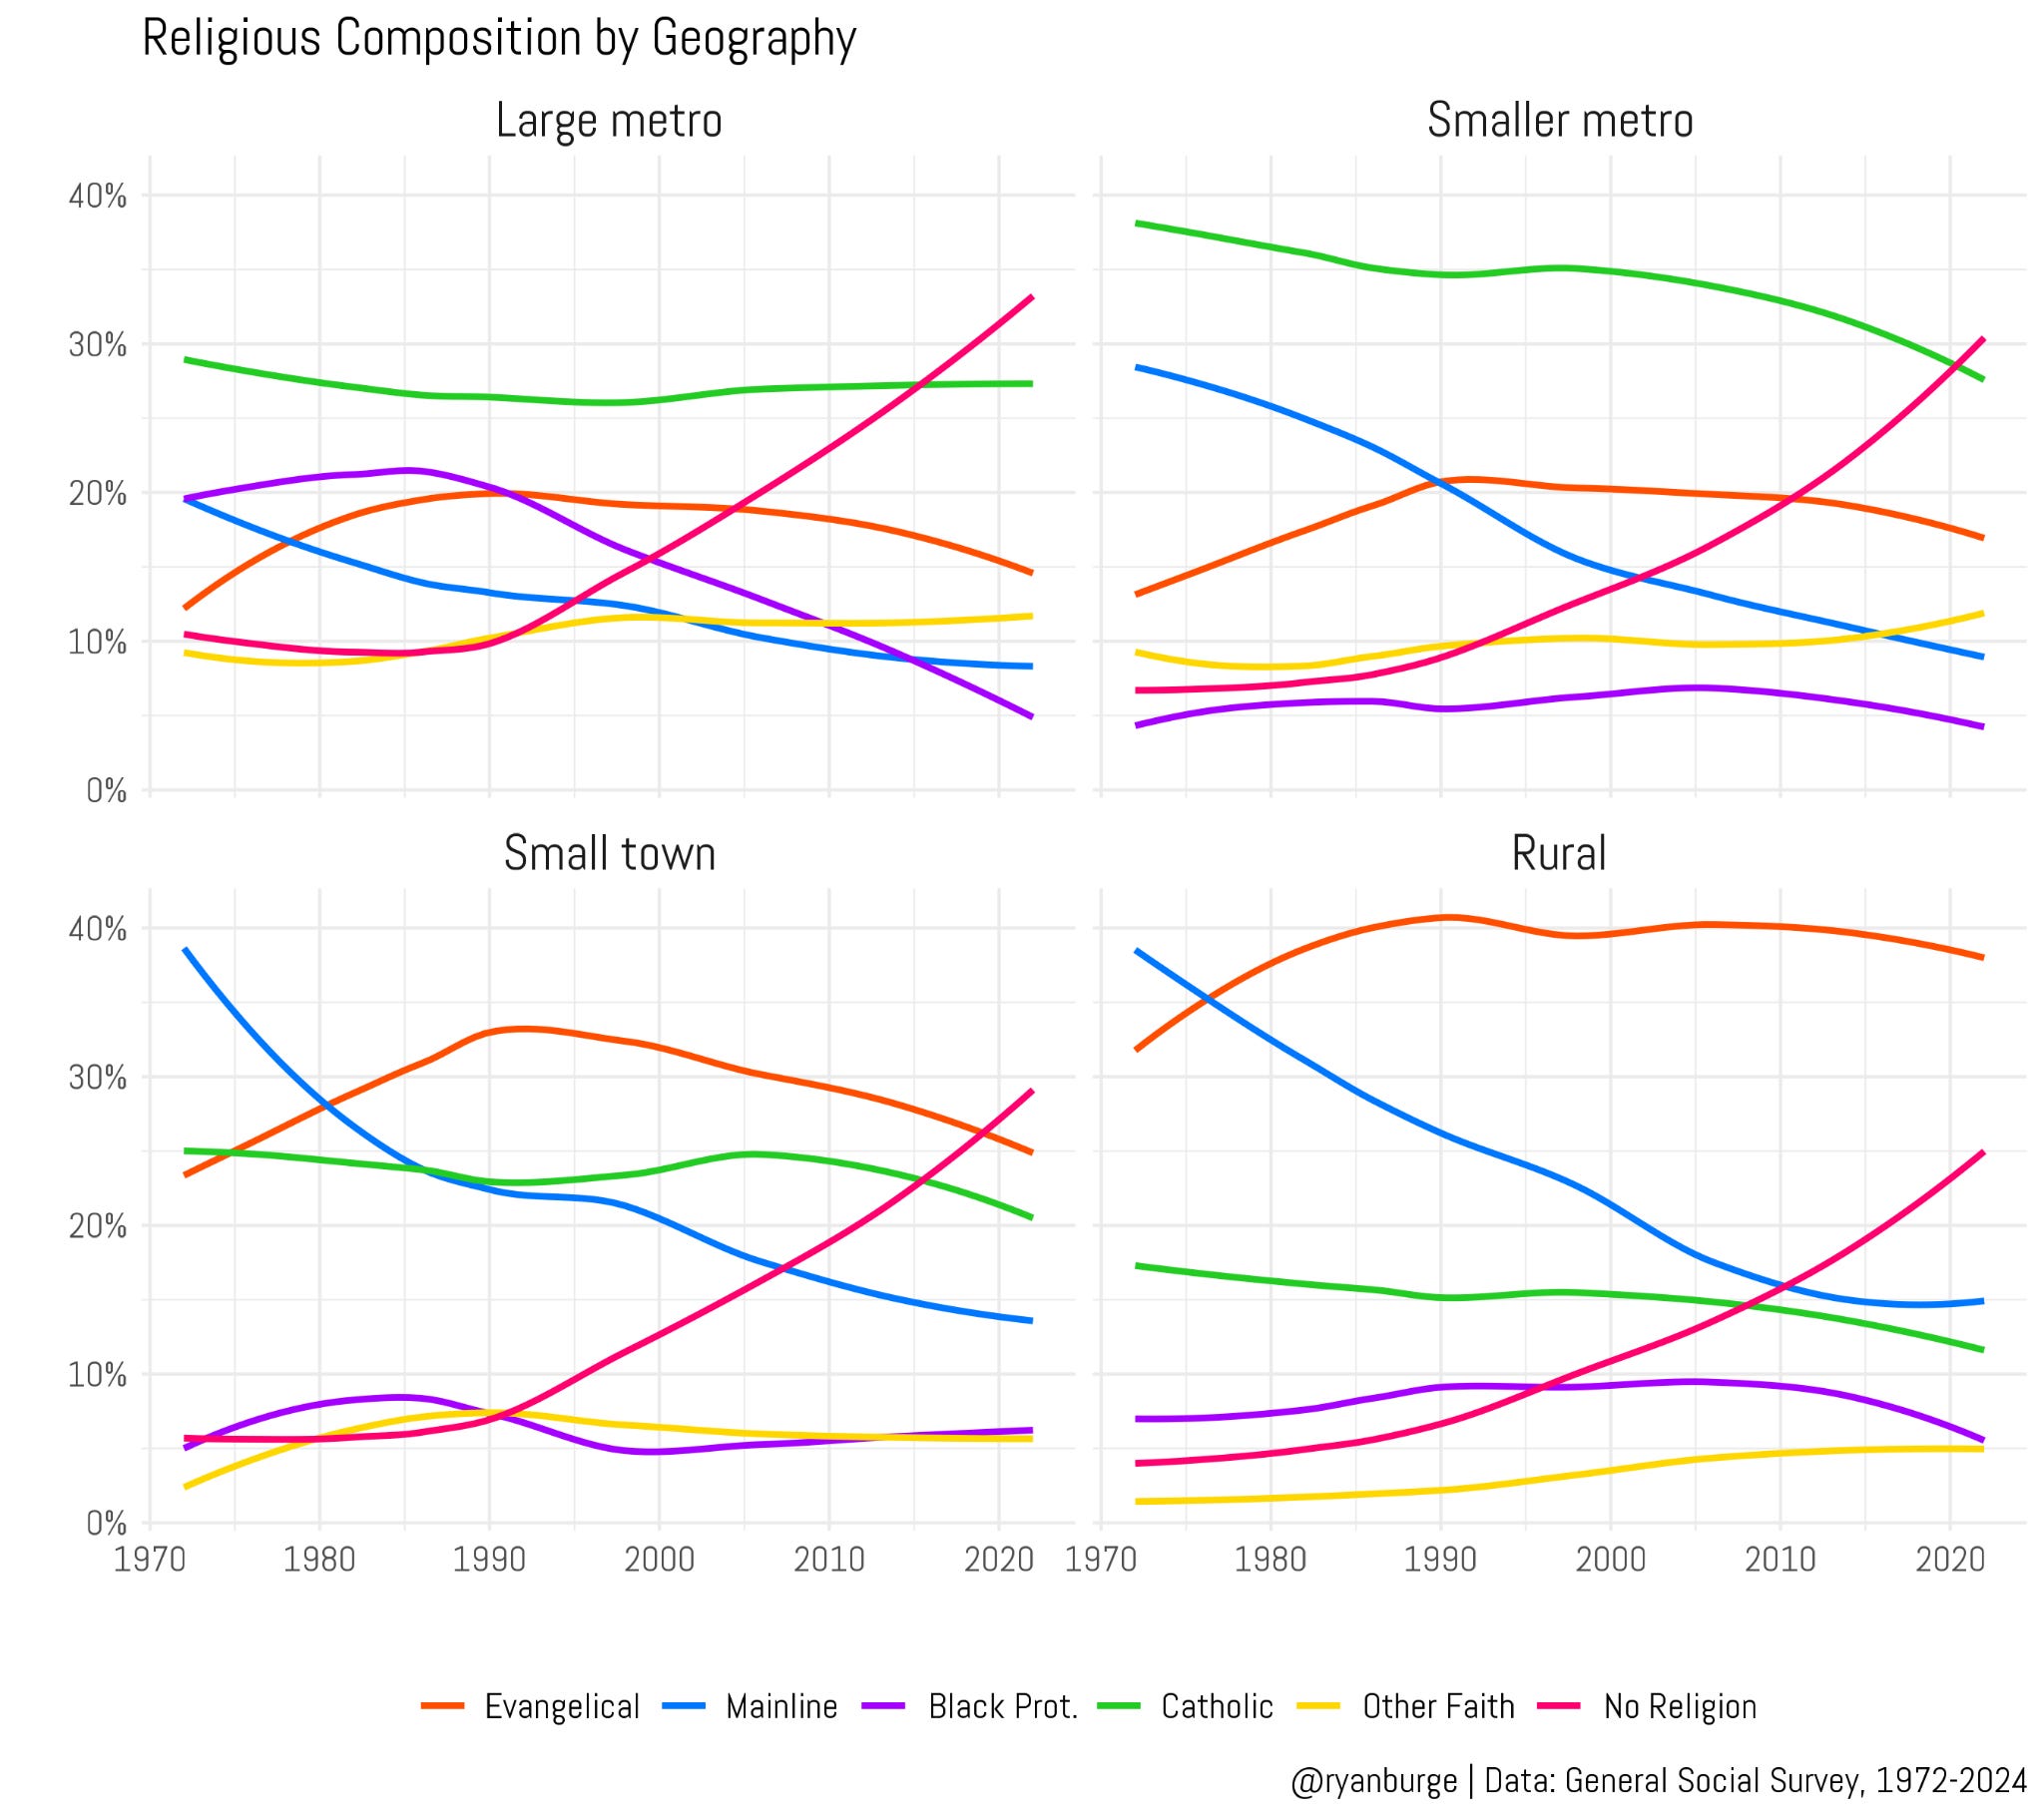
While the “never attenders” line jumped off the screen in the previous graph - the non-religious also exhibit a very similar pattern in this visualization. They were pretty low in every geography through the early 1990s, but then they just took off. In every graph but the “rural” one, the nones are now the largest share. Secularization is absolutely happening in densely populated places, but it’s also common in smaller towns, too. Even in rural America, the nones make up a quarter of the population.
The other huge shift is the largest Christian group when comparing the two graphs on the top to the two on the bottom. In large and small metros, Catholics really dominate. That’s especially true in the “smaller metro” category where they went from nearly 40% of the sample in the 1970s to 28% today. Less populated places just don’t have that many Catholics, in comparison.
Instead, the small town and rural graphs show a similar pattern. The mainline was the largest group back in the early 1970s, but that didn’t last that long. Within the next 8-10 years, evangelicalism experienced clear gains and a lot of that came at the expense of mainline Protestants. By the mid-1980s, evangelicals outnumbered the mainline and that divide only began to widen. I mean, the mainline was nearly 40% of each geography back in 1972 and then it was only 15% in the 2022 data.
To make that easier to digest, I just made a bar graph that visualizes the distribution of religious traditions in 1972 and 2022 for each of the four geographies.
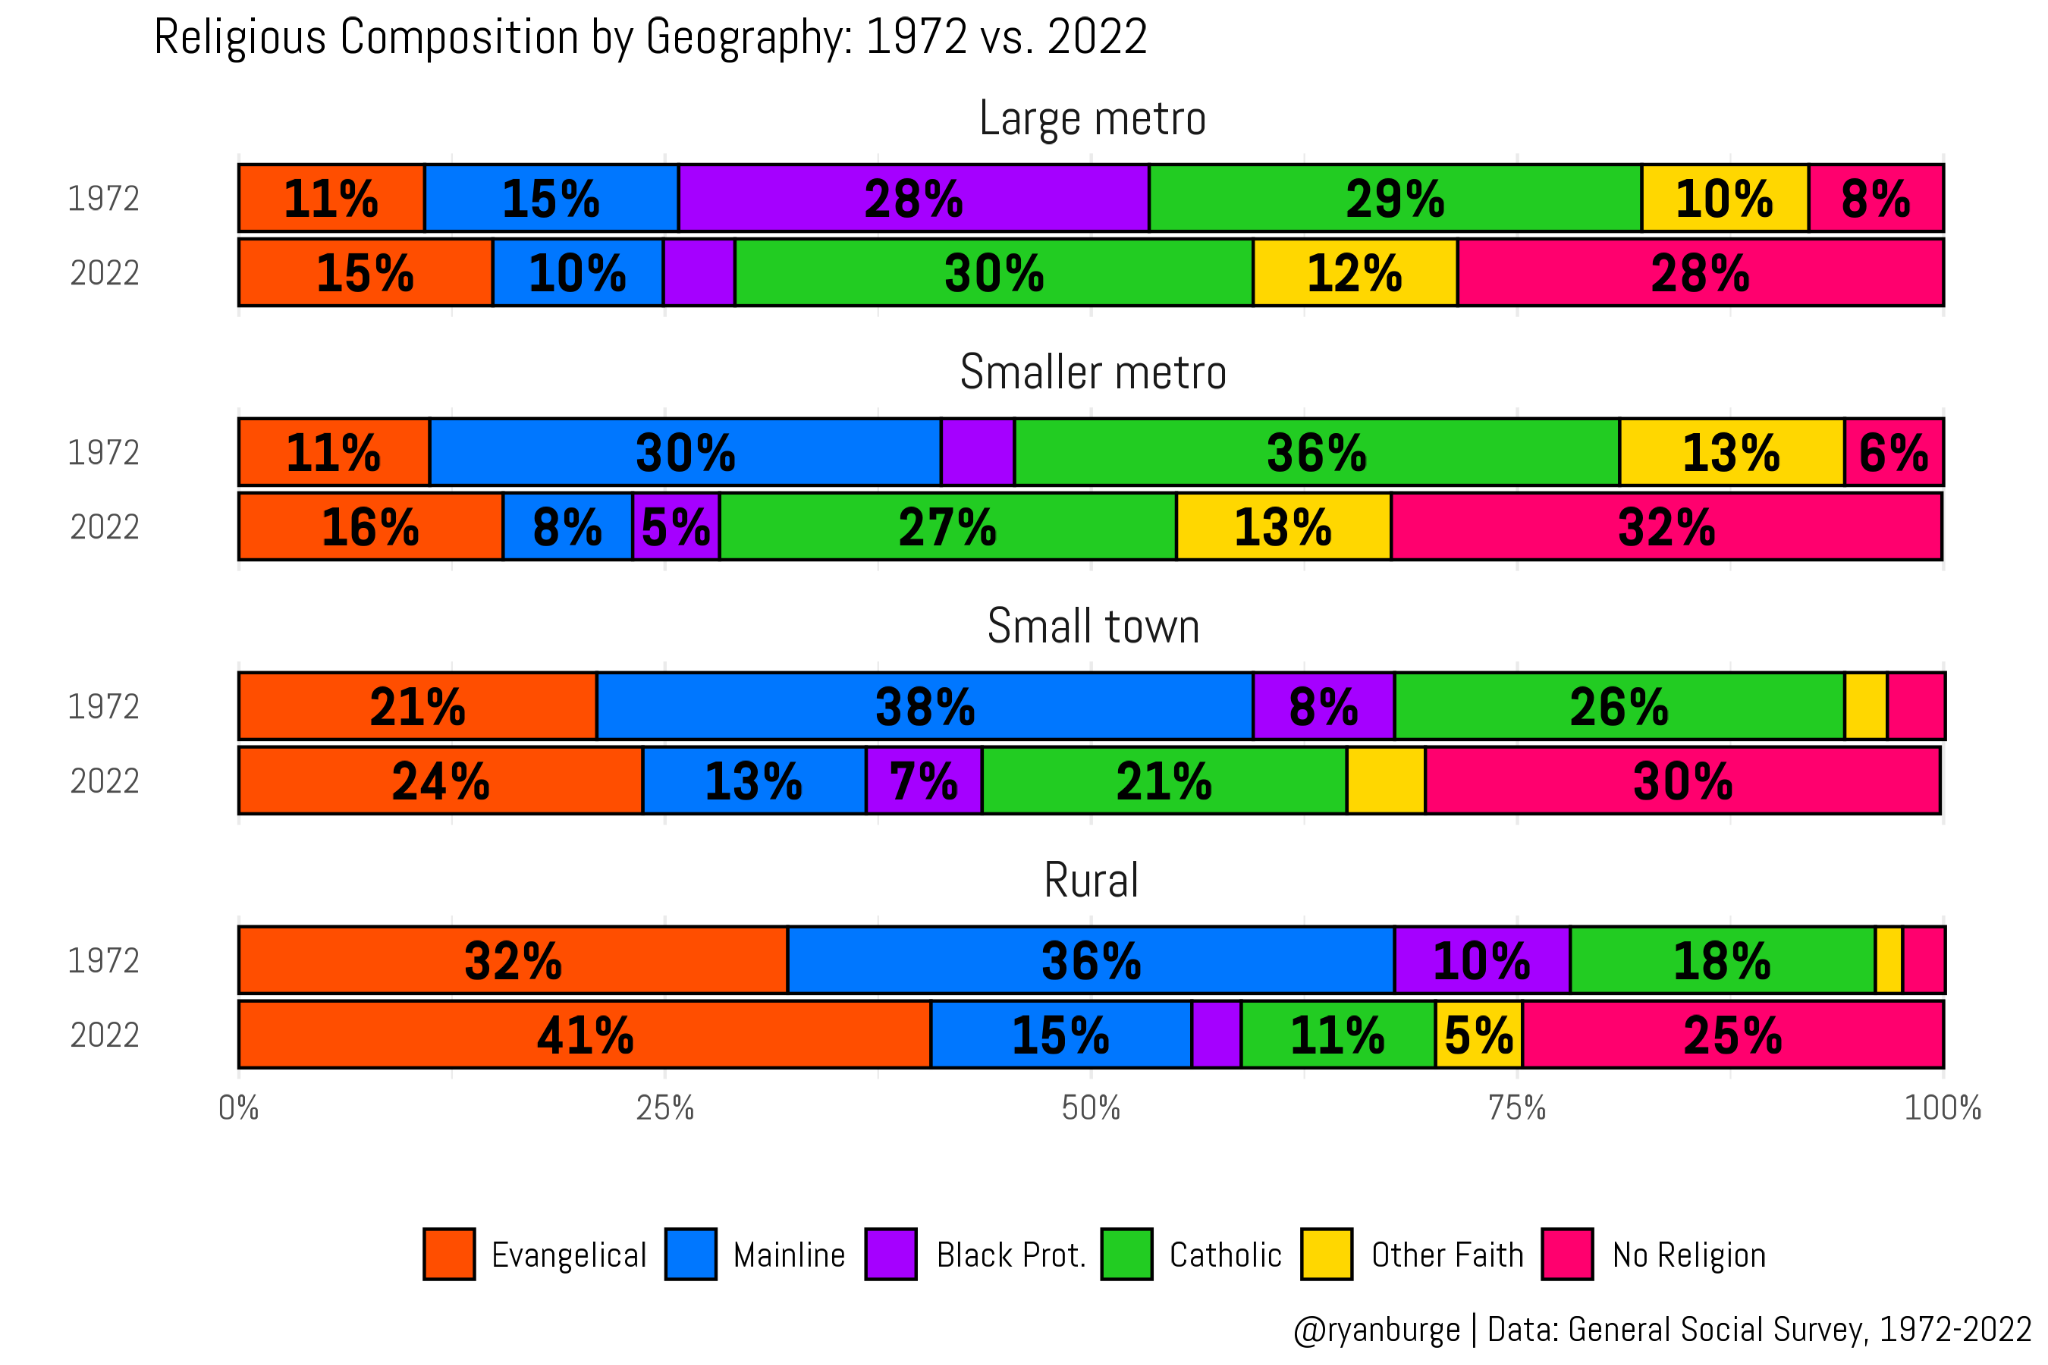
The trend lines help to give us a broad sense of how things are shifting but the bar graphs really sharpen our understanding of the size of these changes. For instance, you can see that evangelicals made modest gains in urban areas (up 4 points), but those were much larger in rural America - 9 points. It’s also readily apparent how much evangelicalism is a rural phenomenon - making up over 40% of the population. That’s seventeen points higher than any other geography.
The right side of the graph drives home the “rise of the nones” in pretty stark terms. They were in the single digits even in urban areas back in 1972. But now they are 28% of major cities. What’s even more notable is that cities aren’t as secular as those geographies in the middle of range. Among people living in smaller metros, almost a third are non-religious. This is suburban America, really.
One other thing that I have to point out is just how much the Black Church has collapsed in major cities. Back in 1972, Black Protestants were a larger share of urban areas than mainline and evangelical Protestants combined and they were basically the same size as Catholics. Now, just 5% of urban areas are Black Protestants, while those other Christian groups have held steady. There’s a doctoral dissertation to be written about this massive shift.
Another angle that is worth exploration is looking at how younger residents of these geographies have different religious compositions compared to Baby Boomers.
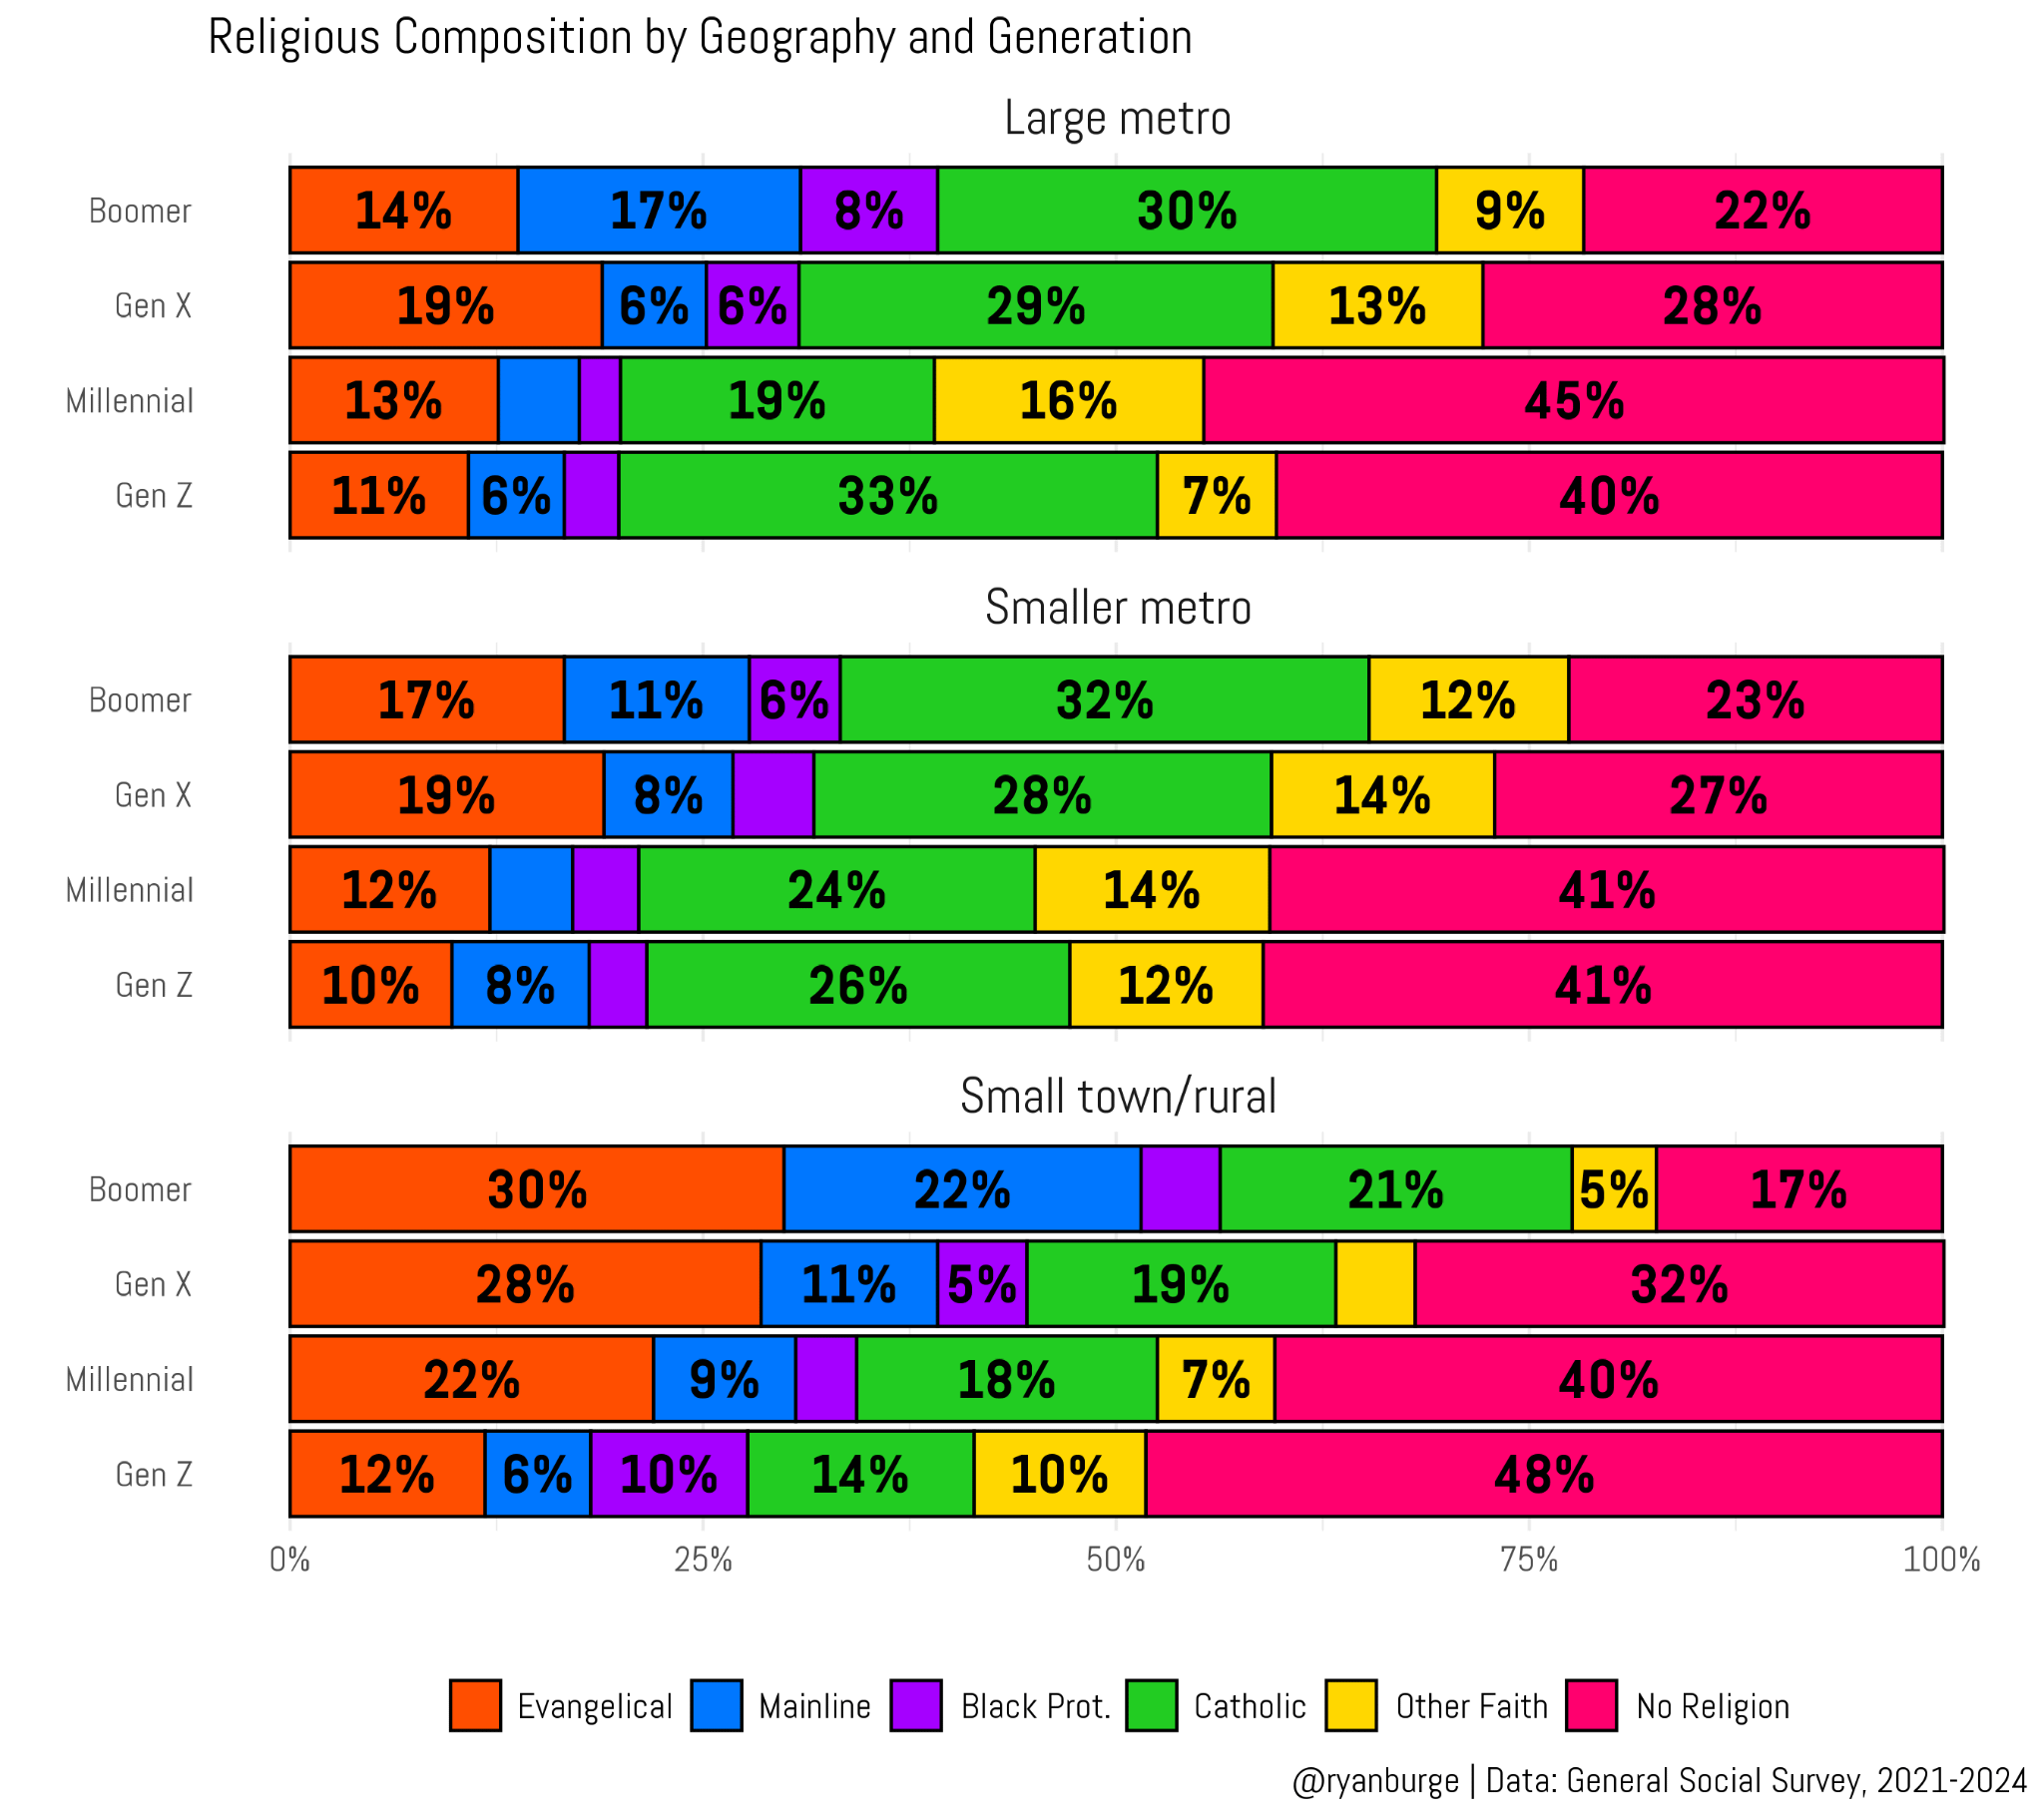
The big thing that I take away from this is that the nones are rising among younger generations in basically the same way whether we are talking about big cities or small towns in the United States. But, what really jumps out to me is just how non-religious young adults are in rural America. Among Millennials living in small towns, 40% are non-religious and 48% of Gen Z claim no affiliation. Those rates are just as high (if not higher) than younger adults living in urban areas. The rise of the young, rural none is not something that I’ve ever seen written about.
At the same time, you can clearly see how evangelicalism has lost ground with each successive generation living in rural areas. Among Boomers in these geographies, 30% are evangelical and 28% of Gen X. For Millennials it drops down to 22% and for Gen Z it’s even lower: 12%. Remember that evangelicals have dominated these kinds of places for decades now, but according to this data that may not be true going forward. If so, that could have a tremendous impact on the culture and politics of rural America.
Speaking of politics, I had to trace the partisanship of the three largest Christian groups over each of these geographies.
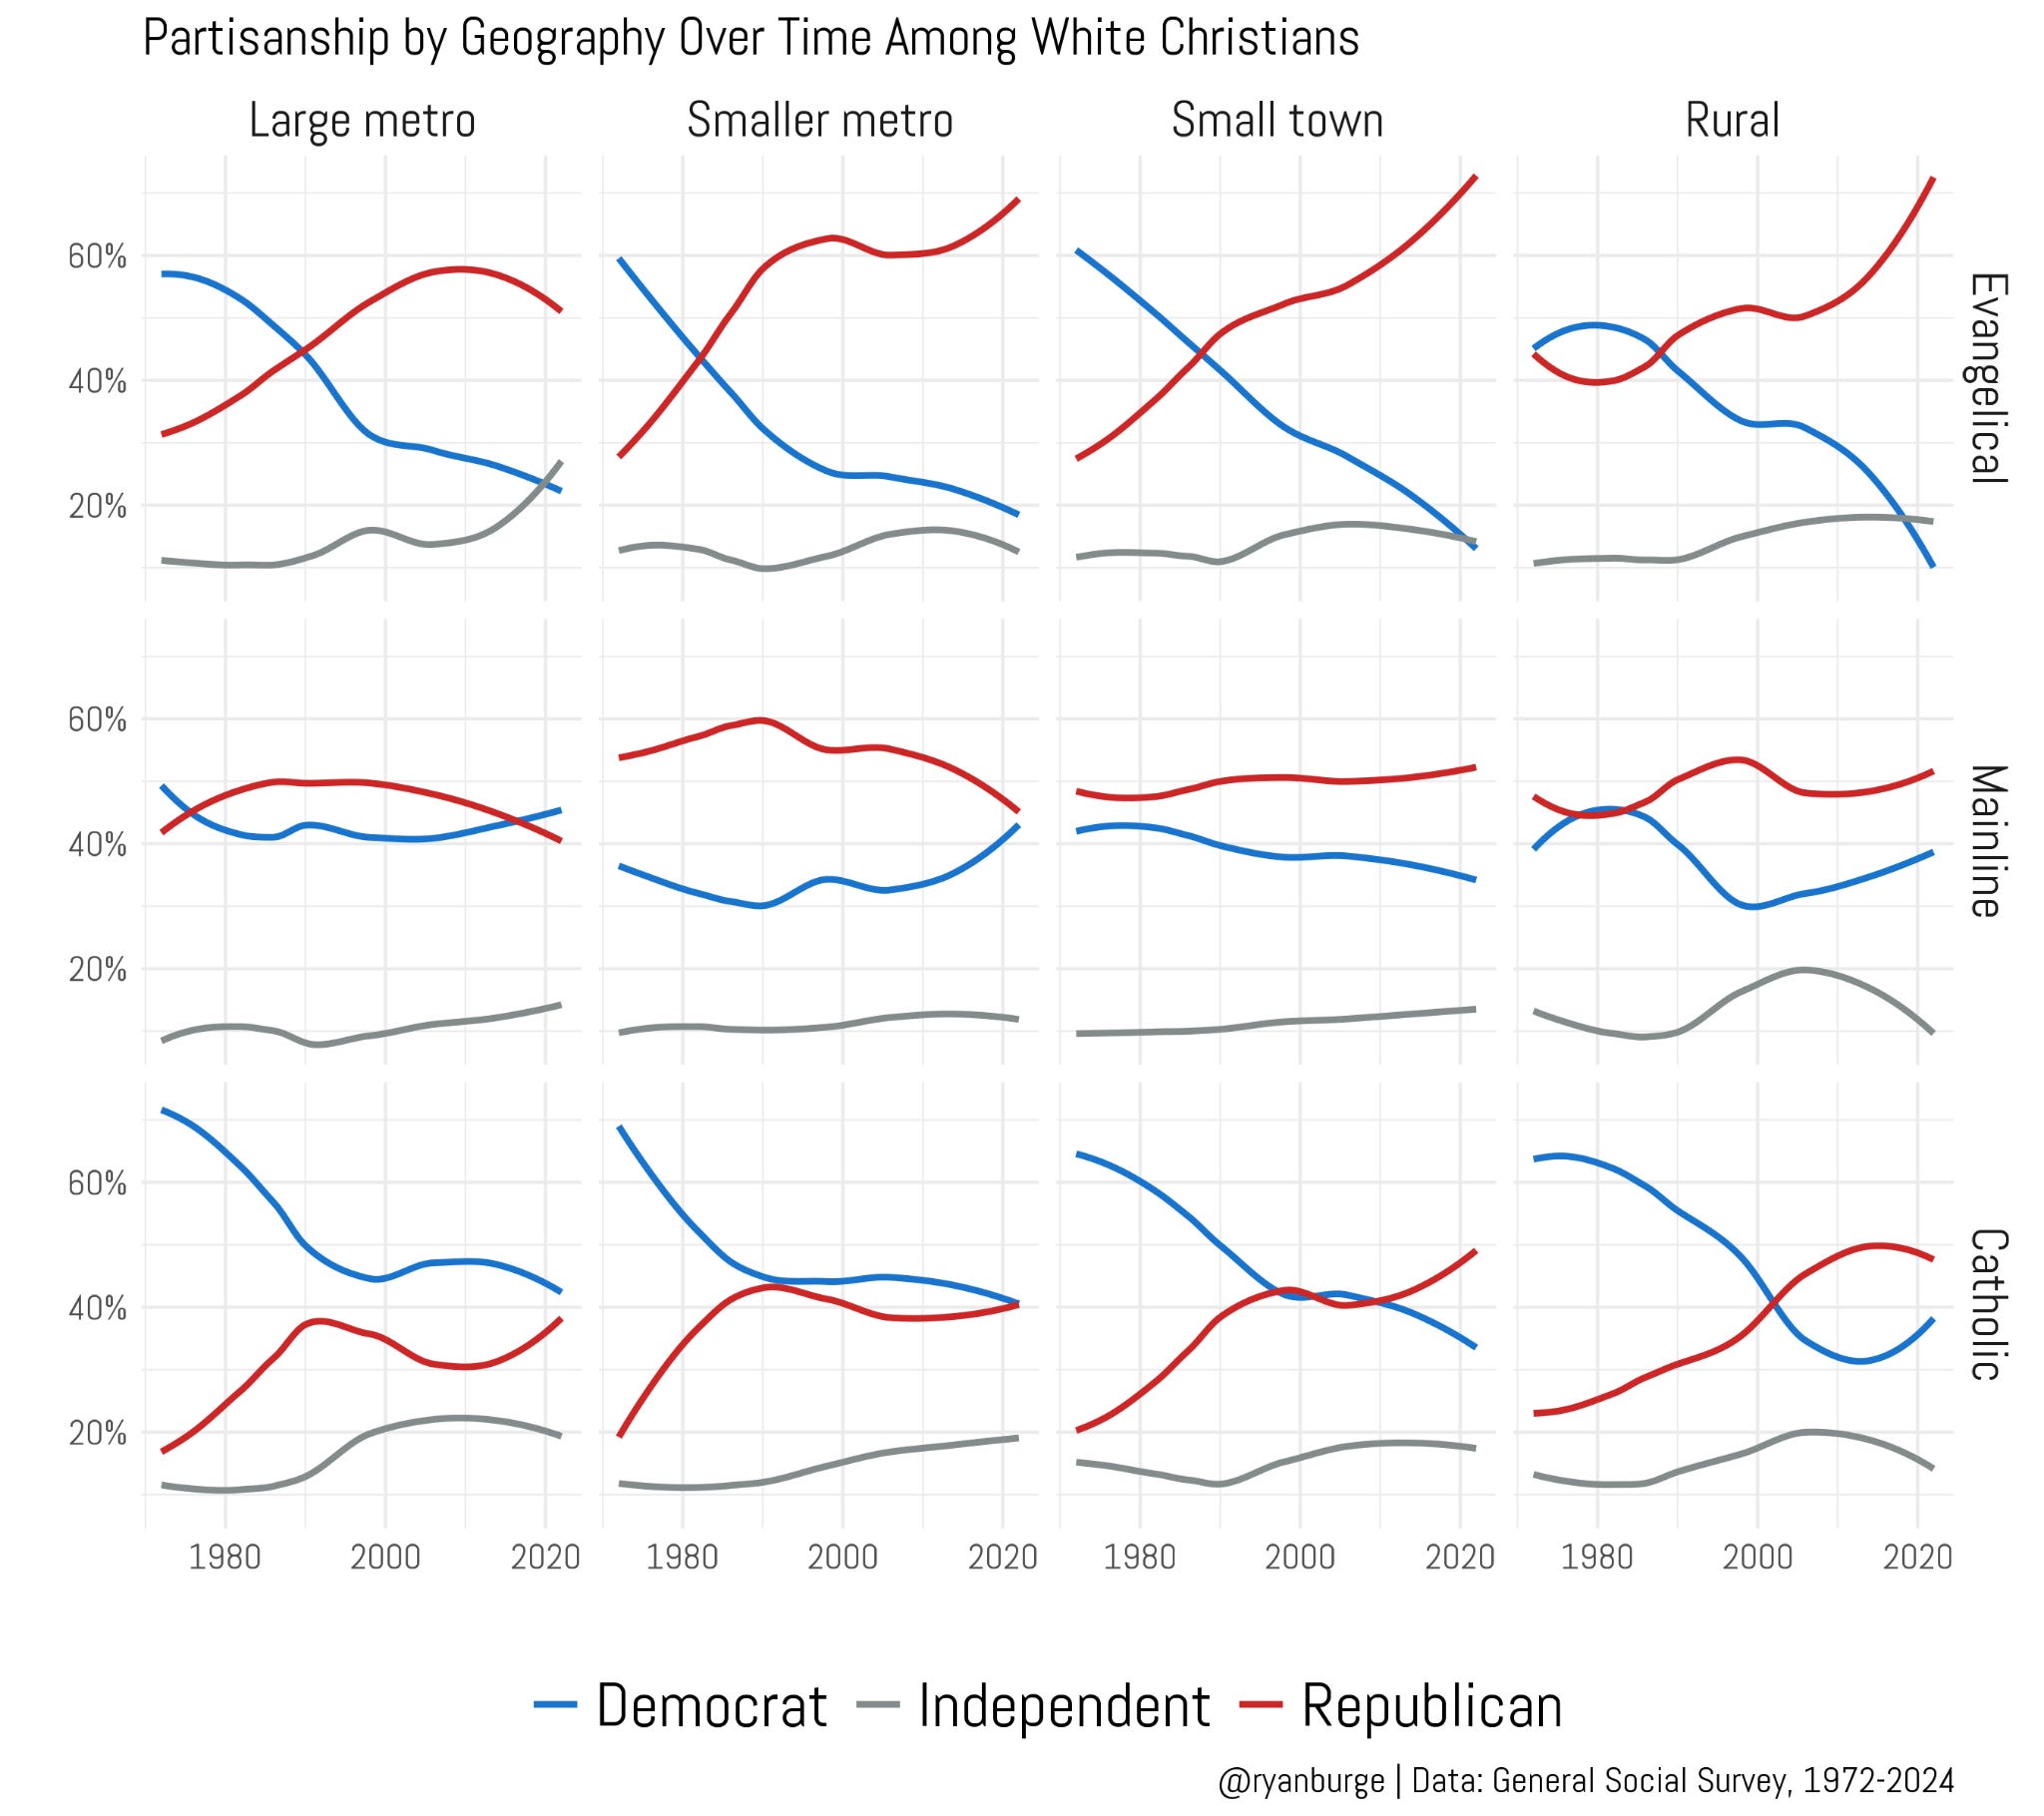
The top row of graphs are white evangelicals over the last fifty years. I think we can pretty easily see when the Republicans began to take over. The crossing of the two lines happened at nearly the same time for evangelicals living in big cities and small towns across the United States. However, the last ten years of data is radically different for evangelicals. Among those living in urban areas, the GOP has stopped making inroads and may have even lost some ground recently. In less densely populated spaces, evangelicals just continue to become more Republican.
For mainline Protestants, the differences between geographies is fascinating because the trend lines don’t really follow a discernible pattern. It’s generally the case that mainliners are more aligned with the Republicans compared to the Democrats. But for mainliners living in smaller metros, the lines have started to converge in recent years, when they have begun to move further apart in small towns.
Are Shrinking Counties Seeing Religious Growth?

Here’s a fun fact that I like to share when I’m in a room full of academics: I have never lived in a town with a population that exceeded 20,000. That’s almost unheard of inside the halls of the ivory tower. A lot of academics grew up in large metropolitan areas, and if they didn’t, they certainly moved to a larger city to attend undergraduate or graduate school. I think that’s one of the reasons why teaching in a place like Charleston, Illinois doesn’t bother me. It’s all I’ve ever known.
What about white Catholics? Well, among those living in more densely populated areas, the Republicans haven’t quite overtaken the Democrats. But that is likely to happen soon. For those living in small towns, the GOP became more popular than the Democrats somewhere around 2016. In rural America, white Catholics began to favor the Republican as far back as 2002.
Here’s what I’ve learned from doing this fun little bit of analysis:
1. Secularism has risen basically everywhere in America. It’s taken hold in both major urban areas but also rural parts of the country, too.
2. In urban areas, the Black Church has gone from dominant to nearly non-existent since the 1970s. In other parts of the country, that same trend happened for mainline Protestant Christianity.
3. Can rural white evangelicals get any further away from the Democrats? In 1972, 45% of them said that they were Democrats. Today, it’s closer to 10%.
One thing to keep in mind in this analysis is that rural America is obviously not that many people. In fact, they made up just 10% of the full sample in 2022. So while I’ve talked about that geography a whole bunch in this piece, they only represent a very small sliver of the country. And there’s no reason to think that they will increase in importance in the years to come.
Code for this post can be found here.
Ryan P. Burge is a professor of practice at the Danforth Center on Religion and Politics at Washington University.

I think the most interesting parts of the axes graphs are the various inflection points, or sometimes their absence, giving a smoother curve-type trend. Each is well represented in the various graphs. And the inflections do not occur at the same year for the different subdivisions. They usually note some external influence. In this type I presentation, I suspect migration, more from smaller population centers to larger ones.
In a time perspective of 50 years, there are also international shifts, with Vietnamese refugees at the early parts of the time lines, Catholic Hispanics with different attendance distributions than descendants of the European Catholic immigrants in more recent years, and an influx of people with Asian religions after about 1990.
An interesting reads, especially as I too live in a "rural" county in northern Idaho. What is interesting here, viz. your data, is how old in average age the county where I live has become. I wonder if this is true elsewhere. As of the last census, there are now more people 65+ in age than 18 and under. Does this skew church attendance data? And most of the newcomers, by far, are "urban exiles" from California, Seattle, and Portland. So you have the urban mindset transplanted to a rural county.
A very interesting article, especially how you parse the growth of the Nones and their ubiquity. Perhaps the stage is being set for another Great Awakening!?