


Here’s how my life goes sometimes. I was mindlessly scrolling Twitter at about 11 p.m. on Friday night (as in October 30th) and my timeline algorithm gave me an absolute gift in the form of this banger:


For the uninitiated, Shiro has done something that is both incredibly difficult and unbelievably valuable. He’s built a package in R that makes it easy for folks like me to build maps of congressional districts. Okay, that’s all fine and good. Seems nerdy, but what does that really mean for this newsletter? Well, it means that I can provide some insight into the upcoming midterms that I’ve never seen before.
Lying in bed, I asked ChatGPT about the feasibility of linking that package with data from the Religion Census, which is an incredibly rich dataset of county-level statistics related to religious adherence. And it thought about it for a minute and basically came back with, “Yeah, I think we can actually do that. There are some methodological hurdles we need to overcome, but it’s certainly plausible.”
Well, I got up early on Saturday morning and started feeding GPT a lot of information. I’ve managed to do it – I can now show all of you the congressional districts that have the largest concentrations of Evangelicals, Mainline Protestants, and Catholics. That allows us to get a solid understanding of how religious composition leads to more or less competitive congressional elections.
Before we get to the maps, a couple of methodological caveats.
The Religion Census counts congregations by county, but counties don’t line up neatly with congressional districts. When a county is split between districts, I allocated its adherents by population: if 30% of a county’s residents live in a district, that district gets 30% of the county’s evangelicals (or mainliners, or Catholics). That assumes religious adherence is spread evenly across each county, so treat these as estimates, especially in districts drawn along racial or urban–suburban lines.
This data from the Religion Census was collected about 6–7 years ago. So, it’s a bit stale. I don’t think that many of these counties have radically changed their composition in the last couple of years, but I just wanted to flag that. I won’t have new data for another 5 years, so I am kind of in “no man’s land” in that regard.
Okay, got all that? Let’s get right to the good stuff.
Let’s start by looking at the congressional districts with the highest concentration of evangelicals.
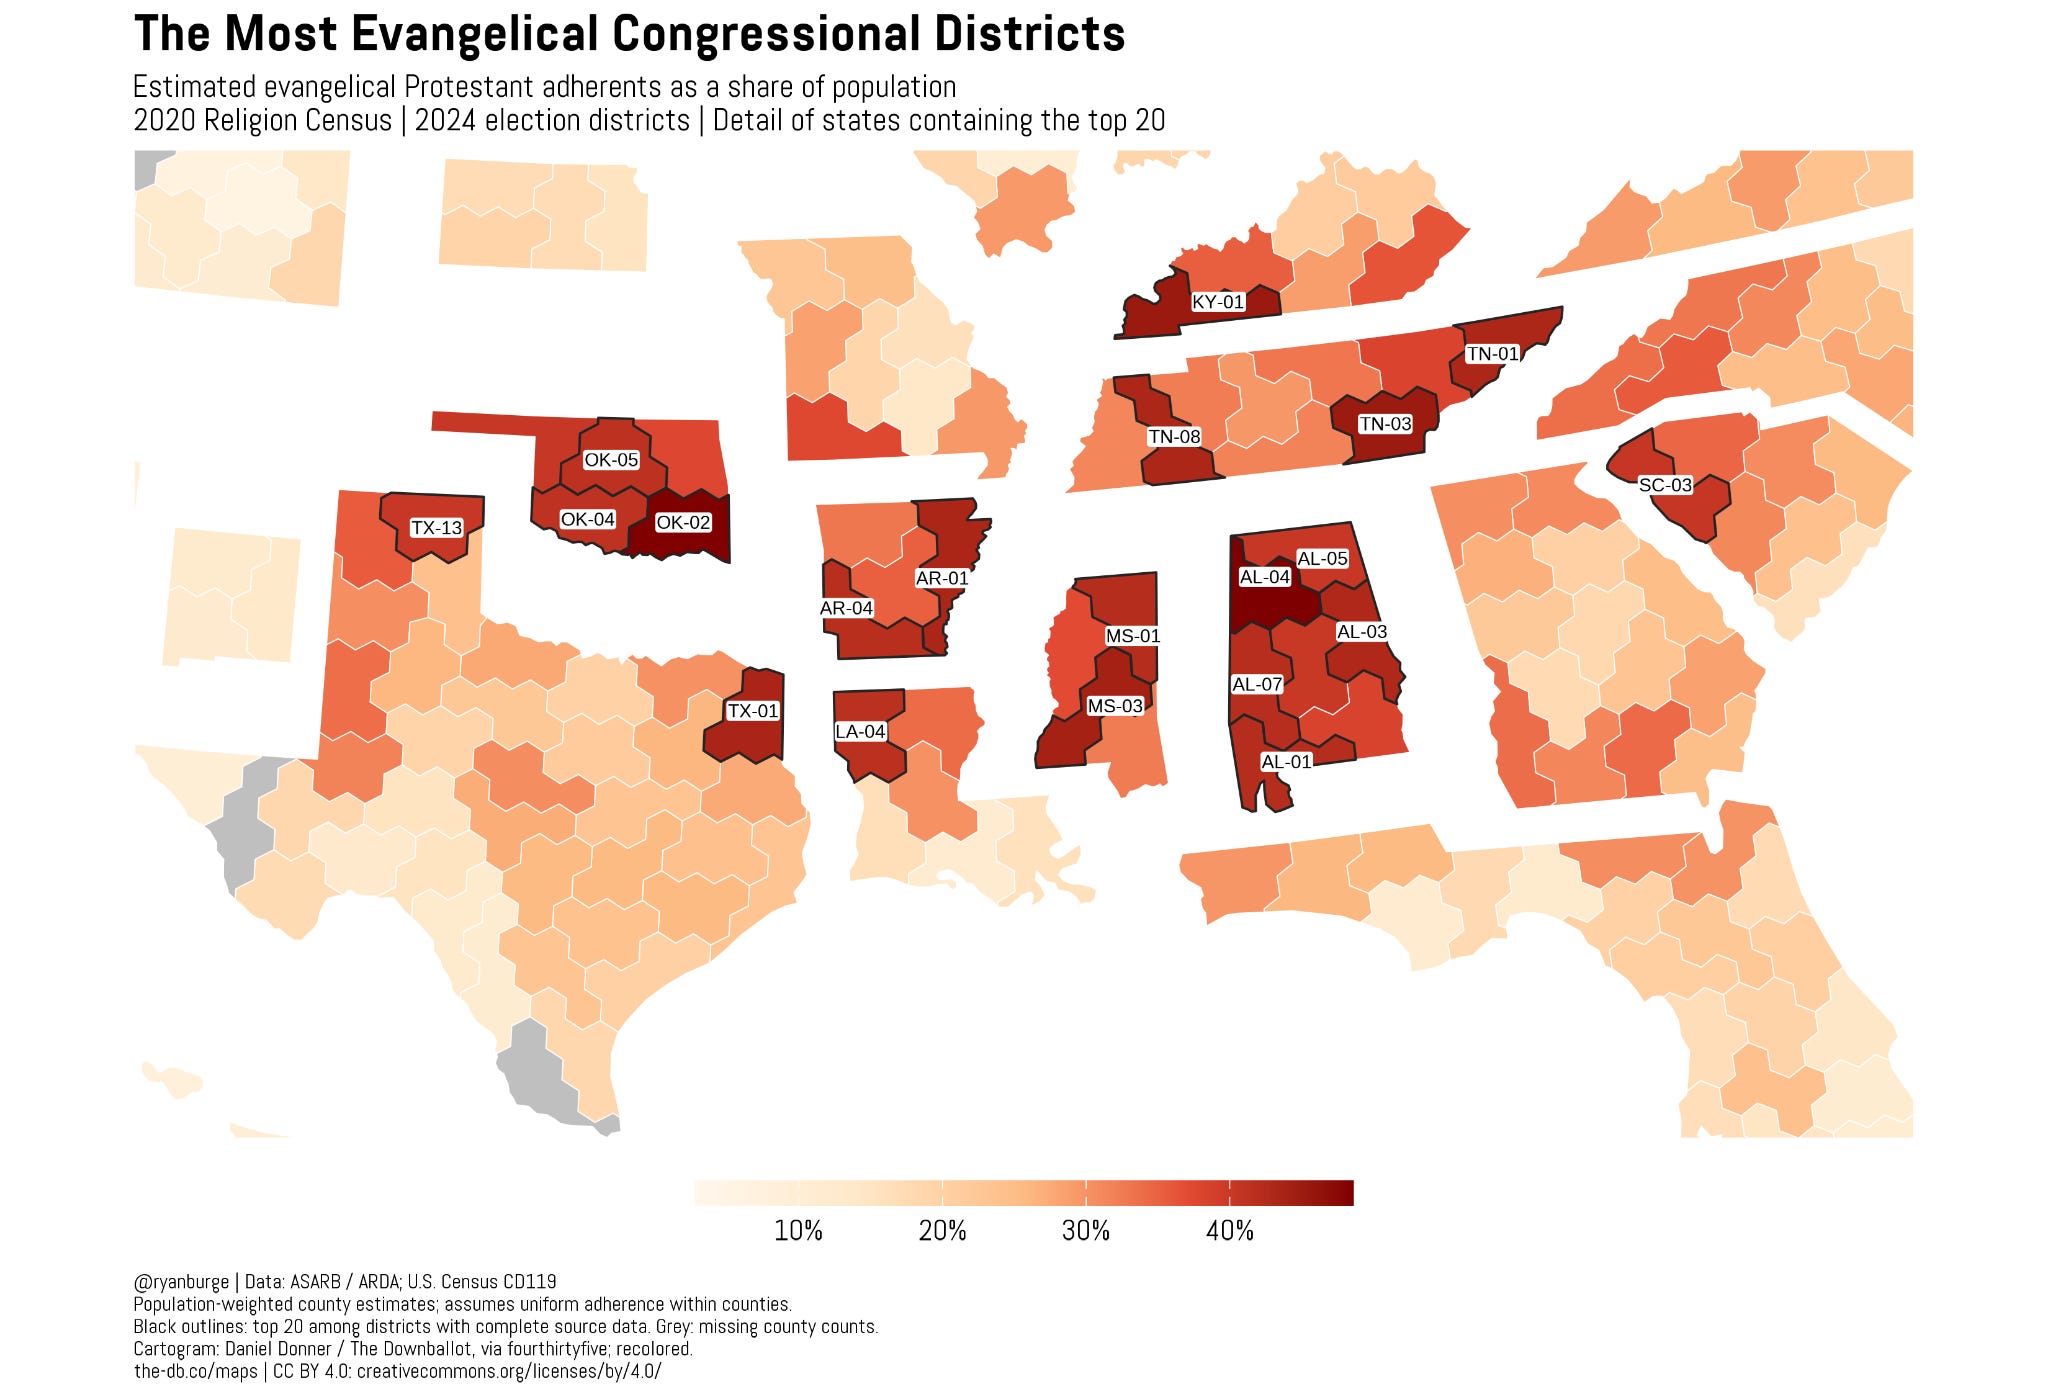
I don’t think that anyone will be shocked to see how I zoomed in on this map. It’s the South, guys. I put labels on the congressional districts with the 20 highest concentrations of Evangelicals, but the whole thing is color-coded so you can get a sense of patterns that way, too. What I think is really interesting is that it’s not exactly one specific subregion in the South.
Alabama and Mississippi do show up a bunch, of course. There are seven congressional districts in Alabama and five of those are in the top 20 most Evangelical CDs in the United States. Mississippi has four CDs, and two of them are listed in the top 20 as well. But from that point on the map, things don’t just ripple out in an entirely logical pattern.
For instance, you have three CDs in Tennessee that are listed in the top 20, but they are kind of dispersed throughout the state. And the 1st congressional district in Kentucky is there, too. But then look out toward the western edge of the map. Oklahoma has a total of five CDs, and three of them are in the top 20. Then you’ve got two in Texas and one in Louisiana.
What’s the partisan lean of those top 20 congressional districts? Well, that’s in the table below. I listed their electoral results from the 2024 elections as a solid reference.
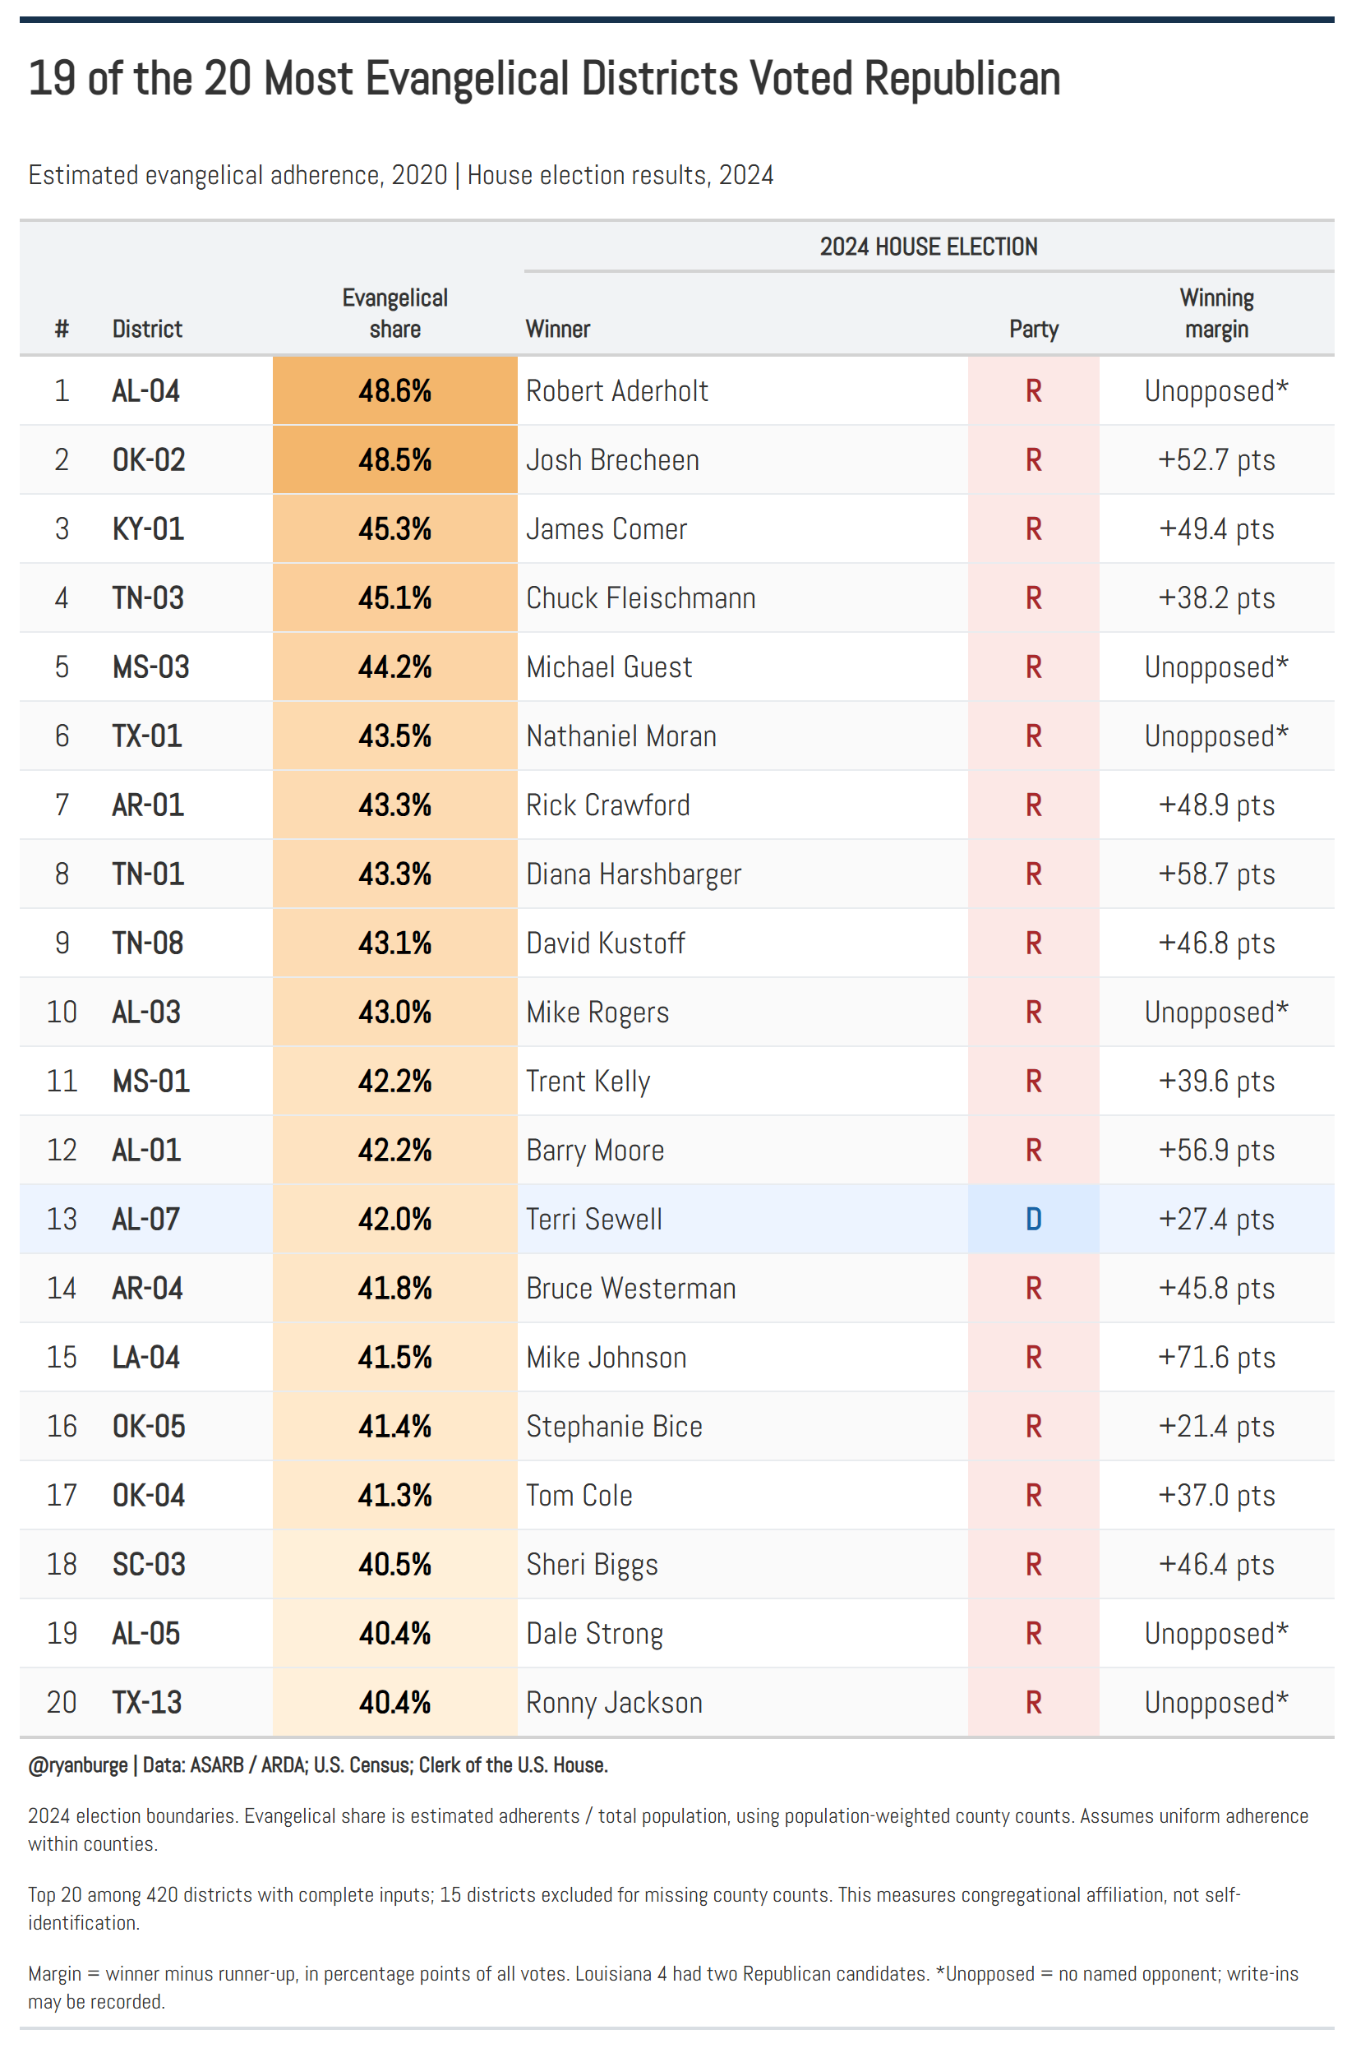
That’s a whole lot of Republican districts, right? In the top twenty most Evangelical congressional districts in the United States, 19 of those were held by Republicans. And in almost every single race, it wasn’t even particularly close. In six of those, the Republican candidate had zero opposition. In the thirteen contested ones, the average margin of victory was 47 percentage points. The median was exactly the same – so this isn’t a case of one or two outliers skewing the results. The GOP dominates in regions of the country where Evangelicals are found in large numbers.
Now there’s one outlier here: the Alabama 7th district. In the 2024 race, Democrat Terri Sewell earned 64% of the vote, compared to 36% for her Republican opponent. Part of the explanation is simple: this is a majority-Black district, and Black Protestant churches are counted in their own category in the Religion Census, not as evangelical. So the evangelicals who show up in that 42% are likely mostly white, and they aren’t the ones electing Sewell.
But I also think 42% overstates it. AL-07 was drawn to take the Black neighborhoods of split counties like Jefferson (Birmingham) and Tuscaloosa, while the heavily evangelical white suburbs mostly sit in neighboring districts. My method assumes adherence is spread evenly across a county, so some of those suburban evangelicals get assigned to AL-07 on paper. This is the district where that assumption probably breaks down the most. (By the way, Alabama redrew its map for 2026 in a way that helps Republicans, but Sewell’s seat is still rated safely Democratic.)
Now let’s do the same thing for the congressional districts that have the highest share of Mainline Protestants.
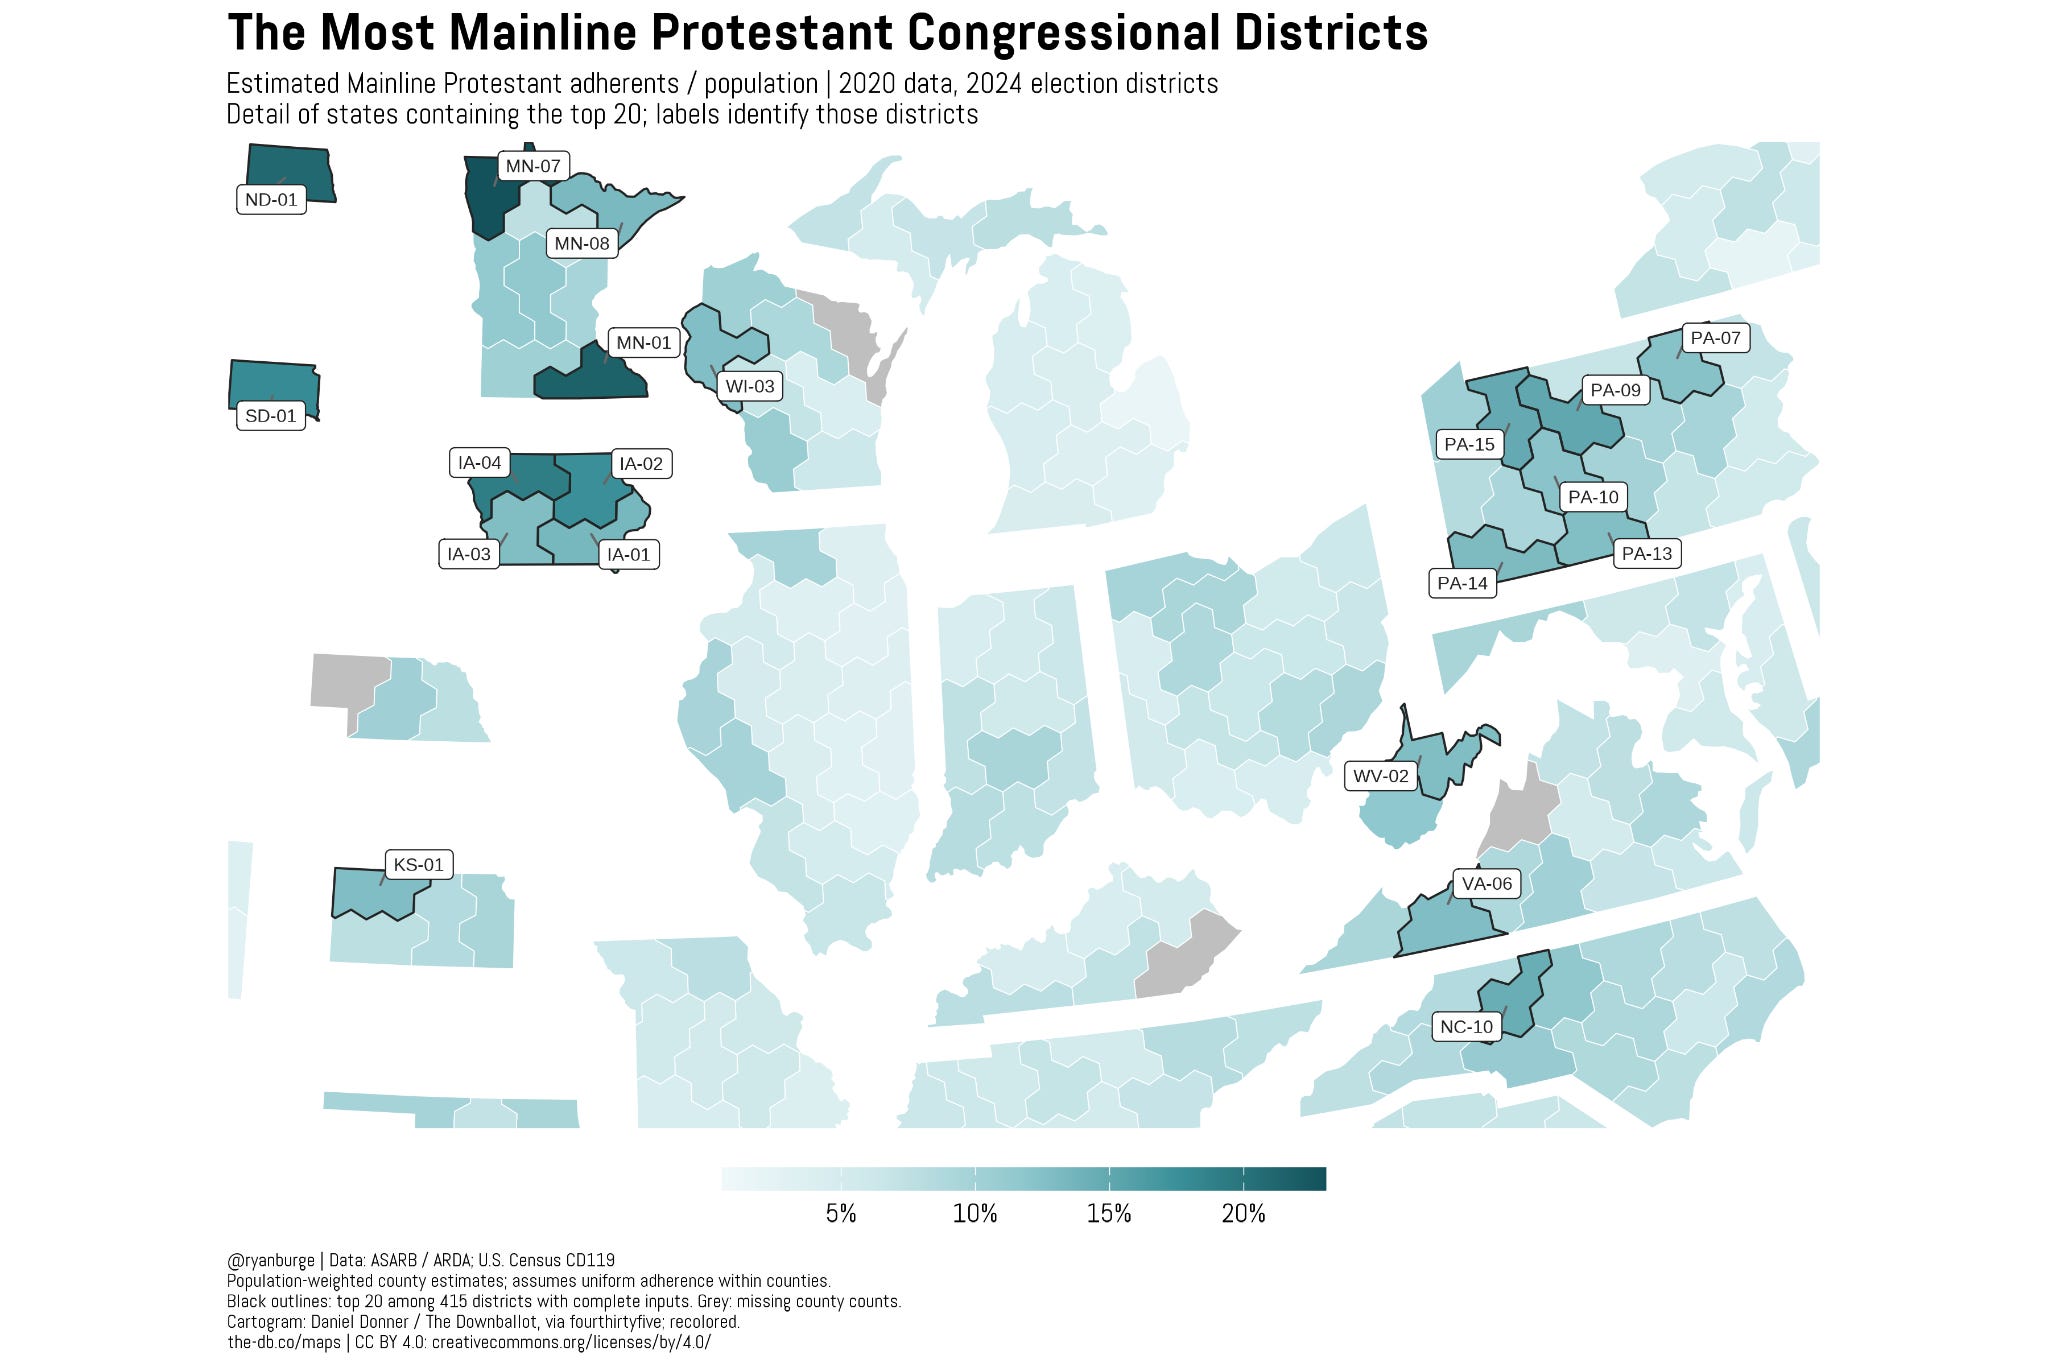
In making the Evangelical map, all I really had to do was zoom in on the South. There were really no heavily Evangelical districts anywhere else in the country. The same is not true for the Mainline. This map is really all over the place. It’s like the Mainline really has two epicenters.
One of those areas with a whole bunch of Mainline Protestants is central Pennsylvania. In fact, six of the top 20 most Mainline congressional districts are found in this part of the state. And there’s also another one in the northeast part of West Virginia, too. The easiest explanation is that a lot of immigrants who were German Lutherans and Scots-Irish Presbyterians settled here, and there’s not been a lot of population turnover in that part of the country.
The other hot spot for the Mainline is, of course, the state of Iowa. There are four congressional districts in the state and every single one of them is in the top twenty districts for Mainliners. You can also see a bit of this in Minnesota, too. Iowa was really a hotbed for Methodist circuit riders back in the 1800s, and there were also lots of Scandinavian and German Lutherans who set up shop there, too.
But also notice how there are heavily Mainline counties in places like northwestern Kansas and the western part of Virginia and North Carolina. It’s really hard to say that the Mainline is concentrated in one region of the U.S.
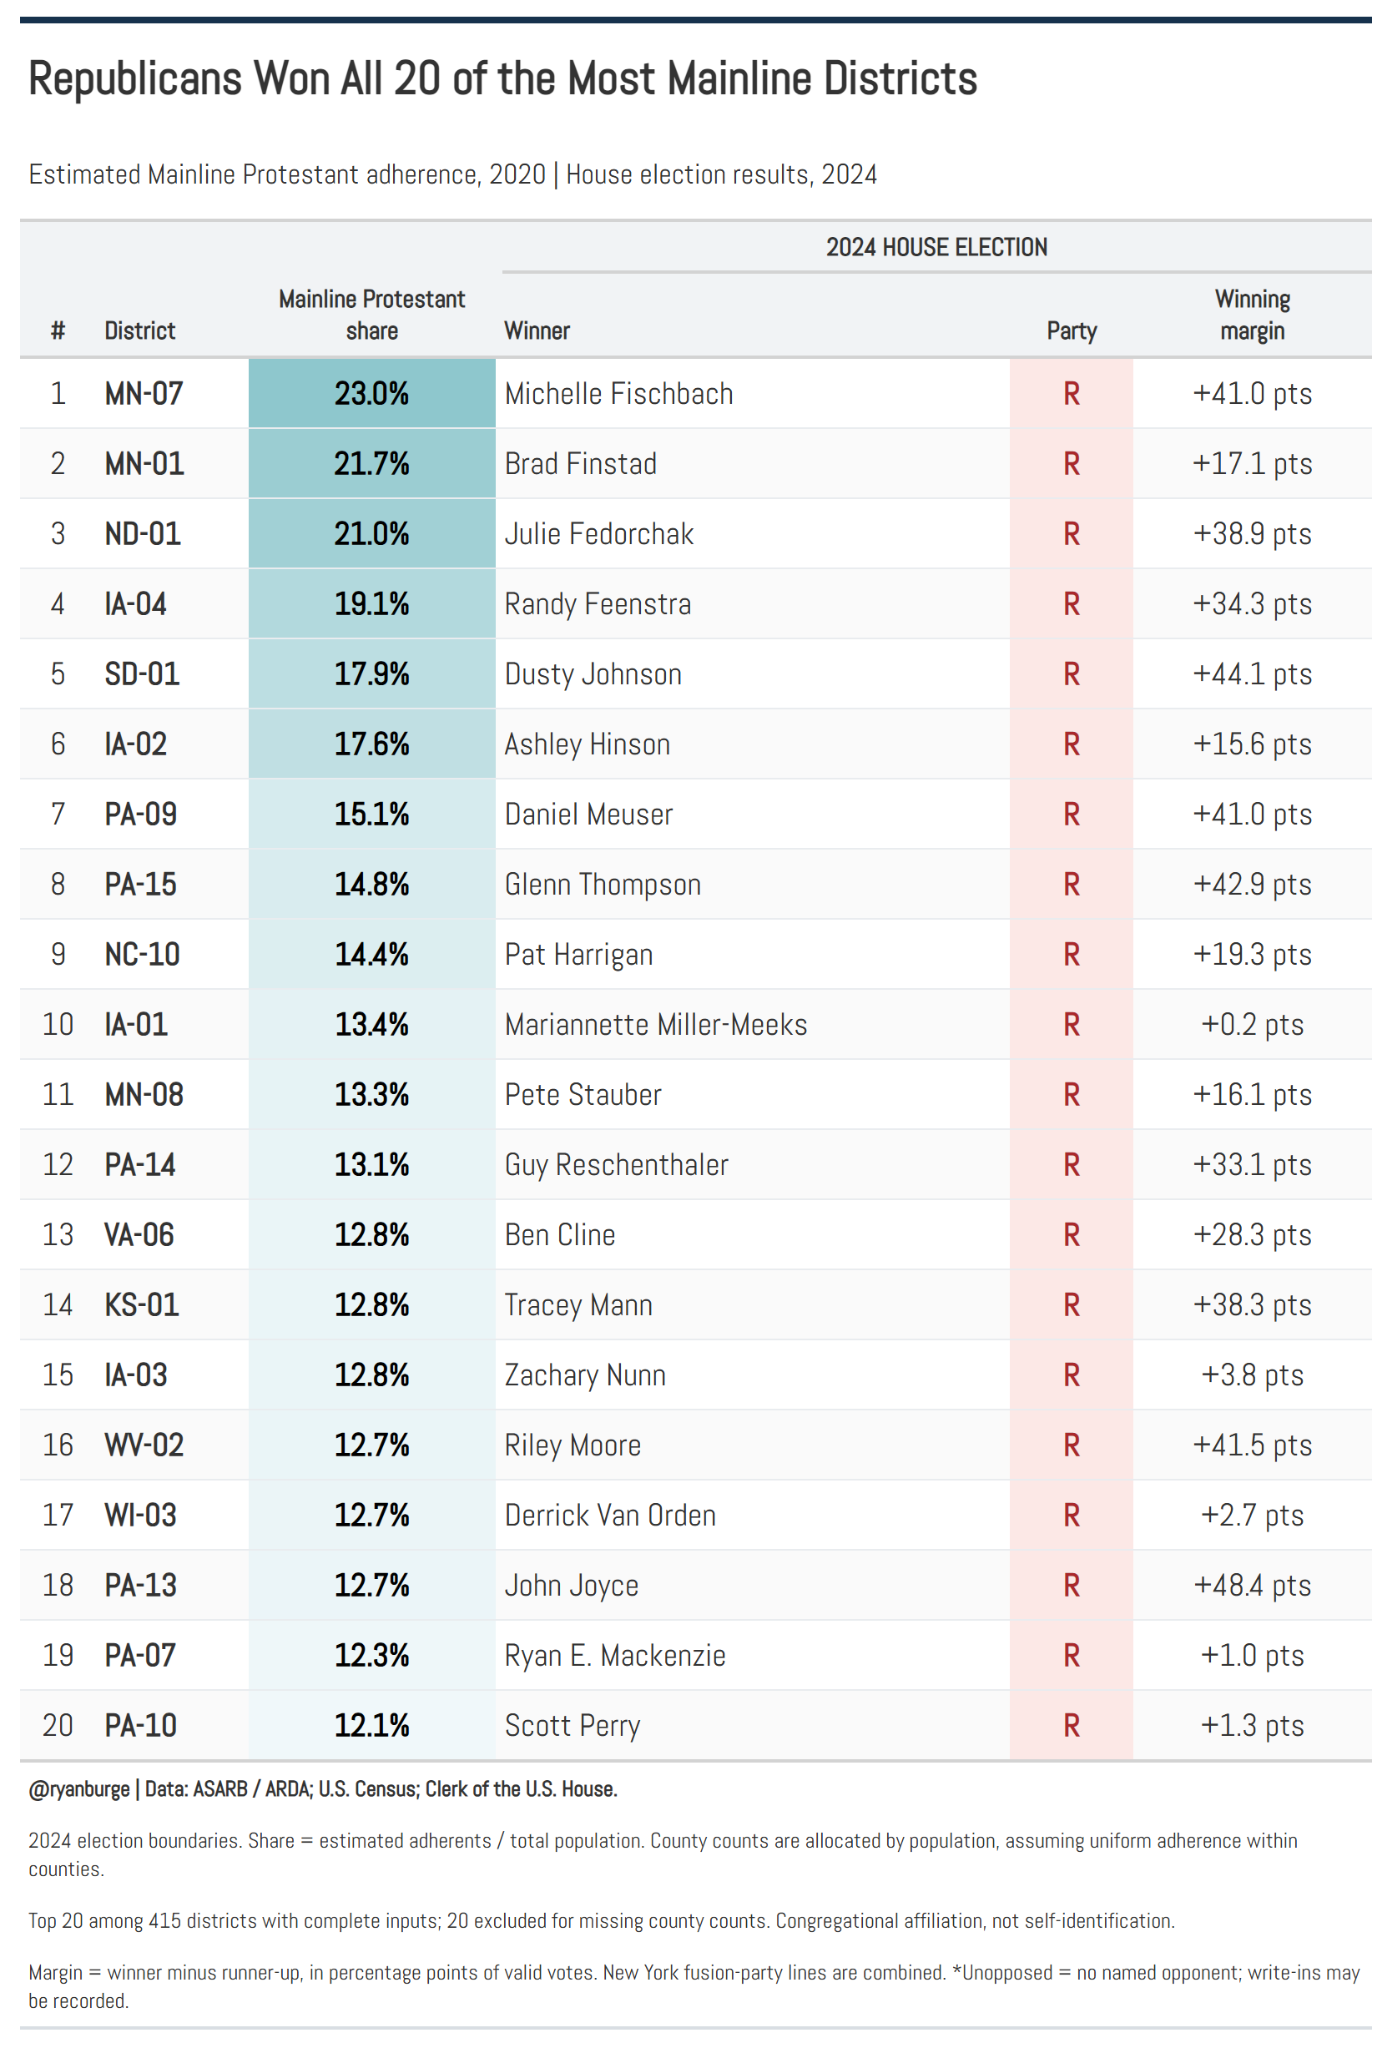
Here’s what may be even more surprising about the heavily Mainline congressional districts – every single one of them sent a Republican to the House of Representatives in 2024. I know I say this all the time, but the conception of the Mainline as being liberal certainly doesn’t apply to their voting patterns. I mean, think about this in relation to the map. These are white, rural, Christian counties. That’s not really the recipe for Democrats winning elections, right?
And what’s even more striking is that very few of these races were even that close in 2024. The average margin of victory was 25 points and the median was 31 points. These aren’t the same level of blowouts as in the Evangelical table, but it’s not like these are very competitive races, either. But one difference worth flagging – five of those 20 races were decided by less than 4 points. There weren’t any close calls in the Evangelical results.
Okay, what about Catholics now?
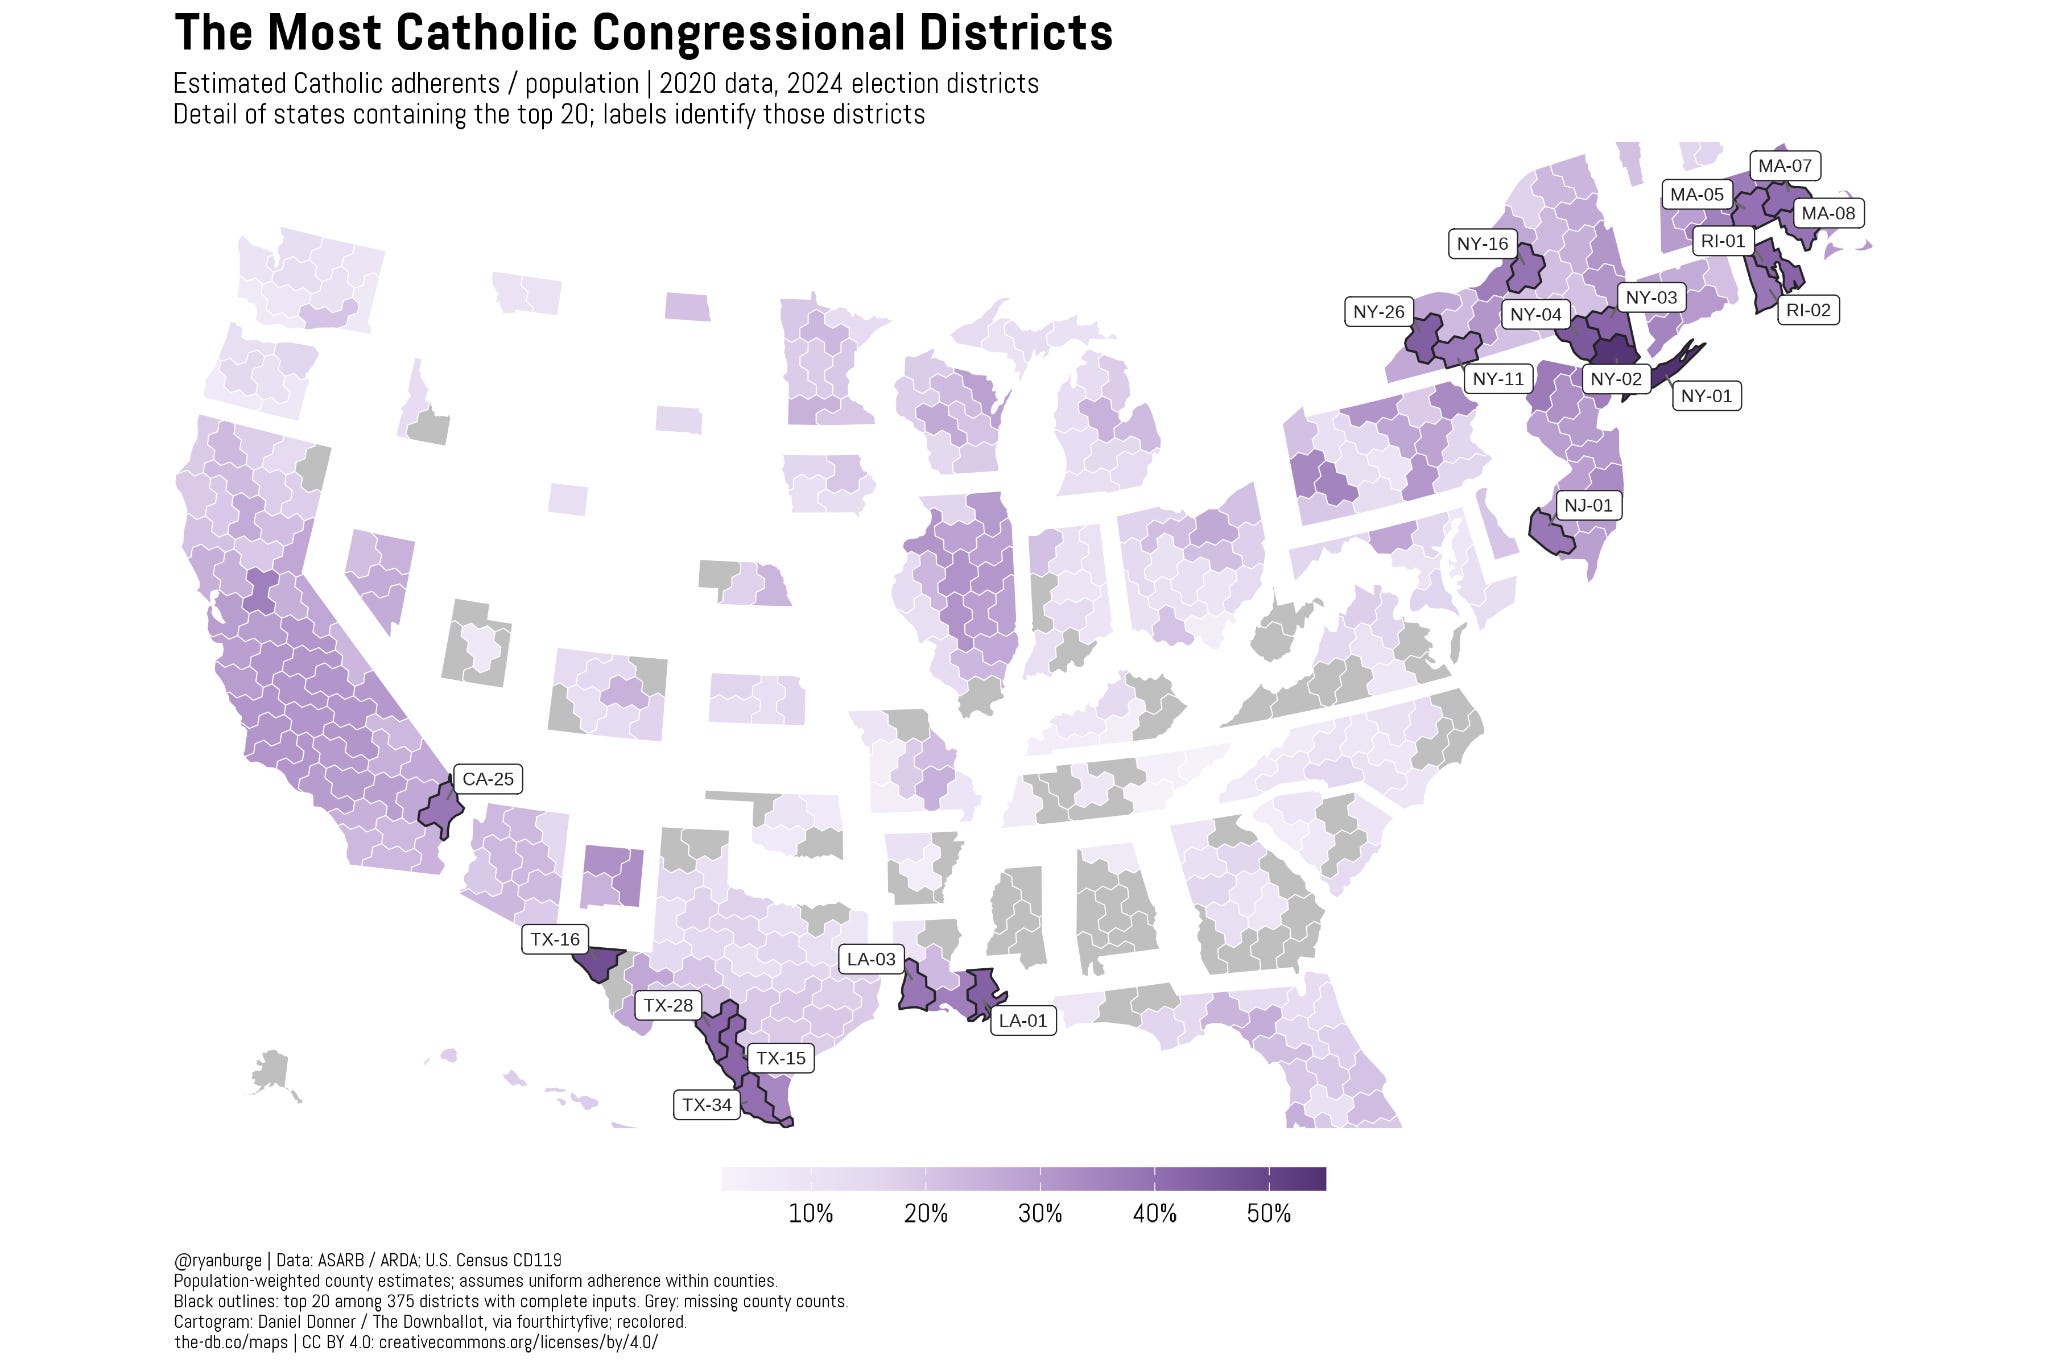
Yeah, there wasn’t really any “zooming in” when I tried to make this map better. At least with the mainline I could focus on the eastern part of the United States. When it comes to visualizing the most Catholic congressional districts, they are spread out all over the country. But I think this map goes a long way in making the point that Catholicism is just way more diverse than Protestant Christianity.
For instance, you’ve got a bunch of labeled counties in the Northeast. That totally tracks, right? A lot of Irish and Italian immigrants settled in areas that surrounded New York City and Boston. They brought their Catholicism with them and their families have largely stayed in the same region. There are lots of labeled counties in New York, Massachusetts, and Rhode Island up there.
But then you’ve got a couple of very heavily Catholic congressional districts in Louisiana and Texas, too. Those aren’t the same type of Catholic, though. LA-01 and LA-03 are Catholic because of their French colonial history. That’s Cajun country. The heavily Catholic districts in Texas certainly don’t speak Creole – it’s Spanish down there. These are Hispanic Catholics in this part of the state.
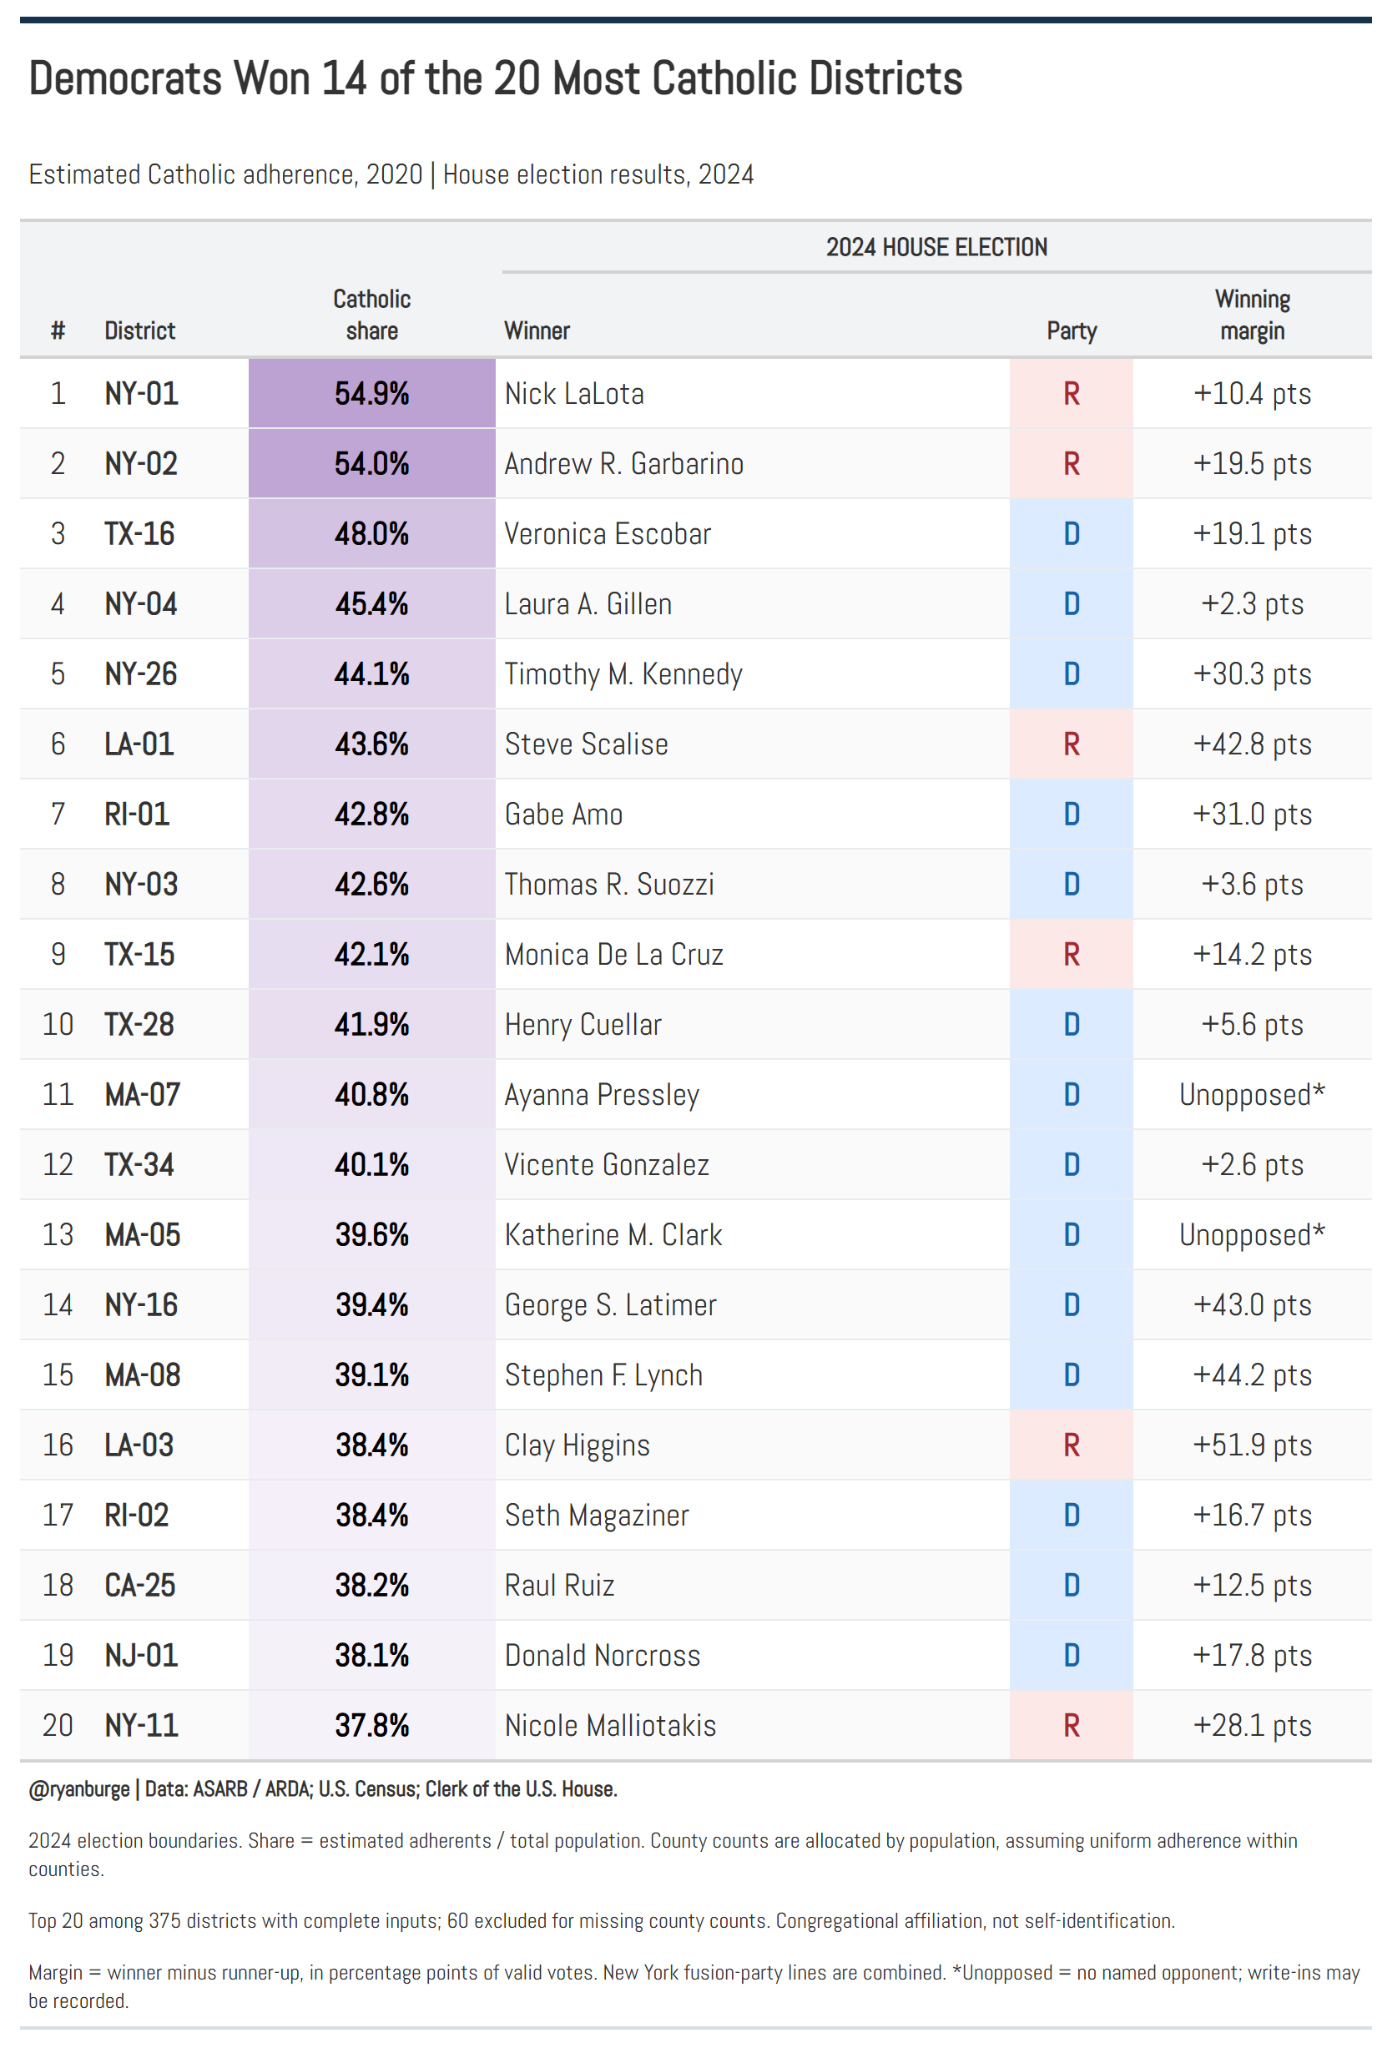
Now this table looks completely different from the previous ones, too, doesn’t it? In the top 20 most Evangelical districts, the GOP won 19 of those races. For the most Mainline districts it was a clean sweep – 20 out of 20. But here it’s almost the opposite of that. In the twenty most Catholic congressional districts, the Democrats won fourteen of those seats. Two of those races were unopposed (both in Massachusetts), but in the rest, the Democrats’ margin of victory was 19 points. Not really close.
Republicans won the six remaining seats. The average margin of victory there was 28 points – not competitive either. But that number is being driven up by two blowouts in Louisiana where the GOP won by 43 and 51 points. It really does matter what type of Catholic we are talking about.
Now what does this mean for tomorrow’s midterms? I tried to make a simple table that shows you what seats may end up changing hands in 2026. I based my guesses on the Cook Political Report ratings that were published a few days ago.
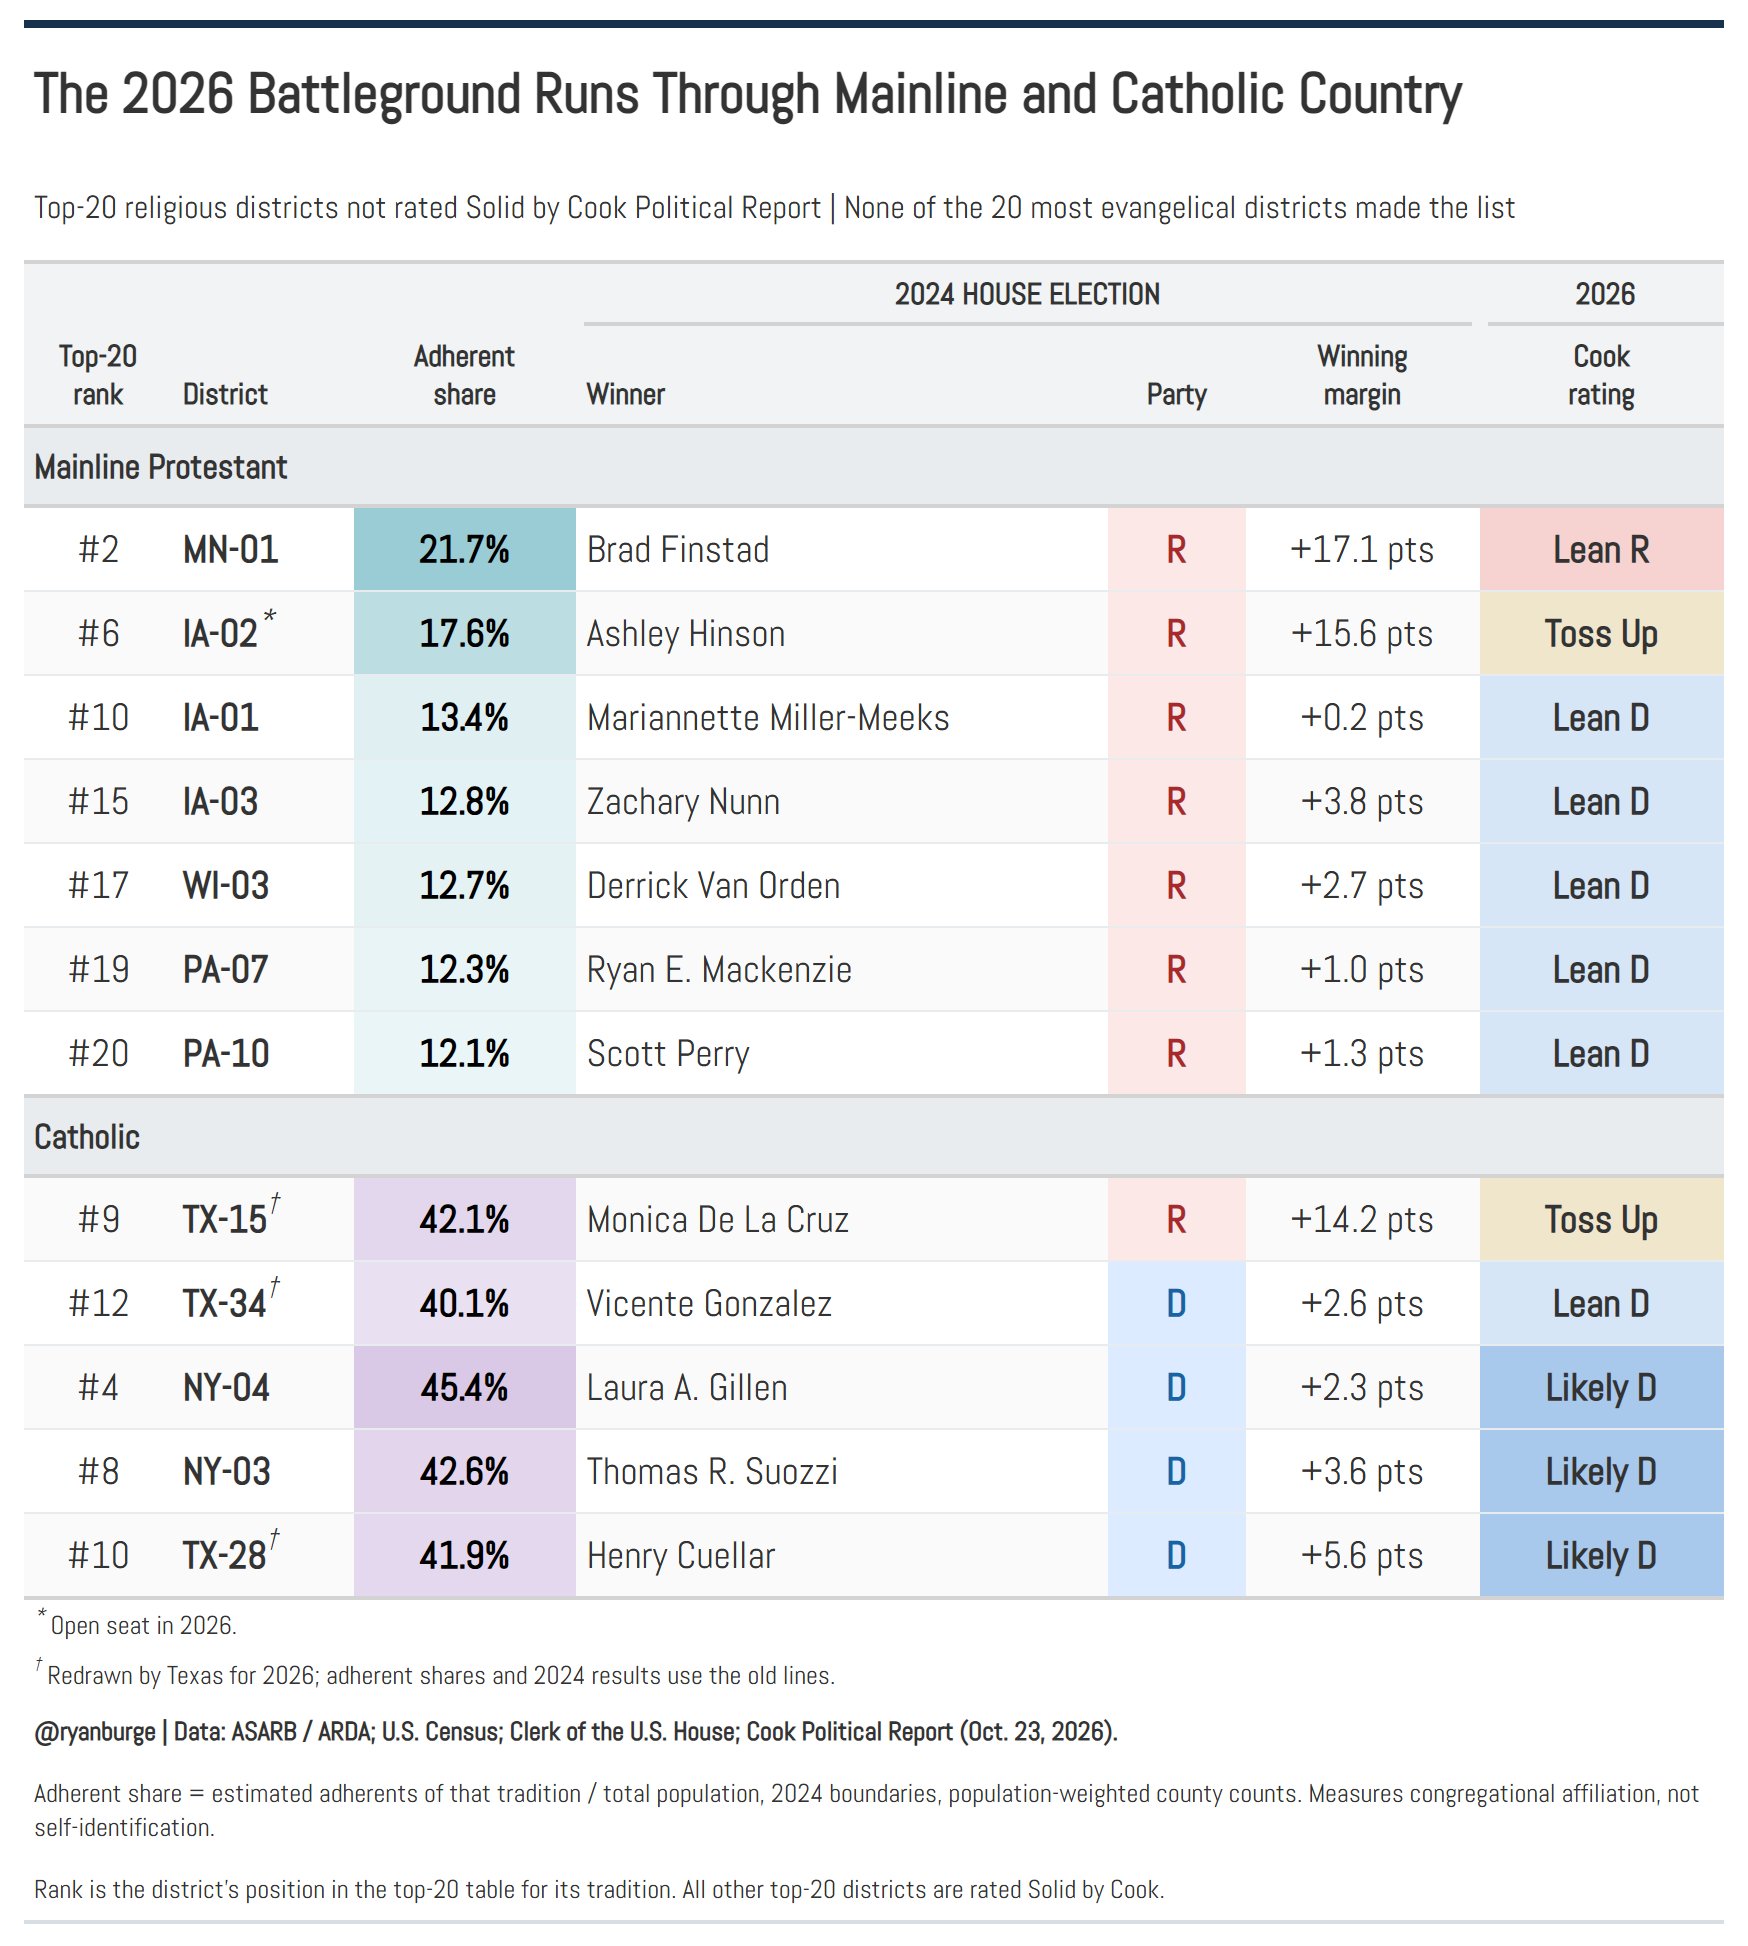
There’s a very good chance that five or maybe six of the twenty most Mainline congressional districts will go from being controlled by the Republicans to being held by the Democrats in the next Congress. And notice that the five that lean Democrat were narrowly won by the Republicans in 2024. The state of the economy and the desire to see a divided government is pushing every congressional race (in my estimate) 5–7 points to the left. That would turn an R+2 race in 2024 into an easy win for the Democrats tomorrow.
On the Catholic side, it looks like there’s a good chance that no seats will actually change hands. The Democrats won a few of those races by small margins in 2024. With the macro-level conditions of 2026, they will likely retain all those seats by 5-7 points. There is a bit of uncertainty around two races in Texas, though. The Texas 15th is one I would keep my eye on. Monica De La Cruz won it easily in 2024, but it’s a heavily Latino district. That’s a voting bloc that has shifted significantly toward the Democrats in the midterm polling.
So, there you have it – how religion may play a role in the 2026 midterm election. For what it’s worth, I don’t see this as being a particularly “religious” election cycle. This one is about pure economics. When inflation is high, the party in power will get punished for it. That’s doubly true when they control both houses of Congress and the White House.
Buckle up, Republicans, it’s going to be a bumpy ride.
Code for this post can be found here.
Ryan P. Burge is a professor of practice at the Danforth Center on Religion and Politics at Washington University.

Great post. In a time of nationalized news media and the flattening effects of social media, it’s so cool to be reminded of how historical demography reverberates through the country.
Should’t you do a similar analysis for the fourth major religious group in America: the Nones?