


Let’s get nerdy. For those of you who sit around and wonder about the intricacies of polling about religion, this is the post for you.
Let me start by stating a fact that seems incomprehensible to even type out, but it undergirds almost every single graph that I produce: we don’t actually know the religious composition of the United States with any real precision. I know that sounds bizarre. But the honest truth is that we are relying on a whole bunch of “best guesses” based on sound methodology and replication — and we have no way to know for certain if any of them are right.
The reason is simple: the United States made it illegal to ask about religious affiliation on the Census back in the 1970s. (This short piece from Pew explains the whole mess well.) That puts researchers like me in a real bind, because without a Census benchmark there’s no authoritative reference point to weight our surveys against. We know exactly what share of Americans have a four-year college degree because the Census tells us. We have no equivalent anchor for Catholics, or evangelicals, or the religiously unaffiliated.
To their great credit — and great expense — Pew has tried to fill this void with the National Public Opinion Reference Survey (NPORS), and it’s a genuine methodological achievement. But everyone working in this space knows that what we really need is a Census benchmark, and we don’t have one.
In a post from February, I pulled back the curtain on survey methodology — specifically the difference between probability-based polls and opt-in panels. I’m not going to rehash all of that here, so I’d strongly encourage you to go read it first. But in short: probability-based surveys like the Pew Religious Landscape Study randomly select respondents from the full population, while opt-in panels like the Cooperative Election Study draw from volunteers — and that distinction can produce meaningfully different pictures of American religion.
How meaningfully different? That’s exactly what today’s post is about. Let’s start by comparing the two surveys on the basics: religious attendance and religious affiliation across the full sample.
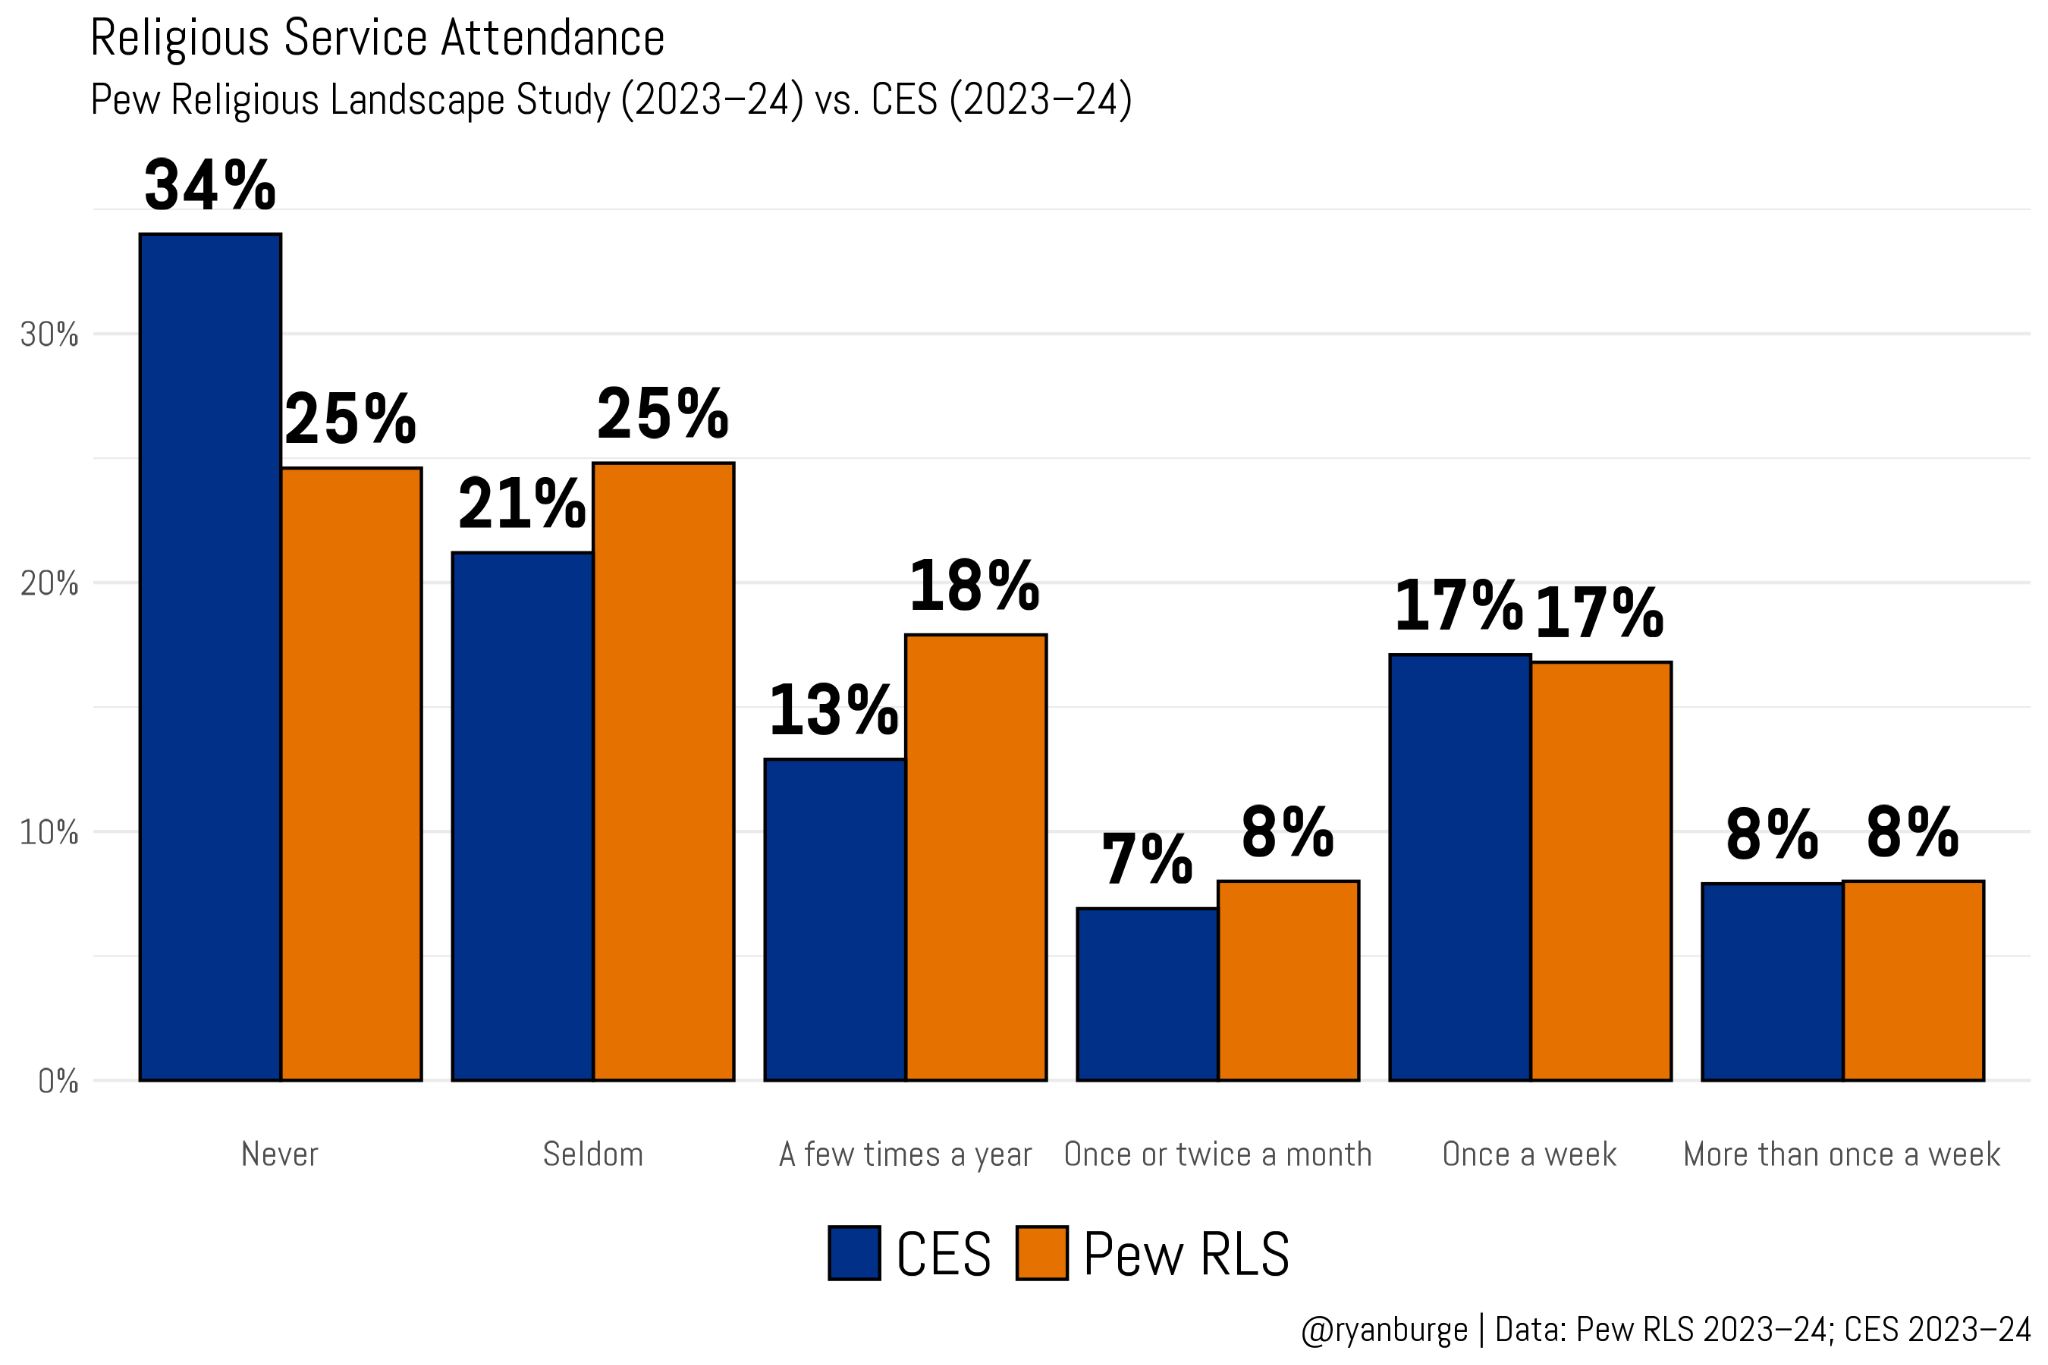
It doesn’t take long to find a meaningful difference between the two instruments. In the CES, 34% of respondents say they never attend religious services, compared to just 25% in the Pew data — a nine-point gap that would be genuinely alarming if it held up across the board. But zoom out a little and the picture gets more complicated. Pew actually records a higher share of “seldom” attenders than the CES — 25% versus 21%. Add those two bottom categories together and the gap shrinks considerably: 55% of CES respondents attend less than once a year compared to 50% in Pew. That’s a five-point difference, which is not nothing, but it’s hardly a chasm.
What I find most reassuring is the right side of the graph. The share of CES respondents who attend weekly or more? Exactly 25% — the same figure Pew produces. On the measure that matters most for congregational health and religious vitality, the two surveys are in complete agreement.
The non-religion picture tells a similar story. In the full CES sample, 34.5% identify as religiously unaffiliated compared to 29.4% in the Pew data — that same five-point gap showing up again. But the more interesting question isn’t the overall margin, it’s where that gap comes from. Here’s what it looks like when I break it down by birth decade.
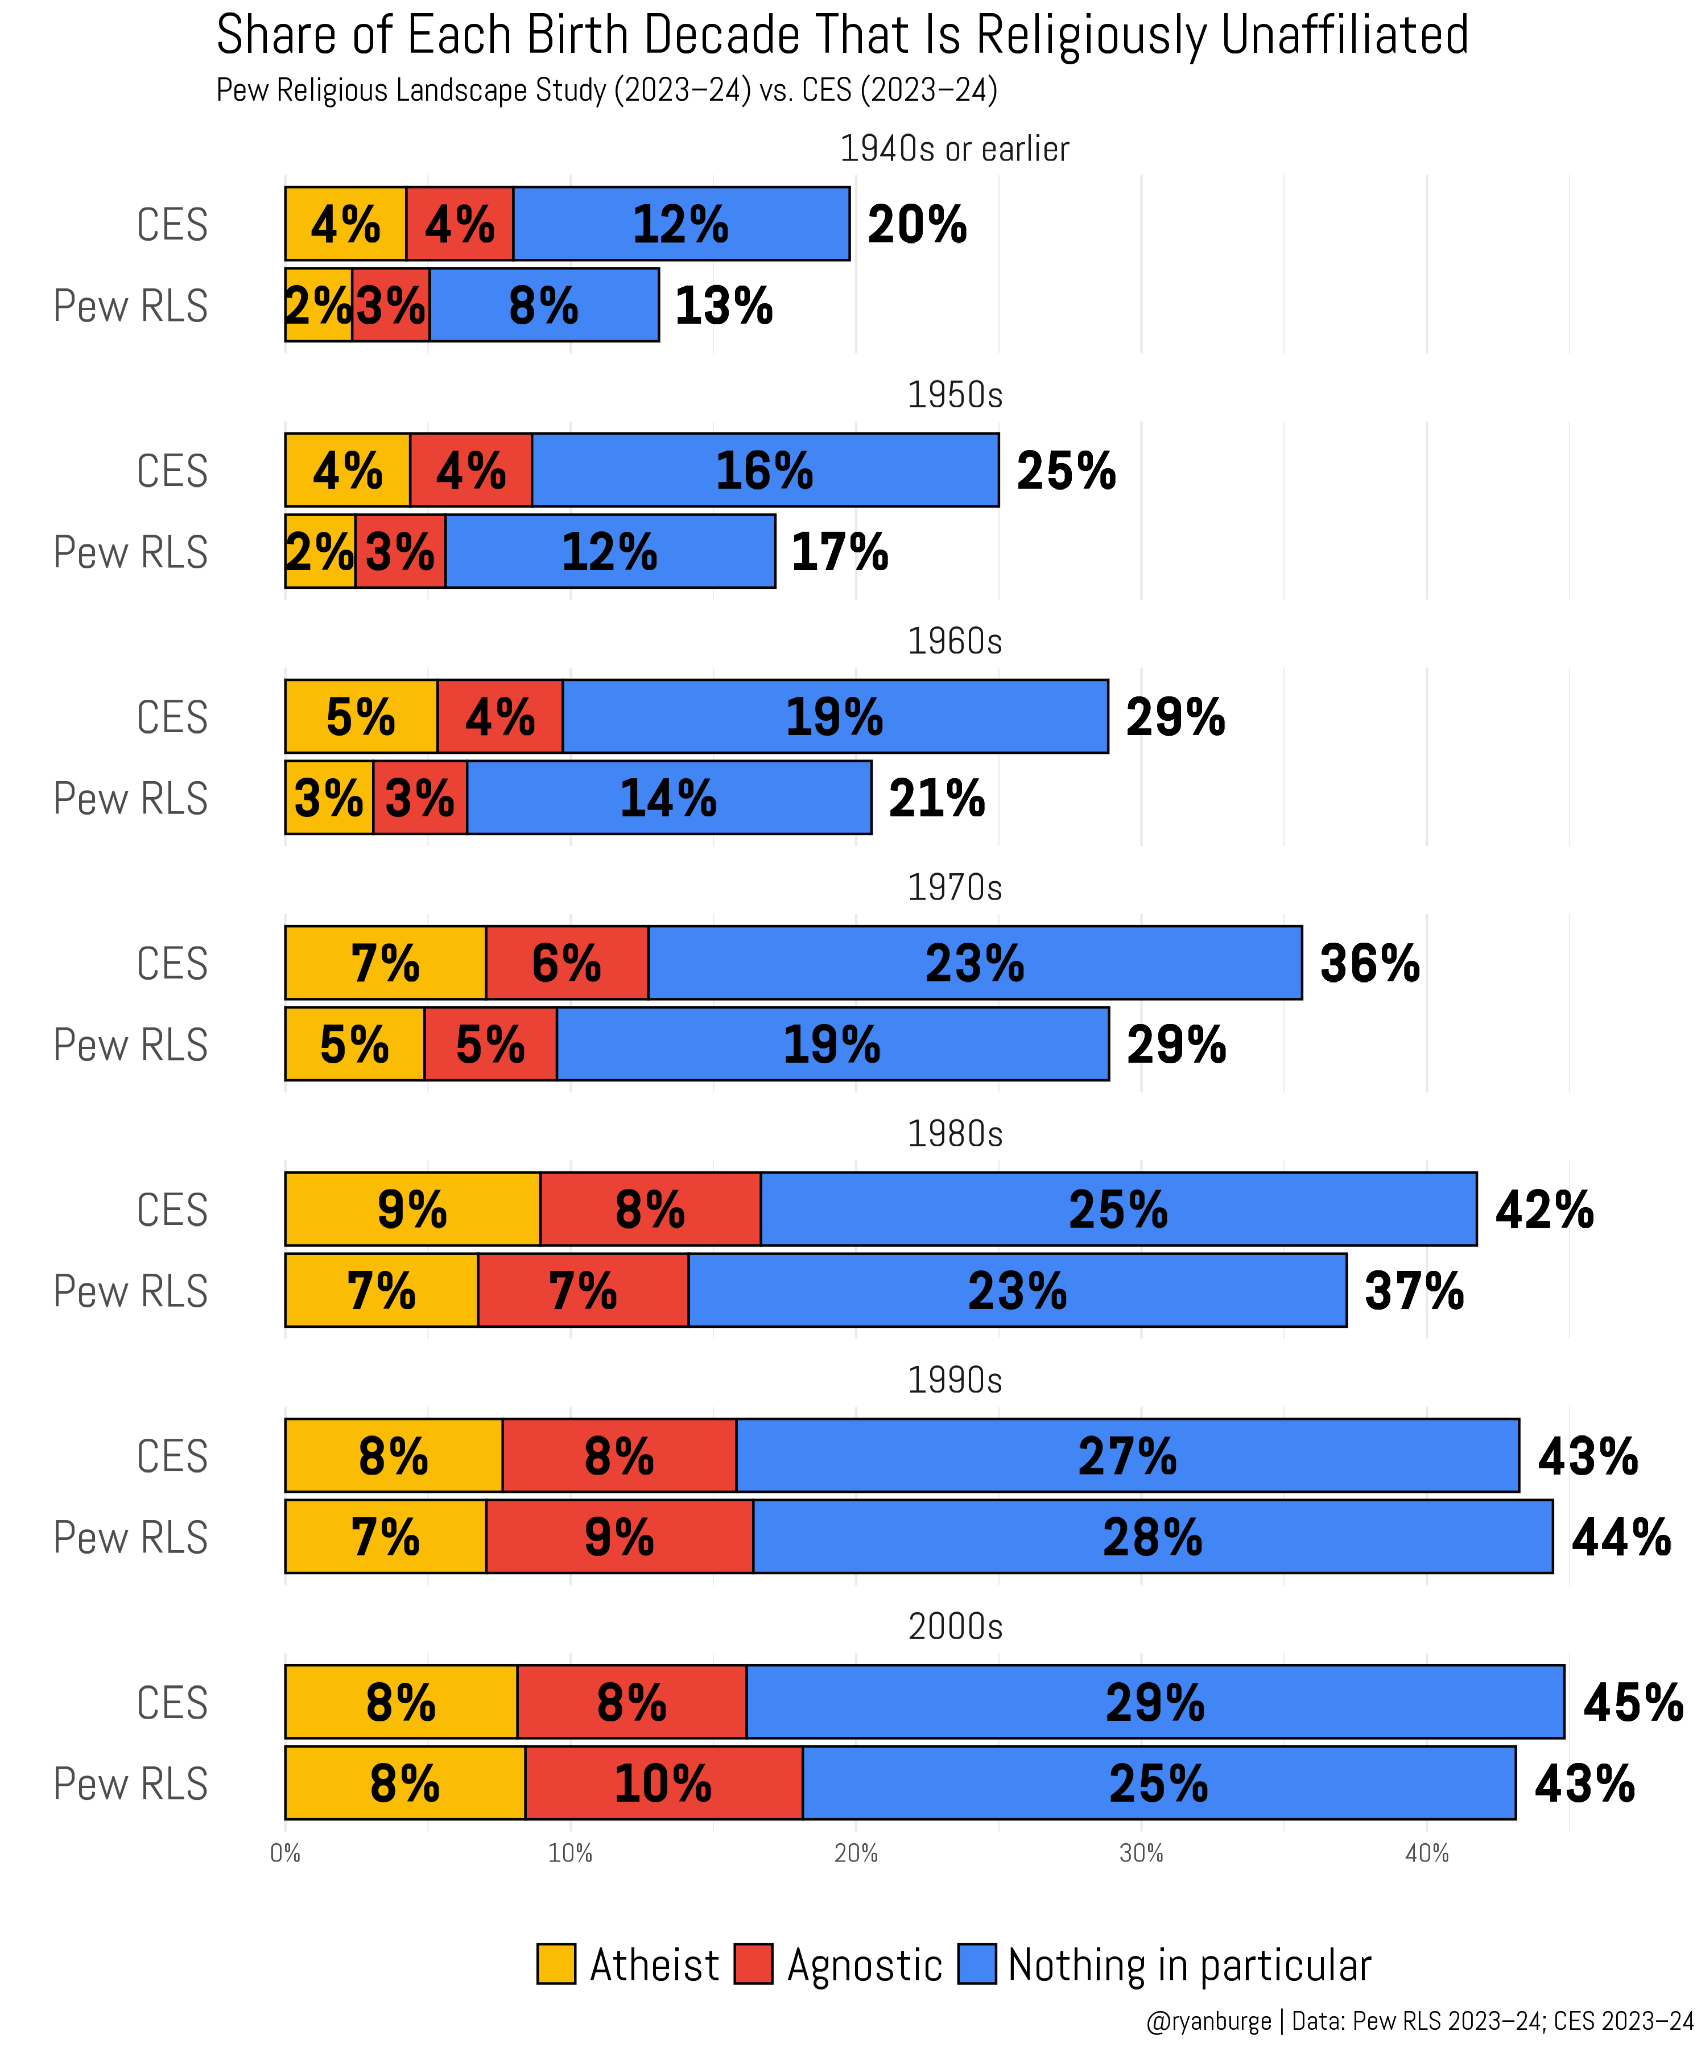
It’s certainly the case that older Americans are much more likely to be recorded as non-religious in the CES compared to the Pew RLS. Among those born in the 1950s, the figures are 25% versus 17%. The gap is eight points among those born in the 1960s, and seven points for those born in the 1970s — 36% versus 29%. These are real, substantive differences that are impossible to simply wave away.
When we dig into the type of none, though, a clearer picture emerges. The primary driver of the divergence is the “nothing in particular” category — older CES respondents are considerably more likely to land there compared to the Pew sample. The atheist and agnostic gaps exist too, but they’re modest by comparison.
I’ve turned this over in my head many times and I can’t fully resolve it. My first instinct was social desirability bias — the idea that Pew respondents were more likely to be talking to a live interviewer and therefore less willing to disavow religion. But Pew’s own methodology indicates that 97% of RLS participants completed the survey through a web browser, just like CES respondents. That levels the playing field and takes my best explanation off the table.
The most I can say with confidence is that address-based sampling and opt-in panels are recruiting fundamentally different kinds of older Americans, and those differences show up in how they answer questions about religious identity. But I’d be overstating my certainty if I claimed to know exactly why. Sometimes the honest answer is that the data surfaces a question I can’t fully resolve.
What makes this even more puzzling is what happens at the other end of the age spectrum. Among the youngest Americans — those born in 1990 or later — the two surveys are essentially in agreement, never diverging by more than a couple of points. If the gap were simply a product of opt-in panels attracting a certain kind of respondent, you’d expect it to show up across all age groups. The fact that it’s concentrated among older Americans suggests something specific is happening with that cohort, not a universal feature of how these two instruments measure religion.
With that caveat on the table, let’s press on. I pulled together Pew’s estimates for the share of various religious groups with a four-year college degree and compared them to the same figures from the CES.
