How Protestant Denominations Have Voted from 2008 to 2024
22 Protestant Denominations, 5 Elections, 1 Story

In the last couple of months I have written posts on how evangelical Protestants, mainline Protestants, and Black Protestants voted in the 2024 election cycle and I also dug into some of the possible reasons why things have shifted towards Donald Trump in the last couple of years. But I know what you all really want - a whole lot more granularity into specific Protestant denominations. I get asked about specific denominations all the time, so I guess it’s time to provide you the best answer that’s possible.
Now, before you scroll down and quickly glance at these graphs and then click off my post and doom scroll social media for another thirty minutes, I have to give you some qualifications about these results. I don’t have every denomination under the sun listed below. You won’t find the Church of the Nazarene, the Disciples of Christ, or the African Methodist Episcopal Church. There’s a very good reason for that - the sample size is too small. The math behind all this might help.
If I combine the five datasets from presidential election years together, the sample size is about 273,000 respondents. But guess what? A lot of people don’t actually vote. So, that already reduces my sample size by about 40%. But then we have to subdivide it even further into specific Protestant denominations. The numbers get pretty small, pretty quickly.
Why I Can't Tell You How Quakers (or Unitarians) Voted in 2024

I’ve got to admit that I am writing this post while gritting my teeth just a bit. Which is probably not a good state of mind, but I just have to get all these thoughts down in a single post. Let me tell you what is driving my consternation.
For instance, out of that 273,000 folks that I began with, just 518 were members of an AME church. And remember - that’s not the share of AME folks who voted, that’s all of them in the sample. So, I made an admittedly arbitrary choice and eliminated any denomination that didn’t have at least 750 respondents across my five survey samples. That means that lots of groups are excluded, but the end result is a bunch of graphs that don’t have huge error bars. Feel free to yell at me in the comments about why your denomination isn’t part of the analysis.
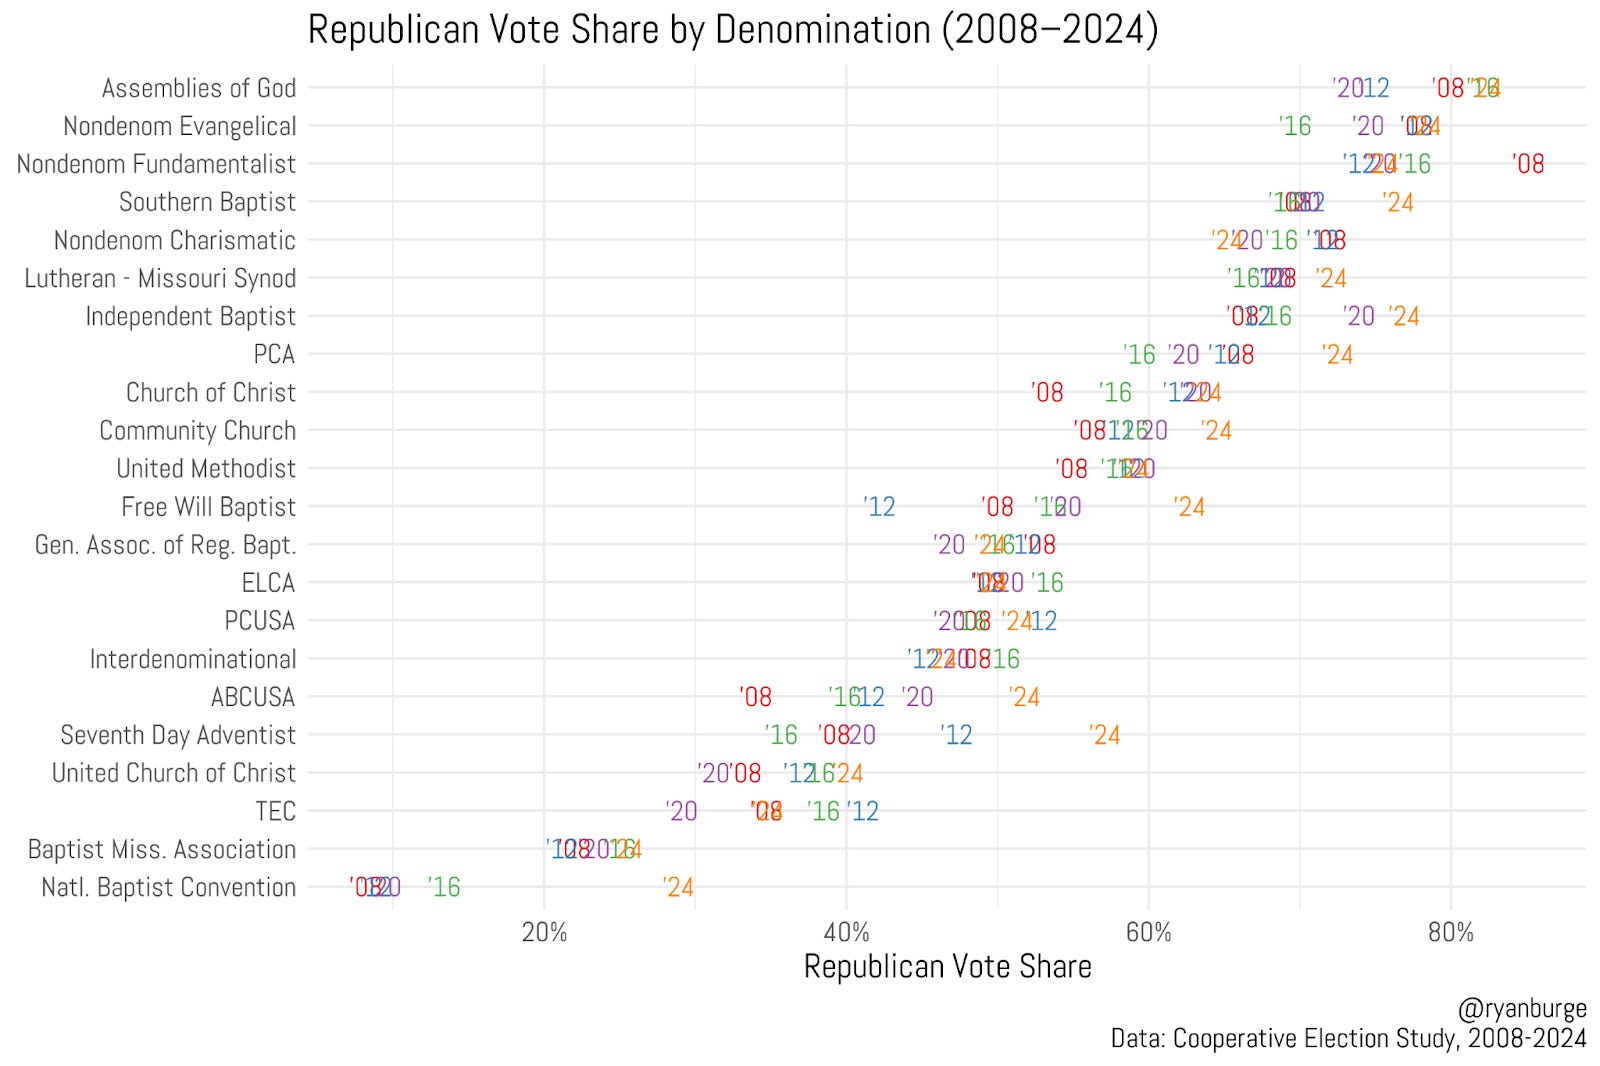
So, let’s get right to it, shall we? Here’s the Republican vote share in the last five presidential elections for twenty-two different Protestant traditions.