


Religious behavior is almost always assessed through one simple measure - frequency of religious attendance. And there’s a good reason for that: it’s included in basically every survey of American adults. So it’s easy to just copy and paste it from another long running instrument and know that it’s already gone through multiple rounds of critical assessment by other folks in the field. The problem with that, as you can probably guess, is that it’s overly reductive.
Some people are incredibly religiously devout, it’s just that they can’t make it to church services for a variety of reasons. They may have to work every weekend, or they have some type of disability that makes it difficult to leave the house. That’s why it’s always helpful to try and measure a concept like religious behavior through a number of ancillary measures. This is what makes the Pew Religious Landscape Survey so helpful. It circles around religious behavior with lots of different approaches.
After working with the survey a whole lot over the last couple of months, I have really come to believe that there are two dimensions of religious behavior that are included. One is a collection of five questions that seem to focus more on private activities like praying, saying grace before meals and reading holy scriptures or other devotional texts. The other is a set of three questions that are centered around the social side of religious behavior: attending religious services in person, going to a prayer group meeting, and talking about religion with someone from another faith background.
The table below should help orient us to both dimensions and give a good sense of the actual survey questions that appeared on the instrument.
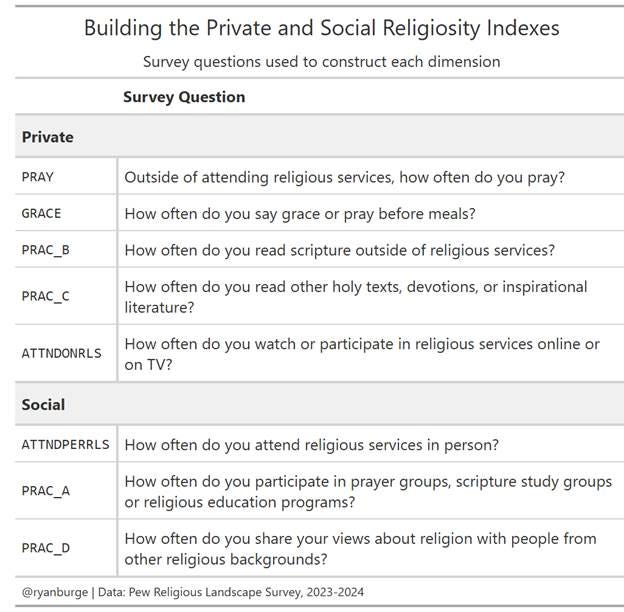
I think these are pretty defensible from a measurement perspective. None of the “private” acts require being in the same space as another individual. All three “social” acts necessitate being in the same physical space with another person. It’s really that simple of a dividing line.
Let me start my analysis of both of these dimensions by visualizing the distribution of values across both indexes in the full sample so you can get a sense of which ones are more or less prevalent among a typical American.
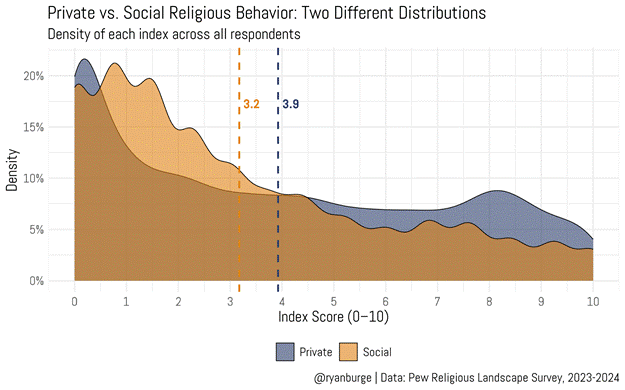
The distribution of values on the social dimension is clearly leaning toward the left side of the distribution. Huge shares of Americans can be found between 0 and 2 on this social behavior index. The average in the entire sample was just 3.2 out of 10. As you move further to the right hand side of the graph, it’s noticeable how far this dimension lags behind the private manifestations of religious behavior.
For the private religiosity index, the overall mean is undoubtedly higher – 3.9/10. A key reason for that is that despite the fact that there’s a pretty high peak in this distribution right around 0, it quickly drops off and lags behind the social distribution at the lower ends. As you move above 5, the blue line is consistently higher than the orange one. It’s undoubtedly the case that a larger share of Americans practice private acts of religious activity than public ones.
Let’s do a scatter plot now of all the religious traditions in the dataset so you can see how they line up on both private and social religiosity.
