

The Slow Grind of Change: What the 2024 GSS Tells Us About American Religion


This post has been unlocked through a generous grant from the Lilly Endowment for the Association of Religion Data Archives (ARDA). The graphs you see here use data that is publicly available for download and analysis through link(s) provided in the text below.
One of the most important cyclical events in my life as a data analyst of American religion is the semi-regular release of the General Social Survey. I feel like I’ve written ad nauseam about the GSS, but for those who are new to this little world, let me give you a very brief primer as to the importance of this single survey.
It’s been fielded on a regular basis since 1972 and the true value of the instrument lies in the fact that it asks the same questions in the same way using a very similar method in its administration. Which means that it provides really the only way for us to track religion in a methodologically rigorous way over such a long time horizon.
Have We Reached Peak None?

For those who are new to the party, let me explain how quantitative scholars of American religion make sense of the last fifty years of religious change.
I was more than pleased that the Association of Religion Data Archives had already managed to upload the 2024 General Social Survey to their website just a few weeks after the GSS was released. One of the unexpected benefits of this is that you can really see the whole codebook in a single, easy to navigate page. Otherwise you have to use the GSS’s website (which only allows for searching for variables individually) or download the PDF of the codebook. Which is really quite cumbersome at 600+ pages.
I’ve already run a full post about the current shifts in the RELTRAD variable, but I wanted to do a really tight “zoom in” on the changes in the religious composition of the GSS before the pandemic and then in the 2024 data. So, here’s how things have shifted since 2016.
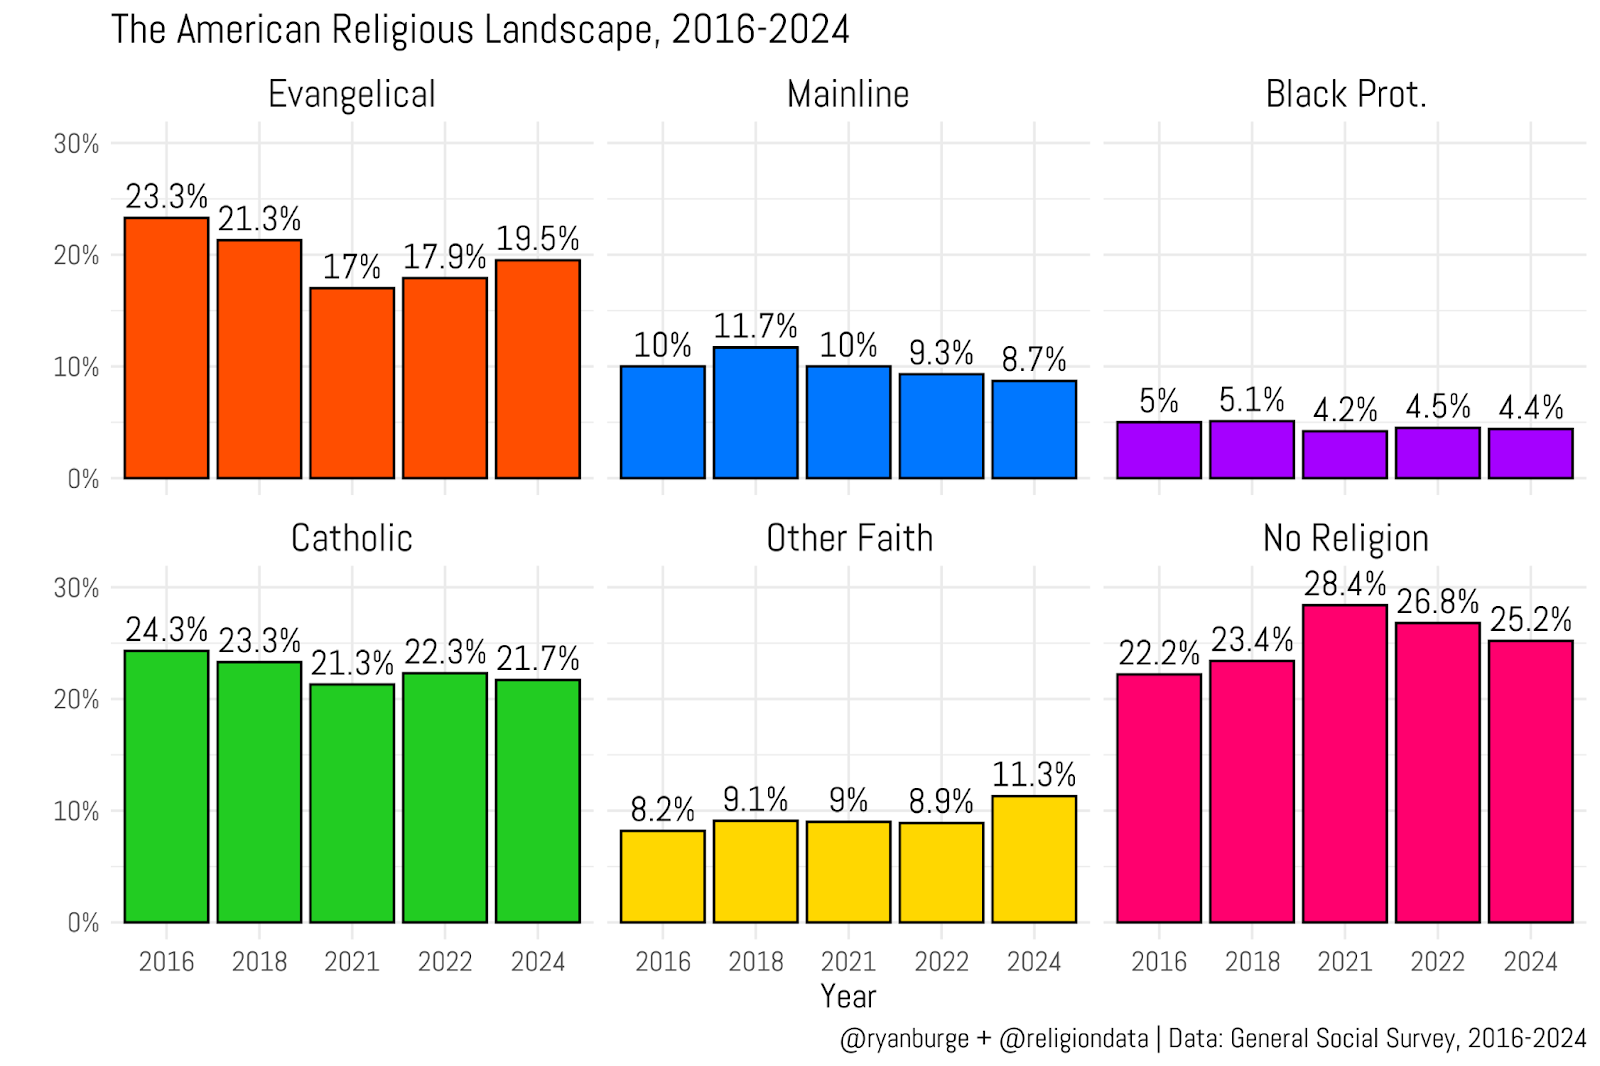
The one thing that this graph should convey to you all is a simple maxim that I repeat all the time - most societal changes happen at a very glacial pace. It’s incredibly rare to see any tradition move up or down by more than 1-2 percentage points from one year to another. Religion is just not that volatile. Most change happens through simple generational replacement, which is a very methodical process.
One thing you should note, though, is that 2021 is a very odd year for the GSS. You can see some really significant swings in these figures from 2018. For evangelicals, they dropped 4 percentage points. Meanwhile, the nones rose about the same share. One important factor to keep in mind with the 2021 data - the GSS had to pivot away from their typical face to face format.
I wrote about this over two years ago, by the way, in a post entitled: Did Religion Dramatically Lose Importance During the Pandemic?. The short answer is that, no - it’s just an artifact of changing methodology. This is a point that was illustrated beautifully by Landon Schnable, Sean Bock, and Michael Hout in a paper at the Sociology of Religion. I’ve actually spoken to numerous folks who do this kind of work and they just exclude the 2021 data from their work because it’s so problematic. Just something to keep in mind when looking at these results.
What I want to do is try and figure out if I can sort out what those religious shifts look like under the surface. Did younger folks start embracing evangelicalism? Do women start becoming non-religious in record numbers?
Let’s start with age and only focus on the two groups that seemed to move the most: evangelicals and the non-religious.
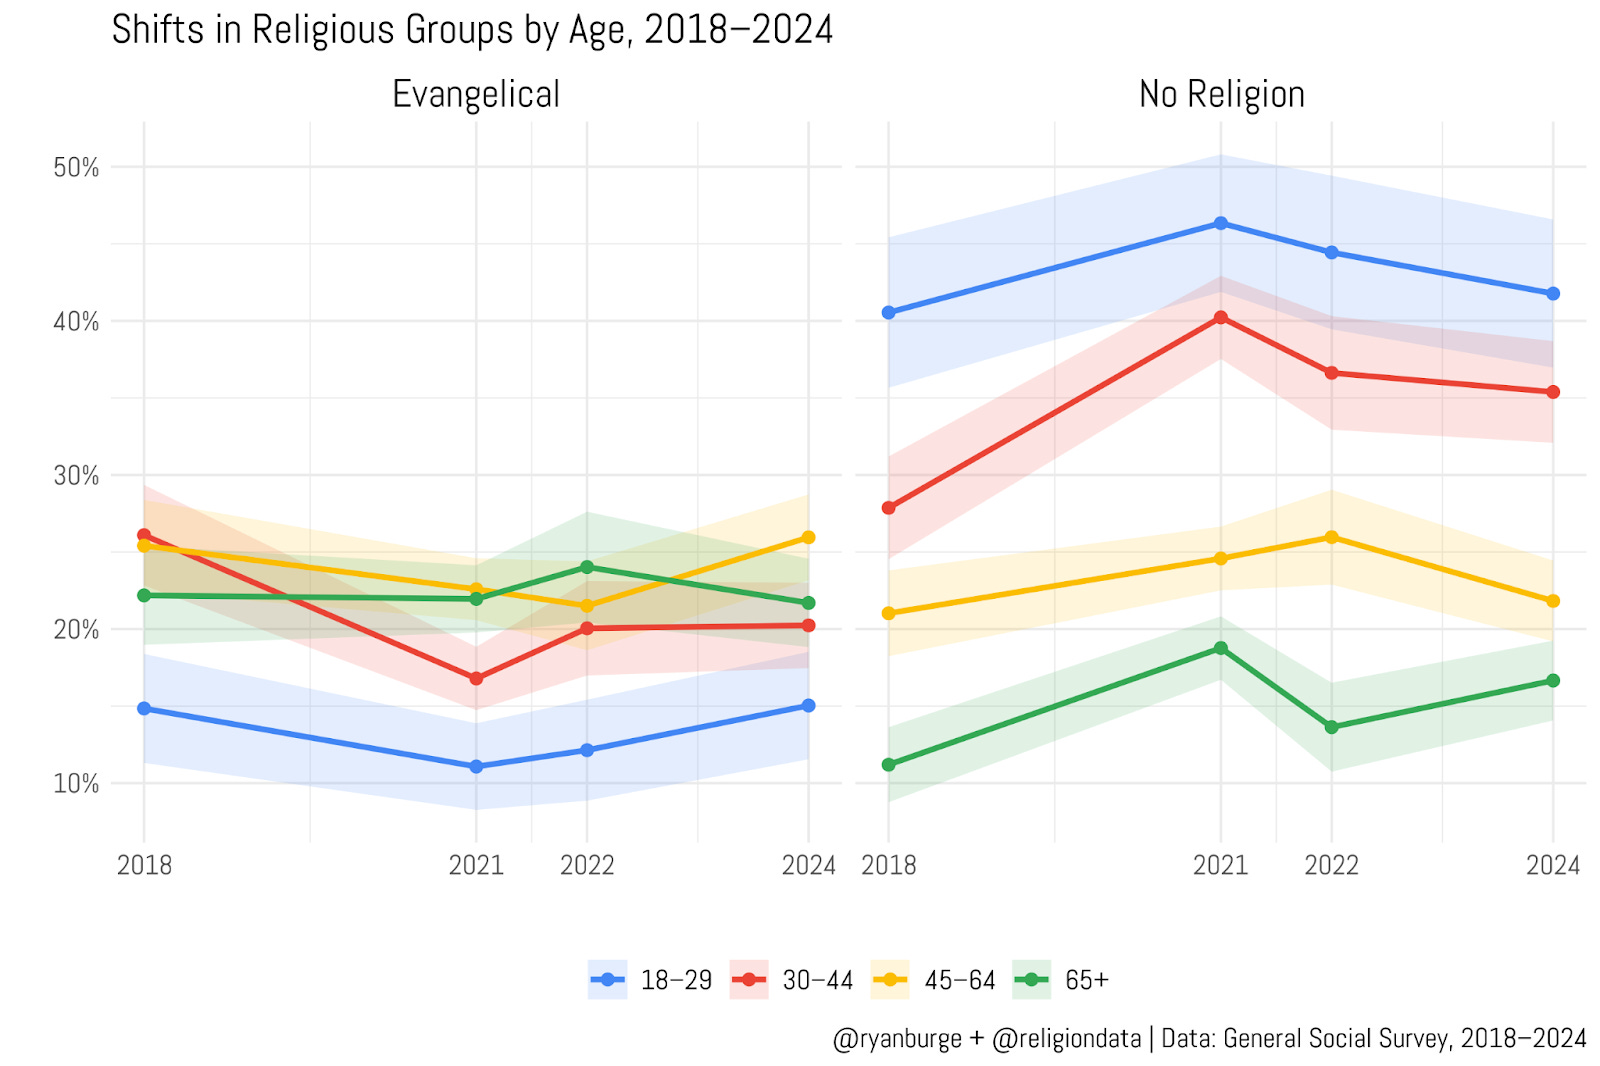
Note, that I have included 84% confidence intervals on this graph so you can get a sense of how much uncertainty we have in each of these estimates. (Basically, if the shaded parts of two lines overlap, this means that there may not be a significant difference between the values at this time point.) The GSS is not a huge instrument (2500-3000 folks), so we need to keep that in mind.
What I’m seeing here is quite a bit of wiggle but not really any discernible trends. For instance, the share of young adults who were evangelical in 2018 was 14.8%. It was 15% in 2024. The share who were nones went from 40.5% to 41.8%. There’s just nothing to write home about there.
That’s not the case for the 30-44 year old crowd, though. The evangelical numbers dropped big time during this six year window from 26% to 20% and the nones rose a commensurate amount (7.5 points). I think that this is THE takeaway from this analysis because the other age groups just show a whole lot of stasis between 2018 and 2024.
I know that folks also want to see this by generations and using all the religious traditions, but a word of caution - in the 2018 data there were less than 100 members of Generation Z. So, we need to consider these numbers with a dose of skepticism.
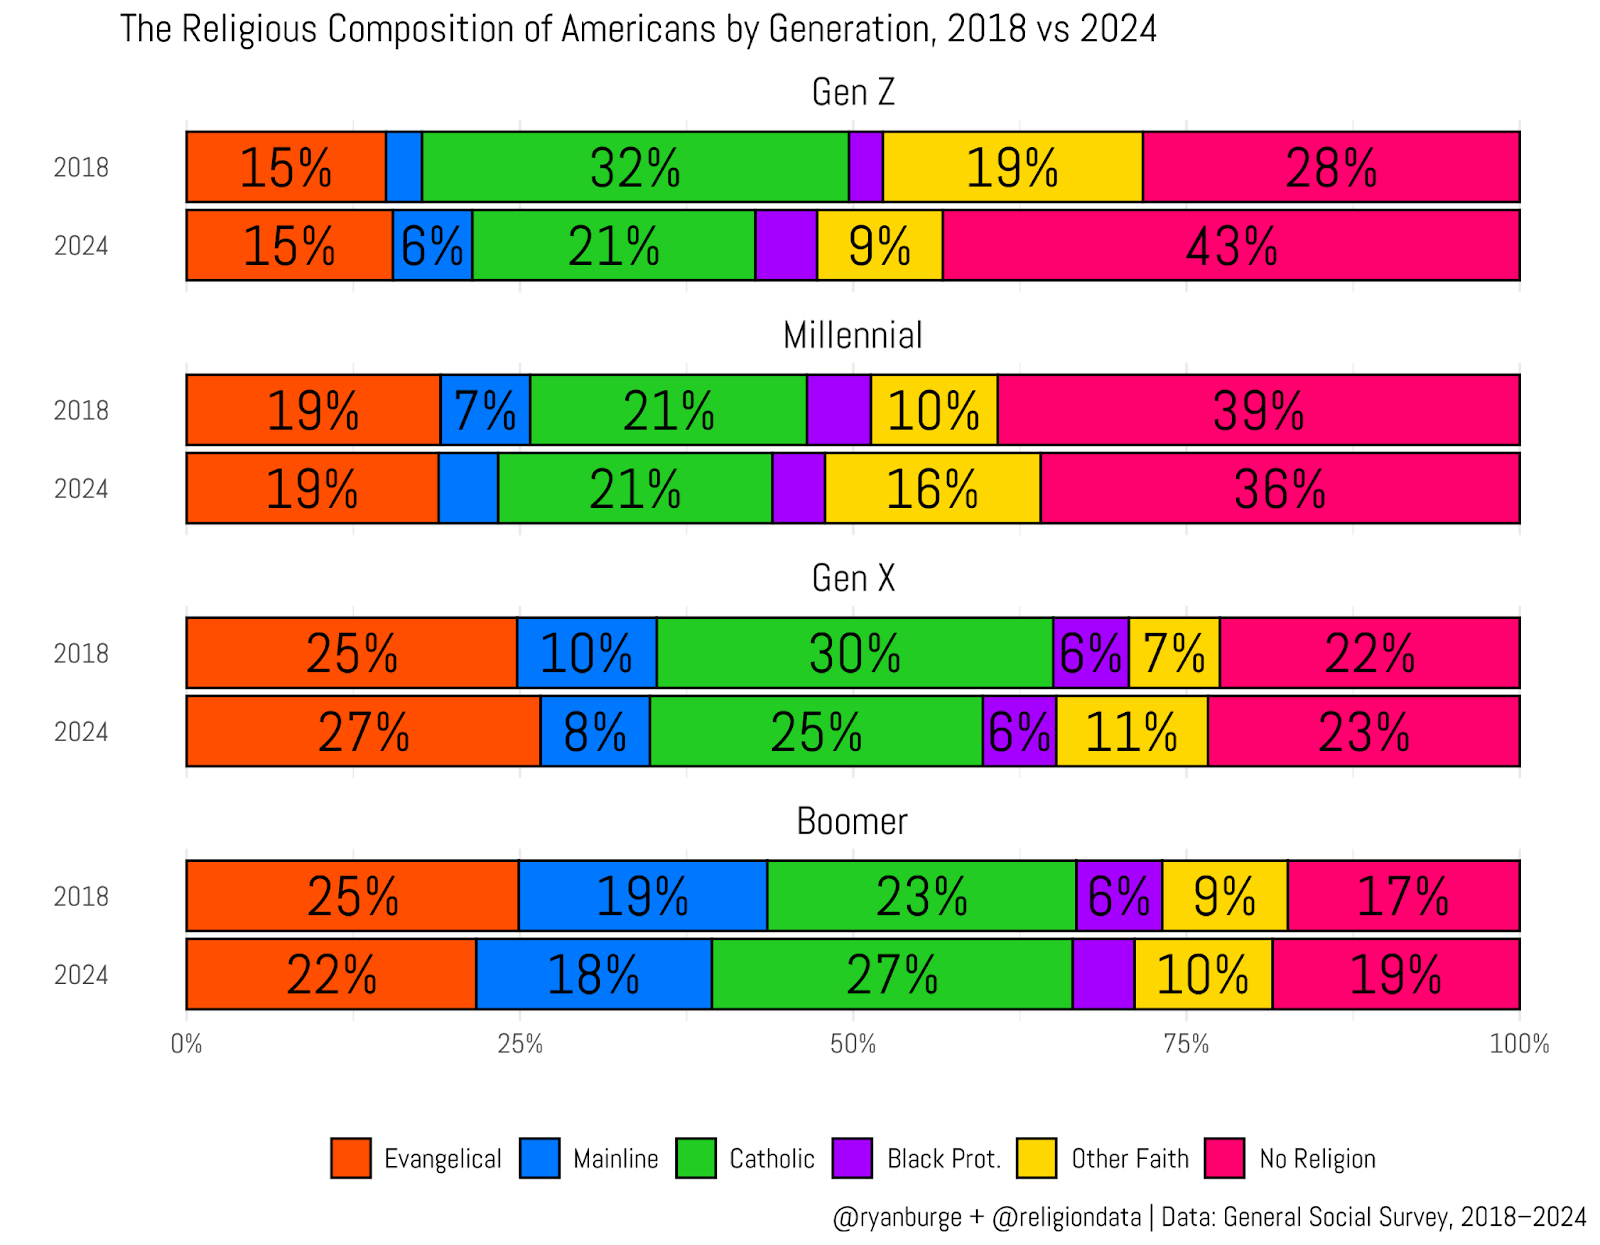
But, despite the fact that the Gen Z sample is only 96, we can definitely see a huge jump in the nones - going from 28% to 43%. That second number has been really consistent in the last couple of GSS waves, by the way - about 42-43% of Generation Z are non-religious. Where did the nones come from? Two groups: Catholics and those of other faith traditions. Both dropped by double digits.
What else can we see here? Well, we see that the “other faith” category, which is groups like Jews, Muslims, Hindus, etc. rose 6 points among Millennials and 4 points among Gen X. I really don’t know what to make of that, really. It’s certainly not something that I’ve been seeing in other datasets like the Pew Religious Landscape Survey.
I also do see a bit of shifting with Catholicism. Among Gen X, 30% were Catholic in the 2018 data. That dropped to 25% in the 2024 result. At the same time, Boomer Catholicism rose four points during that same time period. Again, I just don’t have an easy explanation for that. It may be just survey noise.
But let’s pivot away from just age related variables and also consider other possibilities like gender.
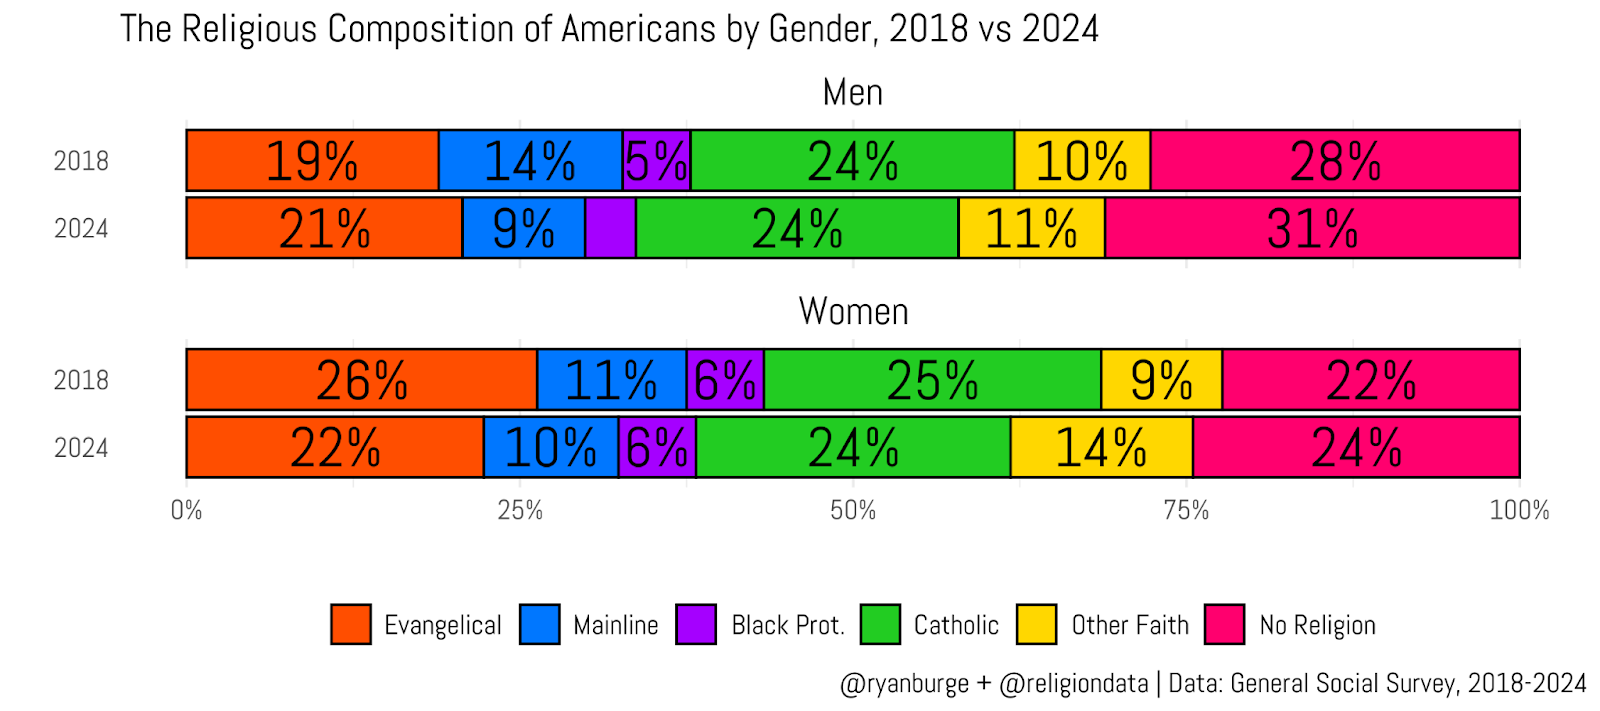
One thing that jumps out on my first look: mainline affiliation has dropped really significantly among men. In 2018, 14% of the sample were mainline. In 2024 it was only 9%. That’s part of the larger trend of mainline decline, but I do need to point out that it’s not really there among women. So, maybe the people leaving the local Episcopal and Methodist churches are men? I don’t know if I’ve seen any anecdotal evidence of that.
The other thing that is worth flagging is that fewer women identify as evangelical, going from 26% in 2018 to just 22% in 2024. Now, in terms of statistical significance, it’s right on the edge. So I can’t write this in stone but there’s certainly some suggestive data that women are not embracing evangelical traditions in large numbers now.
The nones have risen for both genders at about the same rate, but note that men are seven points more likely to be non-religious than women in the total dataset.
What about political ideology? I write about the God Gap all time, so is there any evidence here that religion is shifting more for liberals than conservatives?
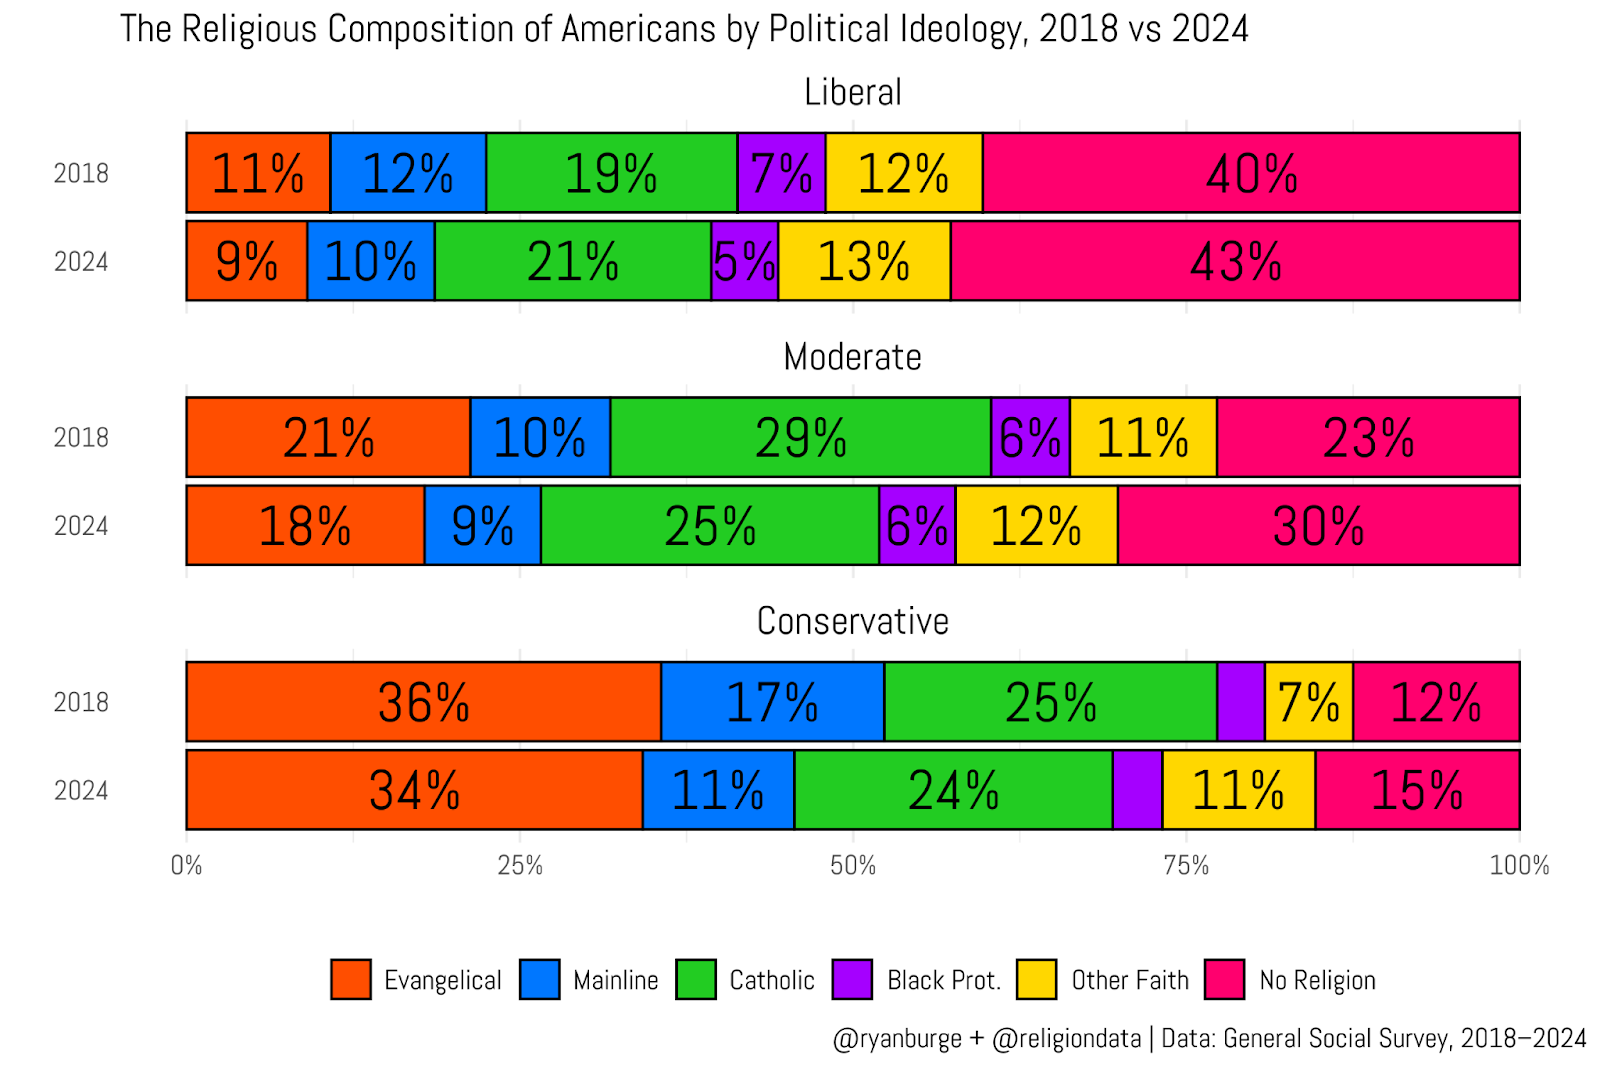
I do think it’s interesting that evangelicalism seems to be dropping across all three ideological groups - down 2 points among liberals and conservatives and 3 points among moderates. Something to keep an eye on there. But also I can’t help but highlight the fact that just 11% of conservatives are mainline Protestants now. That’s down six points since 2018. The drops in the other two groups are much less noteworthy.
But there’s one finding here that is one that needs to be carefully considered - the share of moderates who were non-religious was 23% in 2018. In 2024, 30% of moderates were nones. The jump in the nones among liberals and conservatives was just 3 points each. So, the bump in the nones over the last couple years is primarily coming from the middle, not the edges of the political spectrum.
There are a lot of moving parts, so let me consolidate my thoughts in a few bullet points.
The real movement is in middle adulthood, not youth. Everyone assumes Gen Z is driving religious change, but between 2018 and 2024 the biggest drop in evangelical identity came from the 30-to-44-year-old crowd — down about six points, while the nones rose almost the same amount. Younger and older Americans barely budged.
Gen Z’s story is consistency, not collapse. They were highly secular in 2018 and they still are: roughly four in ten say they have no religion. That’s not new decline, that’s the new baseline.
Gender divides (in the full sample) are holding and maybe widening. Mainline affiliation among men fell sharply, while women’s numbers held steady. Evangelical identification among women slipped a bit, too. The gap between men’s and women’s religiosity now runs about seven points.
The middle is hollowing out politically and religiously. Conservatives remain overwhelmingly Christian and liberals are heavily nonreligious, but the biggest jump in “nones” came from moderates, up seven points since 2018. The God Gap isn’t just right vs. left anymore; it’s actually the right versus everyone else.
In other words, there are a lot of shifting pieces in the American religious landscape. Things like age, gender, ideology and also unexplored factors like socioeconomic status and race can play a huge role in all of this. Sounds like I have a lot more work to do.
Code for this post can be found here.
Ryan P. Burge is a professor of practice at the Danforth Center on Religion and Politics at Washington University.

Excellent, excellent, excellent. These conclusions speak back to a lot of falsehoods perpetuated among regular churchgoers.
Also, the decline in moderate presence in worship may correspond with some small-scale studies that find more people are equating political ideology with congregational "theology," though I'd argue that's a false definition. Most accepted Christian theology doesn't apply well to any current ideology.
Likewise, the shift away from evangelicalism by women is something that's been noticed in small studies since at least the 1980s. Unfortunately, most become non-affiliated, the majority don't look for a healthier spiritual community.
I'm a little confused at how graphs 2 and 3 relate. Aren't 30-45 year olds millennials? If so, why does one show a 6-point swing but the other shows 0?