The Religiosity of High School Seniors, 1976-2022
And what does GPA have to do with religiosity?

There’s this concept in venture capital called a “moat.” The basic idea is straightforward: if a founder approaches a VC firm seeking investment, they need to answer a simple question, "Why can't someone else come in and quickly replicate what you are doing?" Think of a moat around a medieval castle. It's significantly harder to breach the walls when one must traverse a body of water first.
Data analysis is kind of like that, honestly. There’s a whole class of data scientists called data engineers. Their primary responsibility is to store, classify, and organize data in such a way that it's easily accessible to others in the data science unit for analysis. It's yeoman's work, and the extensive hours that go into these very tedious processes often go unseen. However, they are absolutely essential for refining algorithms.
What you don't see in these posts about Graphs on Religion are the hundreds of hours I have spent digging my moat over the last few years. I have merged disparate data files and stitched them together through hundreds of lines of code. I've written small functions for myself that halve the time this kind of work used to take. I am constantly seeking ways to improve my workflow and expedite these processes.
How Has Religion Changed Among High School Seniors?

I bet that when I look at a graph, I'm searching for something different from the average person. For me, it’s always a peek at the bottom corners - trying to find any information about the source of the data that was used to generate the visualization.
Well, a few weeks ago I dipped my toe into some data that I hadn’t used before. Which is a huge pain in the butt, by the way. It’s called Monitoring the Future. I just grabbed two datasets from the front page of results - the oldest one (1995) and the newest one (2022). If that post did well, I wanted to do the analysis on the entire time series which runs from 1975 through 2022.
It took so much work to get the data into one single file that contained every year of the survey. Each wave of the survey was in it’s own zip file. I had to download each, extract each and then pull the relevant data files into a different folder. I had to ask ChatGPT about a dozen questions when writing a shell script to get it all accomplished. You can see that here, if you are interested.
All that to say, I bet I put in five times as much work behind the scenes to write this post as I did to actually make the calculations and generate the graphs.
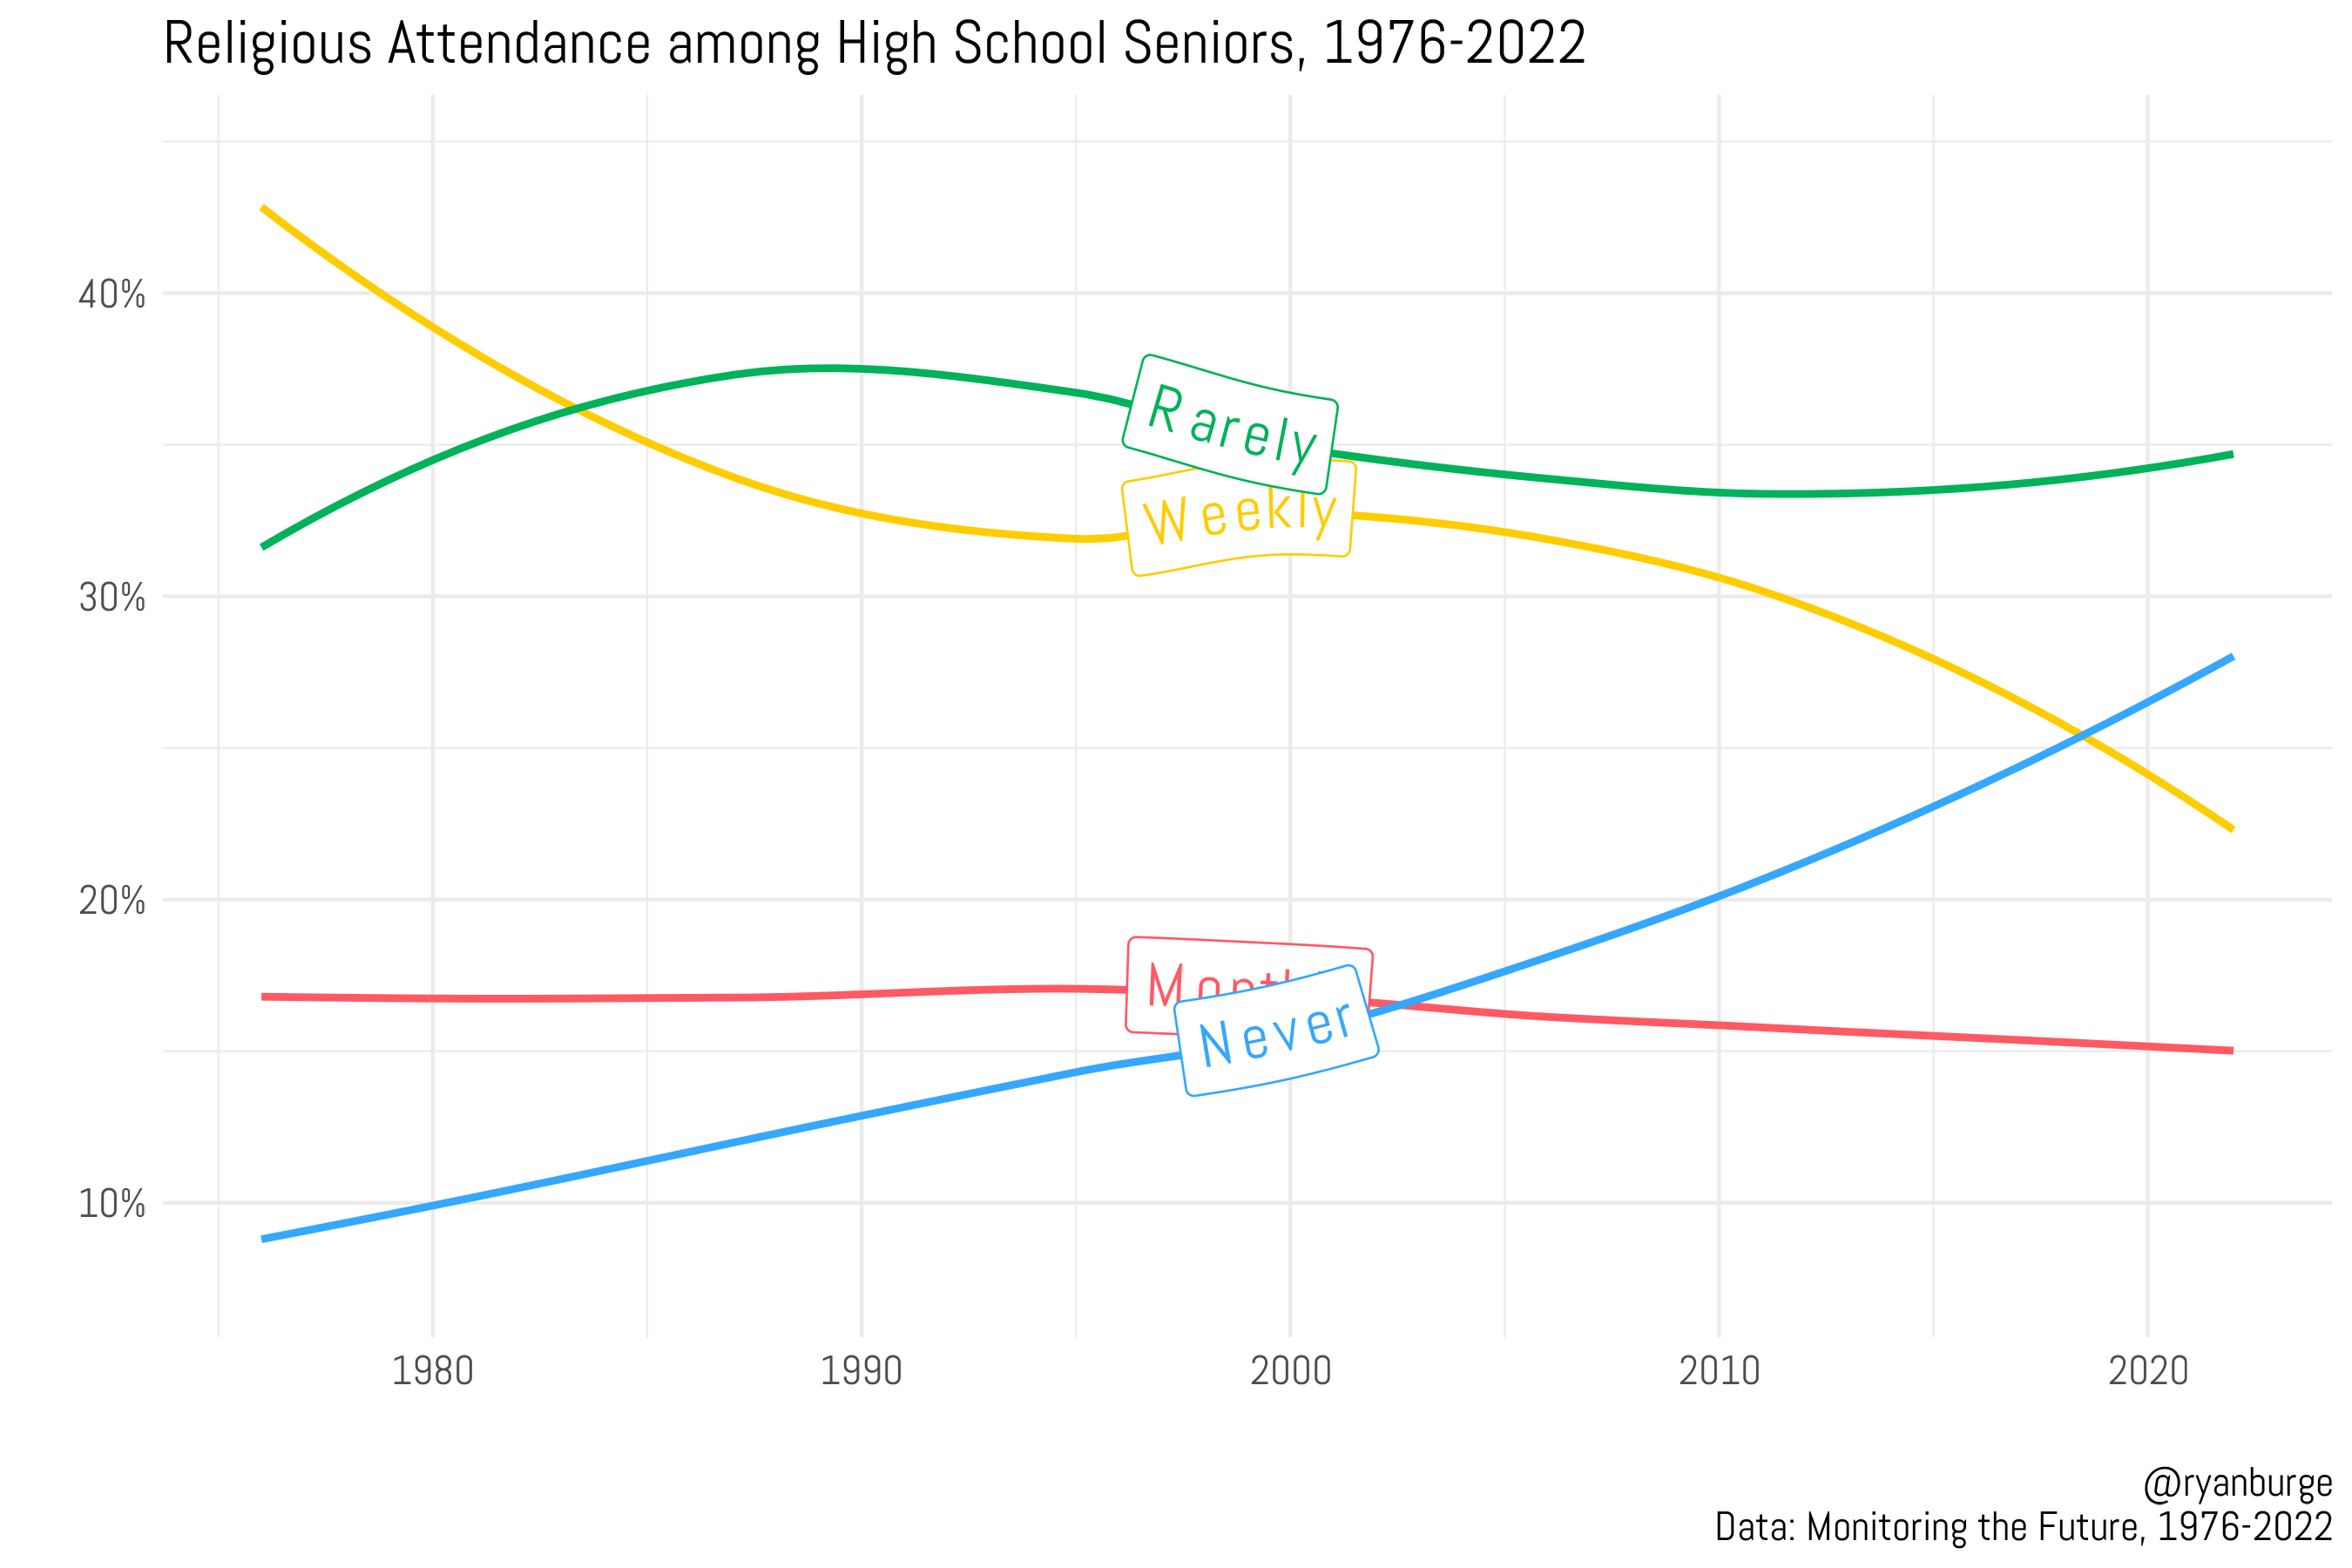
But the end result was more than worth it. I can track the religiosity of high school seniors from 1976 through 2022. (And I have a number of additional variables that will end up in other posts, too.)
So, here it is - the religious attendance of twelfth graders since 1976.