


Back in the very earliest days of my newsletter, I wrote a post with this pretty terrible title – “What Does Denominational Decline Look Like?” The reason that the title is not very good is because it didn’t directly specify the denomination that I was examining. It was the Presbyterian Church (USA). That post may have been the most important one in the development of my style and approach to writing because it garnered a ton of attention and led to my first spate of paid subscribers. I knew I was on to something.
From there, it’s really become one of the “tentpoles” of this newsletter. I really do love writing them. I can always find something interesting or unexplored while wading through a whole bunch of spreadsheets and glossy PDF files. And what I’ve found is that people just aren’t getting this information from anywhere else. I’ve covered all kinds of denominations and traditions – Episcopalians, Southern Baptists, even Unitarians.
I’ve built a simple little website that provides a directory of lots of these reports that you can access by clicking this link. Just know that almost all of them are behind the paywall because they are part of my ever growing archive of “back issues” that now is at least 300 total articles.
But I thought that this would be a fine time to revisit my friends in the Presbyterian Church (USA). My friend and PCUSA pastor, Josh Erickson, emailed me a link to the newest set of numbers that we have from the denomination. And I already have a couple of spreadsheets on my hard drive, so there’s a lot to dig into when it comes to the future of the PCUSA
Here’s what I know: The age profile of this Protestant tradition, the shrinking pipeline of new clergy, the widening gap between churches and members, and the arithmetic of births, deaths, and new members all point to the same conclusion. The challenge facing the PCUSA isn’t simply that it has gotten smaller. It’s that the demographic forces shaping its future are becoming increasingly difficult to reverse.
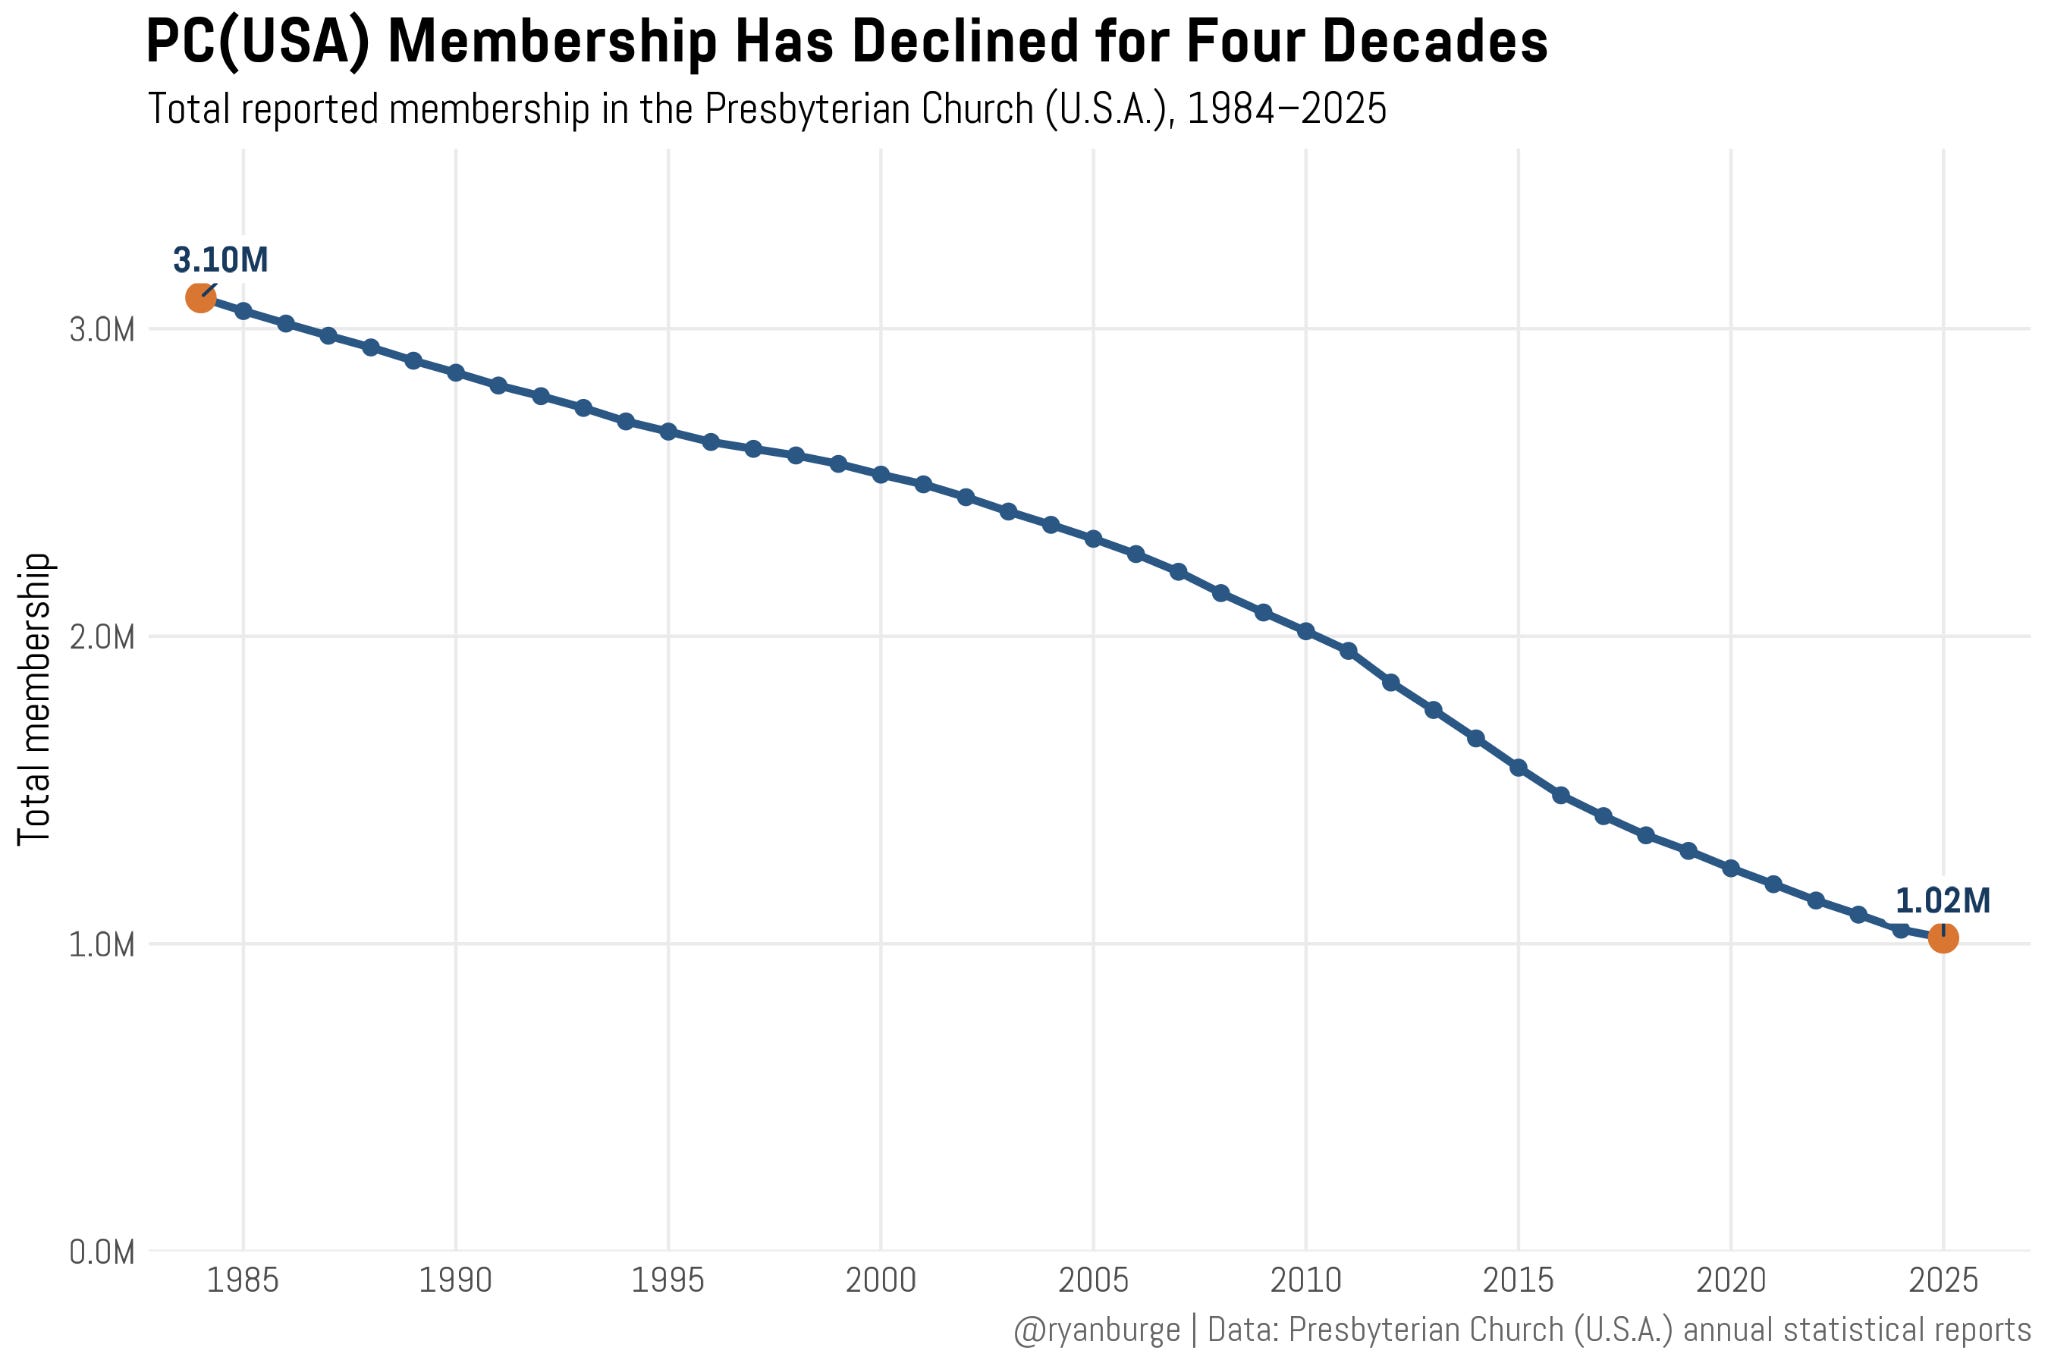
Anyone who has hung around these parts for the last couple of years knows how this report is going to go – the mainline is in trouble and the PCUSA falls right in line with the other Six Sisters in the tradition. Back in 1984, the denomination boasted 3.1 million members. That’s really solid and would only put them about a million behind the current state of the United Methodist Church. But, alas, that was certainly the high-water mark for the PCUSA.
The decline was relatively slow and steady for two decades. A typical year would see a decline that was often around 1%, sometimes even less than that. But a one-percentage-point dip is really deceptive. It doesn’t feel like much from one year to the next. Except those small declines really start to add up to big drops when compounded over two decades. By the time the denomination reached 2010, it was down to almost exactly two million members.
Then the decline really started accelerating from that point forward. In almost every year beyond 2010, the year-over-year drop has been in the five-percentage-point range. That’s impossible to deny. In numeric terms, that’s losing nearly 100,000 folks on an annual basis. You don’t feel a one-point drop, but you can’t ignore a five-point decline.
And now the denomination is at 1,019,003 members. The drop last year was much less than usual – just 2.5 points. The smallest since 2007. But next year, it will certainly be below 1 million members. In percentage terms, the total decline is 67%. Said another way, for every three members on the rolls back in 1985, there is one member today.
In that early post, I built a really simple projection model based on a very naive assumption that I arrived at when looking at the trends for a while – if you just assumed a 4% decline in membership, that would get you really close to the actual numbers over a long period of time. Let’s see if that still holds up.
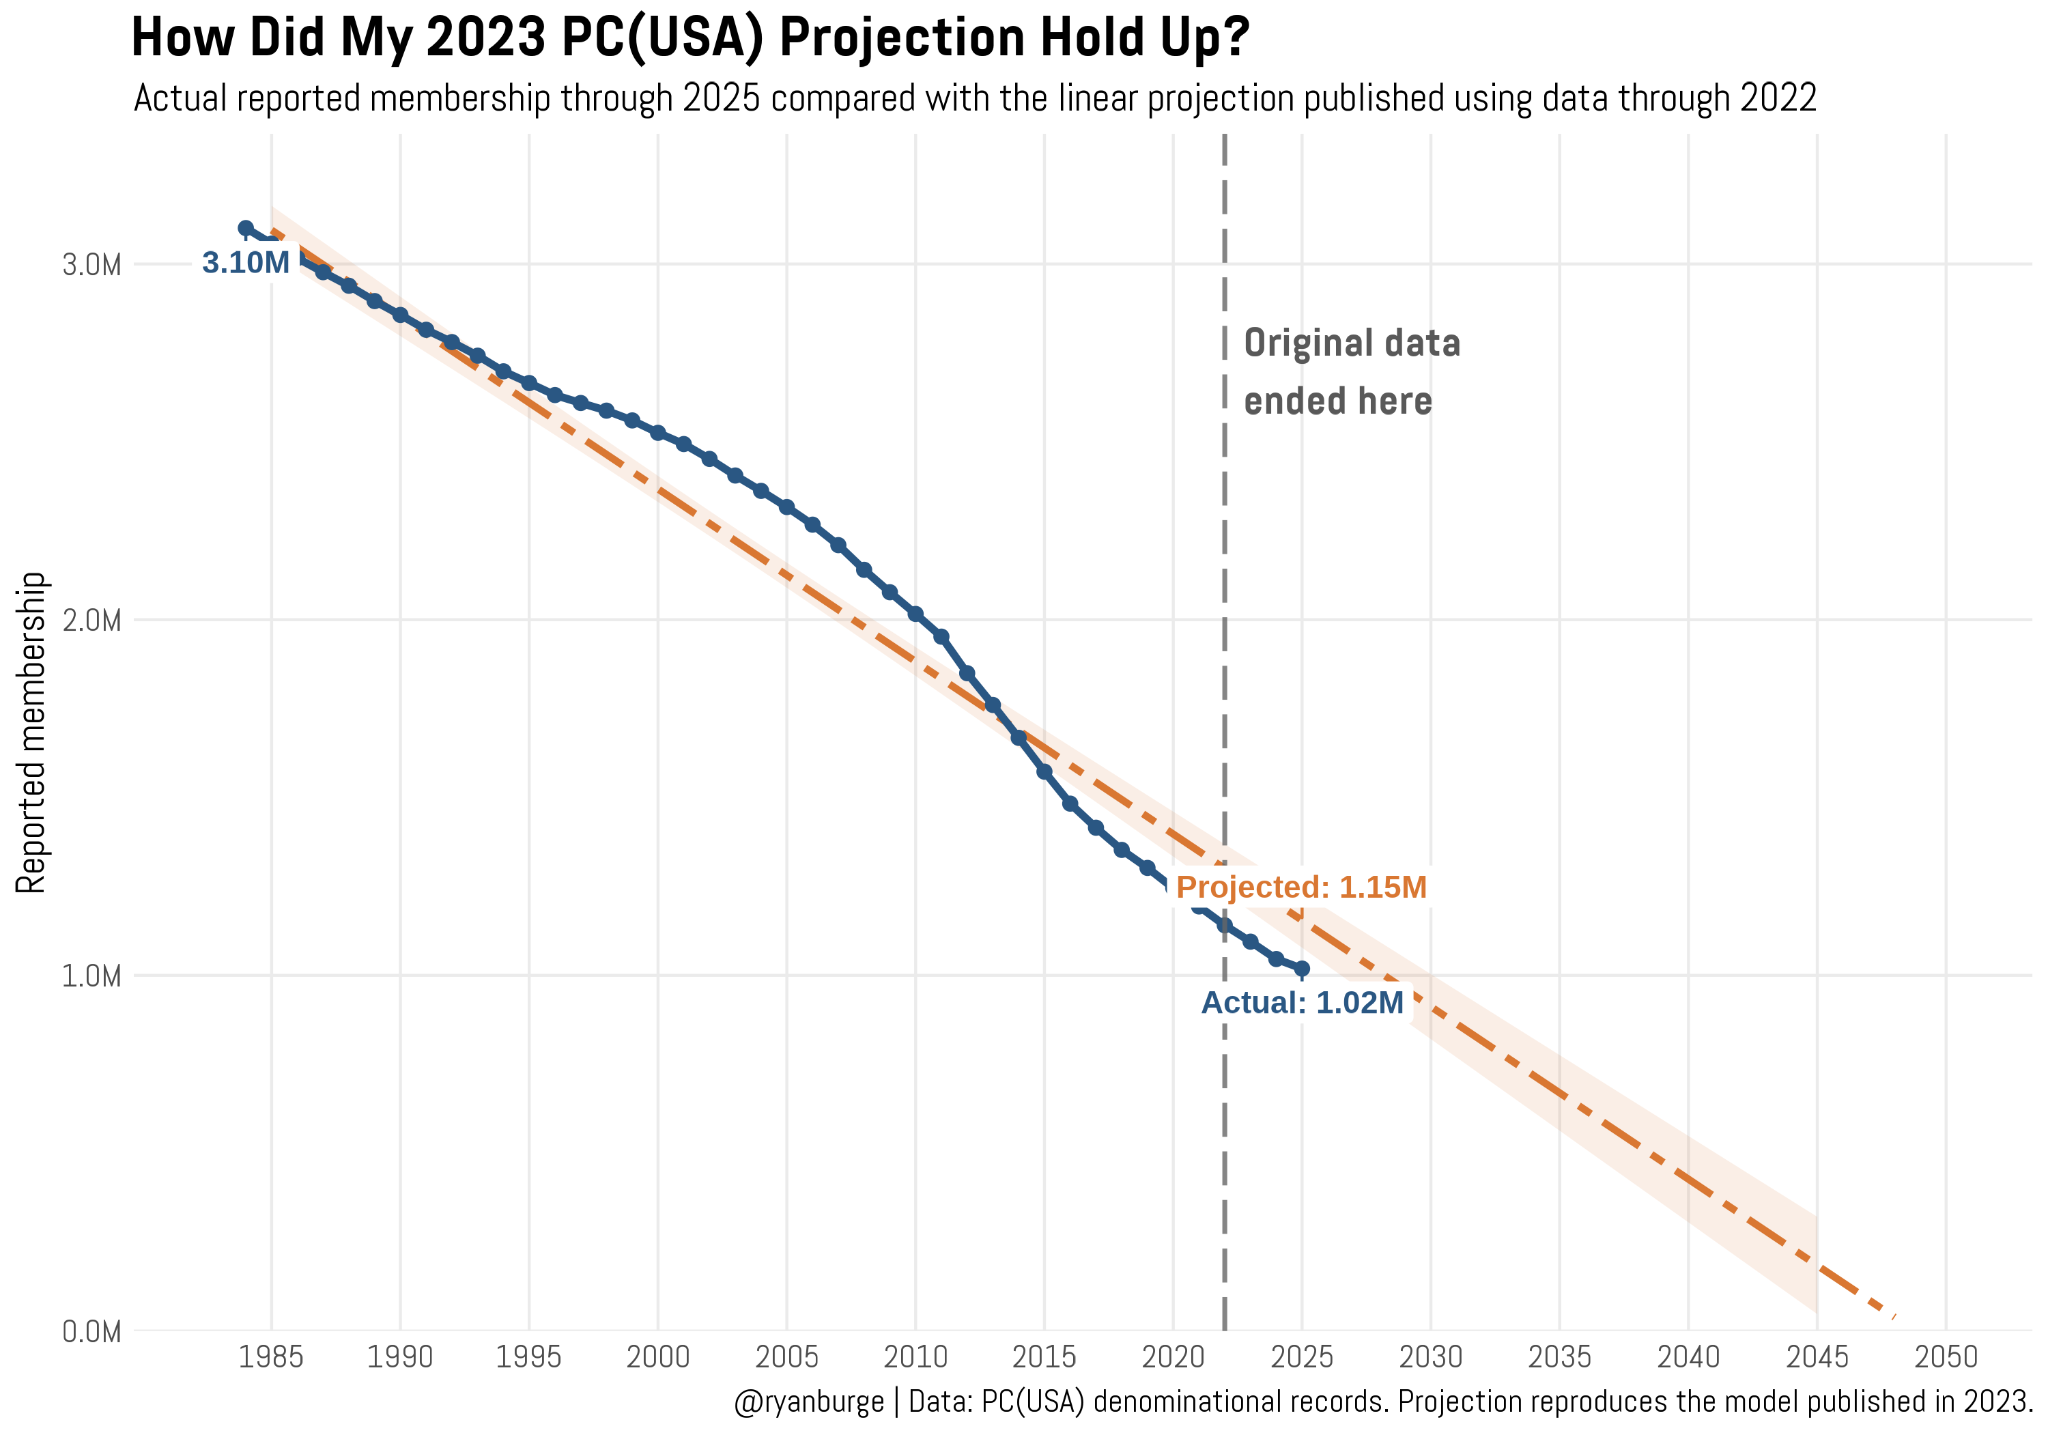
I’m really surprised to see how well that super basic projection model performs against the membership data from the PCUSA. You can see from the graph that there was a period of time between 1995 and 2010 when my assumption was too pessimistic. I projected fewer members than were actually on the rolls of the denomination. But by 2013 or so, my projection line collided with the actual data again because losses really began to pick up during this time period.
What’s interesting now is that my guess of 4% annual declines is actually too optimistic. It guessed that the denomination would have about 1.15M members in 2025. The actual number is 1.02M. My projection was about 10% too high. And I’m kind of convinced that it will actually continue to deviate more from the actual numbers each year because of some demographic obstacles I see in the data which I will discuss later.
How have the total number of congregations changed as membership has plummeted? That’s in the left panel below.