Religion in 2022 Compared to 2020
Sometimes the data doesn't match expectations.
Anyone who went through graduate school in political science is going to understand this story progression pretty well.
You come into your studies knowing very little of the academic literature surrounding political science. You quickly read a whole bunch of stuff and most of it involves polling data (especially if you are an Americanist). You go through this “dark night of the soul” period when you start reading stuff like John Zaller about how surveys are just really weird and can provide inconsistent results. We all began to ask a ton of questions in seminars about the validity of any survey data and it evolved into a boring (and often unhelpful) debate about epistemology.
Then, I think many of us came around to the same conclusion. Survey data is flawed. Sometimes really flawed. But what is the alternative? There isn’t a good one. So, let’s just carry on with the data that we have. And, by the way, there’s always one person per cohort who just can’t let this argument die and keeps bringing it up in third year classes and he (or she) usually gets dismissed pretty quickly in service of debating the actual findings from quantitative papers.
For the record, I was not the kind of person to keep bringing up the same debates about survey reliability in class. I just wanted to get through the program and earn my degree. But that doesn’t mean that I just tried to forget about all those methodological debates, though.
I’ve published a number of papers on measurement in religion, including:
The consequences of response options: Including both “Protestant” and “Christian” on surveys
How Many “Nones” Are There? Explaining the Discrepancies in Survey Estimates
Falling through the Cracks: Dealing with the Problem of the Unclassifieds in RELTRAD
Plus a bunch of other stuff on this Substack, including a piece just a few weeks ago about the weird data from the 2023 Cooperative Election Study.
I just always want to kick the tires of religion data. Take a look under the hood. And I had a great chance to learn from some new data released by the team who runs the Cooperative Election Study. They surveyed 61,000 folks in the Fall of 2020. Then, they recontacted 11,000 of them in the Fall of 2022. Guess what that means?
I can tell you how much religion changed at the individual level using a really big dataset. That’s awesome. Let’s get to it.
Here’s the share of each religious “tradition” that gave the same response option in both 2020 and 2022.
Latter-day Saints are the big winners here - 94% were retained by 2022. But let’s be clear, there weren’t a lot of them in the recontact portion of the data, just 119. Lots of large traditions have retention rates that run above 90% including Catholics and Protestants, though. Overall retention in the entire sample was 86%. Or, another way to look at this is 14% of folks gave a different answer in Round 2 of this data compared to Round 1. That’s a fair amount of religious switching in a short window of time.
Who switched the most? The nones, really. About 23% of people who described their religion as “nothing in particular” in 2020 did not do the same in 2022. Agnostics were even higher - about a third of them were no longer agnostics when asked to fill out a very similar survey in 2022.
I know what you are all thinking right now - well, where did all those non-religious Americans end up if switching was so high among them? Well, let me show you that. The graphs below exclude any none who chose the same response option across both surveys. This is only non-religious people who made a different choice in 2022 compared to 2020.
Among the nothing in particulars who chose something different - a big chunk of them became Protestants (40%). The second most popular choice was agnostic at 32% followed by atheists at 15%. All told, about 49% of nothing in particulars became Protestant or Catholic while 47% chose another non-religious option.
The same wasn’t true for agnostics or atheists, though. If they chose something different, the most likely landing spot was clearly “nothing in particular.” Over two-thirds of agnostic switchers became nothing in particular. It was 55% of atheists who switched. In total, 88% of agnostic switchers ended up as another none category compared to 81% of atheists. About 9% of agnostics who changed their mind became Catholic or Protestant in 2022, it was 12% of atheists.
But you have to put these numbers in context. There were about 11,000 respondents in this sample.
How many were atheists in 2020 and Protestants in 2022? Six.
How many were agnostics in 2020 and Protestants in 2022? Eighteen.
There just isn’t a huge pipeline of atheists and agnostics to Protestant Christianity.
What about Protestants and Catholics who switched things up? Where did they land?
Well, for Protestants who weren’t Protestants two years later, almost all of them became nothing in particular (81%). About ten percent of them became atheists or agnostics. In numerical terms the number of people who went from Protestant to nothing in particular was 210. Nine became atheists, thirty-three became nothing in particular. Again, this isn’t a whole bunch of people going from one side of the religious landscape to the other.
For Catholics, it’s much more of a mixed bag. Clearly, nothing in particular is the most popular choice at 55%. Sixteen percent of Catholic switchers became Protestant (N = 26), while 14% became agnostics (N = 21). Although these are pretty small sample sizes, especially when you get to these subgroups, it’s pretty clear that when Catholics leave they don’t do it in the same way that Protestants do.
What about this burning question - how many people change their evangelical self-identification between 2020 and 2022? Well, here’s the answer:
About two-thirds of the sample answered the same way both times - they weren’t evangelicals. In contrast, nearly three in ten respondents said that they were evangelical in both 2020 and 2022. That leaves about six percent of folks who gave an inconsistent answer to this question. Four percent of people were not evangelical in 2020 but then they changed their answer and became evangelical when asked in 2022. About 2% of the sample did the opposite - they went from evangelical to not evangelical during that time period.
Trust me, I tried to figure out what lead to this switching behavior and came up empty - you can see the ragged edges of that attempt in the code I link at the bottom.
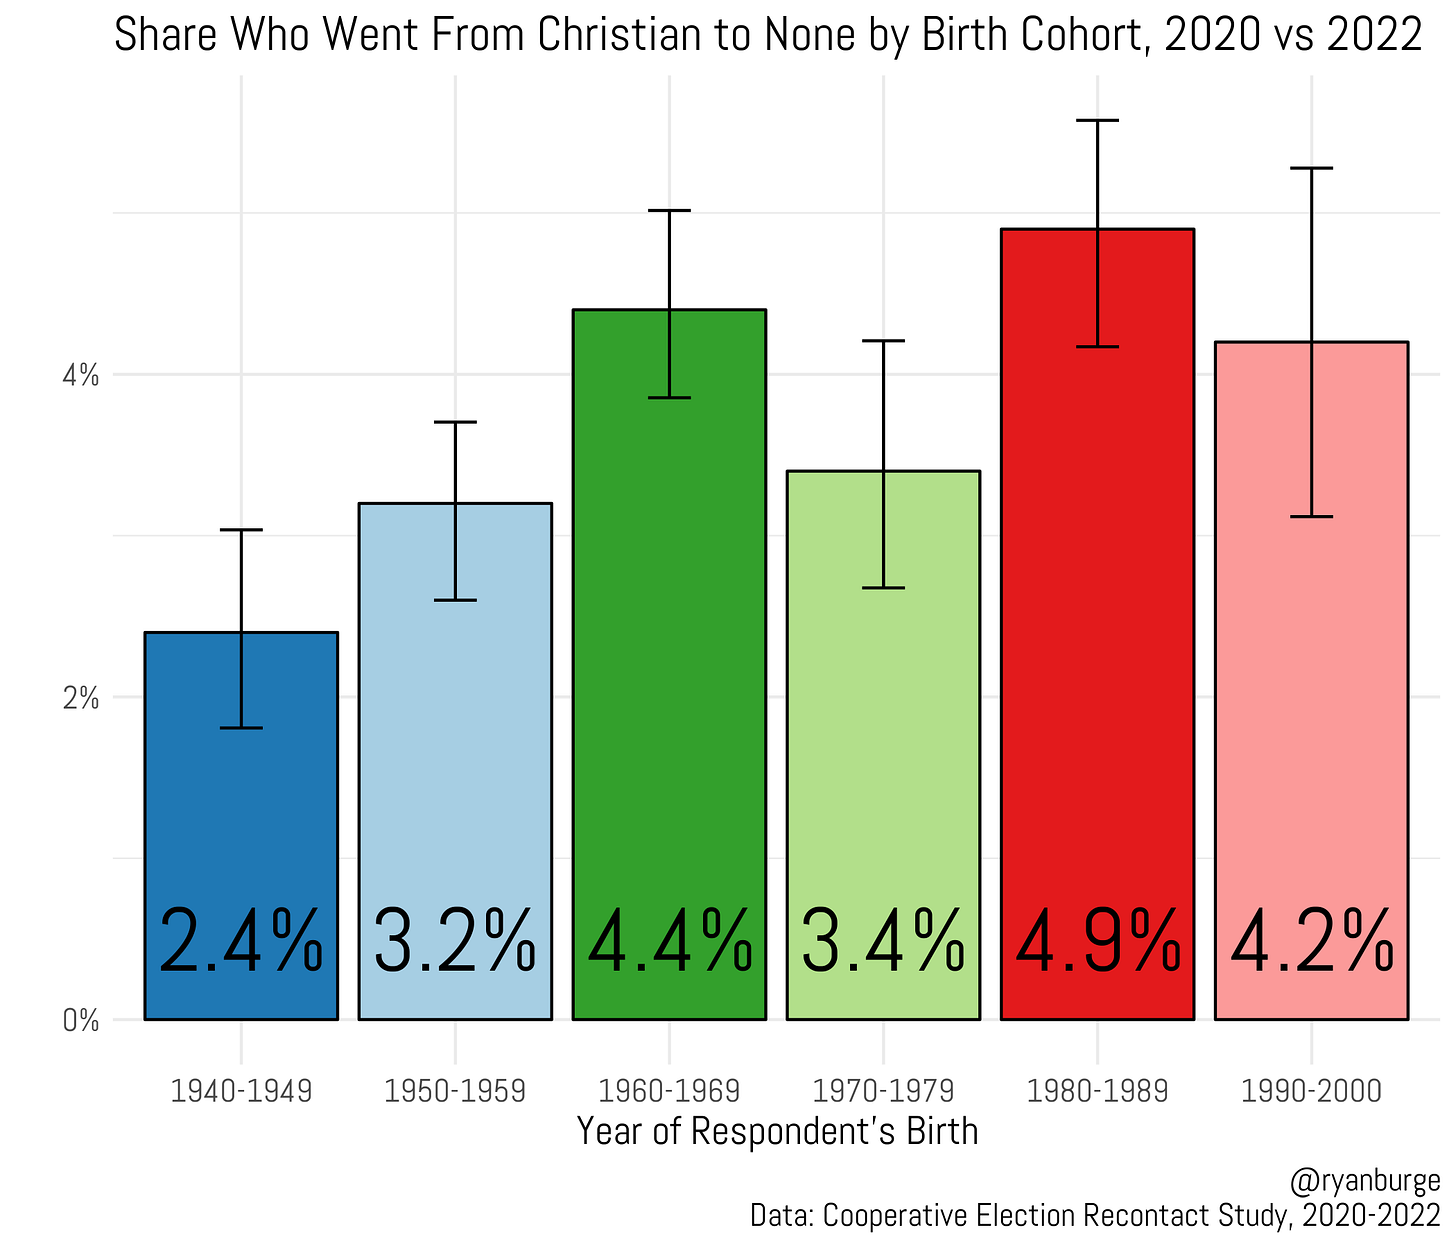
Let me end this post by talking about burning questions that I always get asked when I do talks at churches and with denominational folks. How many people are jumping from a Christian tradition to the non-religious label? And, how many people are doing the opposite (none —> Christian)? Because the data is not huge, I can only break it down by decade of the respondent’s birth. Here’s what I get when looking at Christian to None conversion between 2020 and 2022.
Let’s just say that even when binning this into ten year birth windows, the margin of error is still big enough that we don’t have a ton of confidence in these results. That’s compounded by the fact that the Christian to None pathway is just not that big. I do think it’s fair to say that younger adults may be slightly more likely to leave the world of Christianity and become non-religious, but it’s just hard to know that for sure. In the entire sample, 4% of folks went from Christian in 2020 to non-religious by 2022.
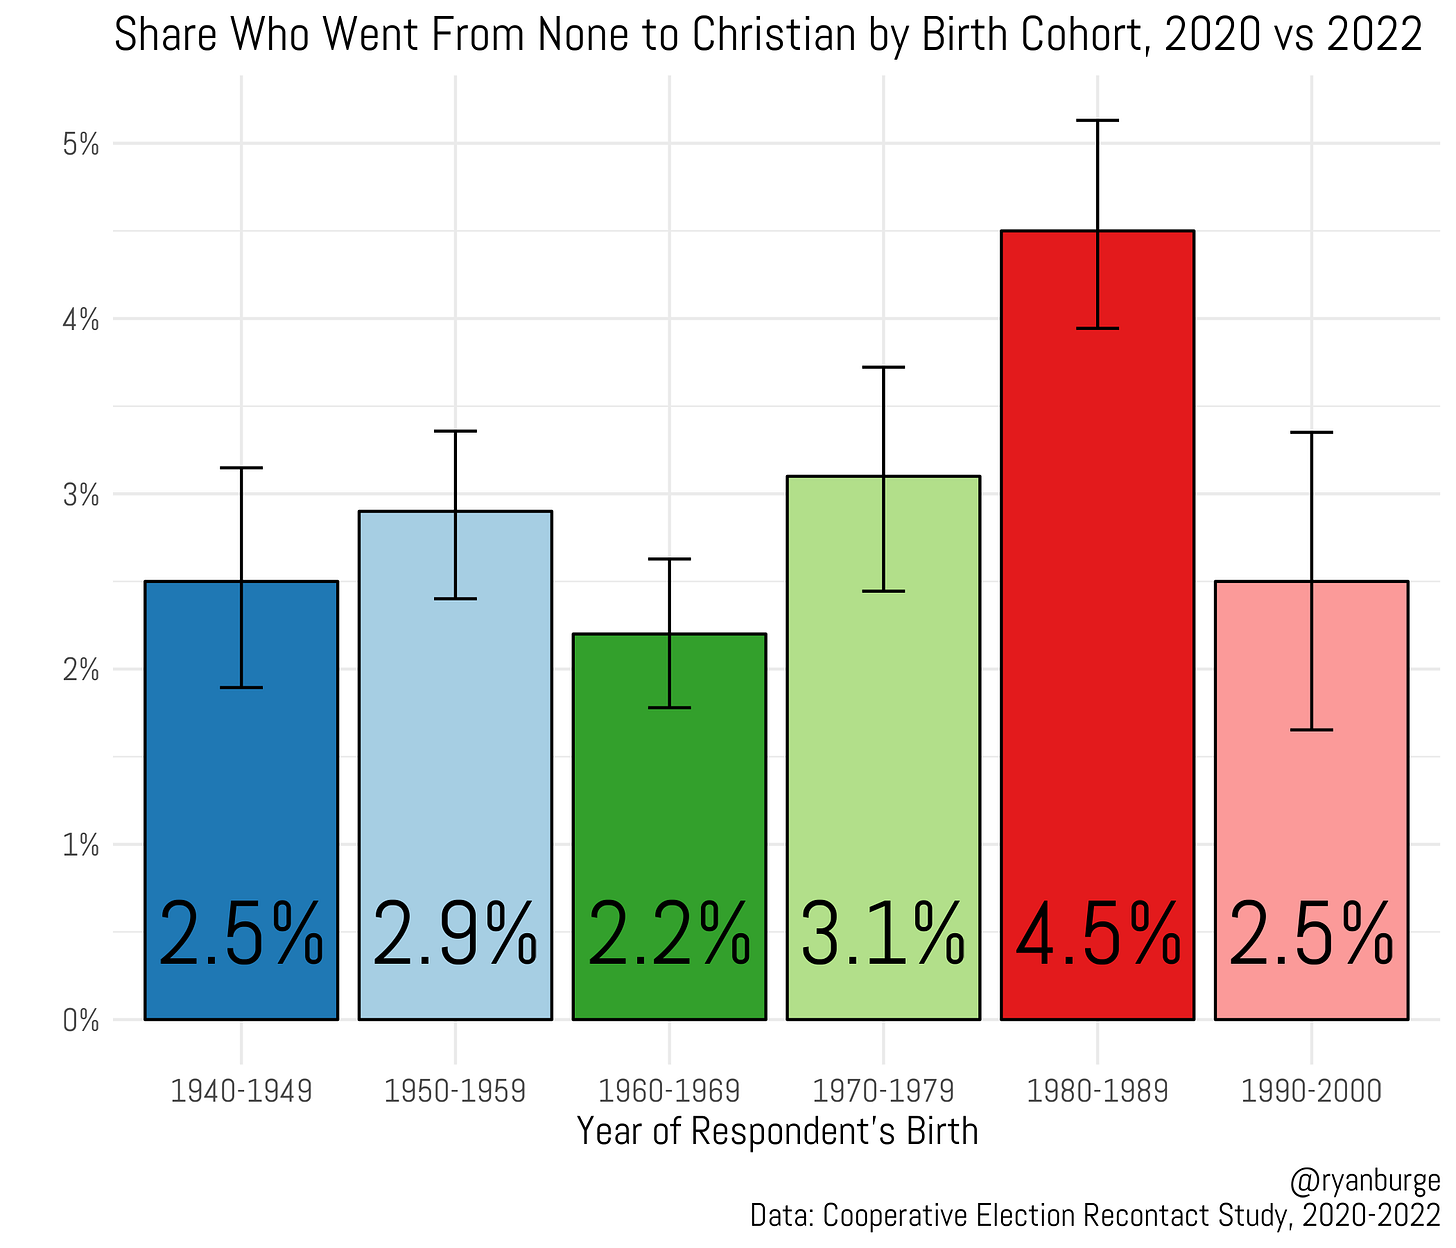
How about the other direction - going from non-religious to Christian during this same time period?
Again, there’s just not a ton we can glean from this except from that weird little aberration in the 1980s birth cohort. The overall share of the sample that went from None to Christian was 2.9%. For those born in the 1980s, it was much higher at 4.5% and outside the margin of error. That’s clearly something that needs to be watched more carefully over time. This data points to a significant return to Christianity among folks born between 1980 and 1989. But, again, this is just one survey result. It needs to be replicated in multiple instruments to have reliability. It does look like there will be another recontact of this group in 2024, so we can track this trend a bit more closely when those results get posted.
The most frustrating part of my job is how much I frankly don’t know about the world of American religion. I get asked a question nearly every day that I just don’t have the answer to because the data doesn’t exist or it’s just methodologically difficult to answer well. This is a good example of that.
If there’s any wealthy individual who wants to give me a chunk of money every year to answer some of these questions, I am open to the conversation!
I’m (partly) joking. But if you are interested, you know how to find me.
Code for this post can be found here.


