Marriage rates are falling. Is the decline of religion to blame?
I love that Pew Research is doing more “short reads” which is just a quick little data point or two and a few words. From my experience, the vast majority of folks just don’t have the attention span for a 5000-word report about a specific topic from a data perspective.
They published an especially thought provoking one this week about the marriage rate in the United States. The headline was an eye opener, “A record-high share of 40-year-olds in U.S. have never been married.” According to their data, a quarter of people reach their 40th birthday without walking down the aisle. It was 6% in 1980. That’s wild.
That dovetails very nicely with a piece I wrote last week called “Religion Has Become a Luxury Good.” In it, I note how religious spaces are chock full of people who checked all the boxes of a “proper” life. College degree + middle class income + married + children.
The decision to marry or not is deeply intertwined with religious beliefs, there’s no doubt about that. I wanted to dig deeper into just that aspect of American society. How much has marriage disappeared in the last few years? And is religion to blame? Or politics? Or maybe a bit of both?
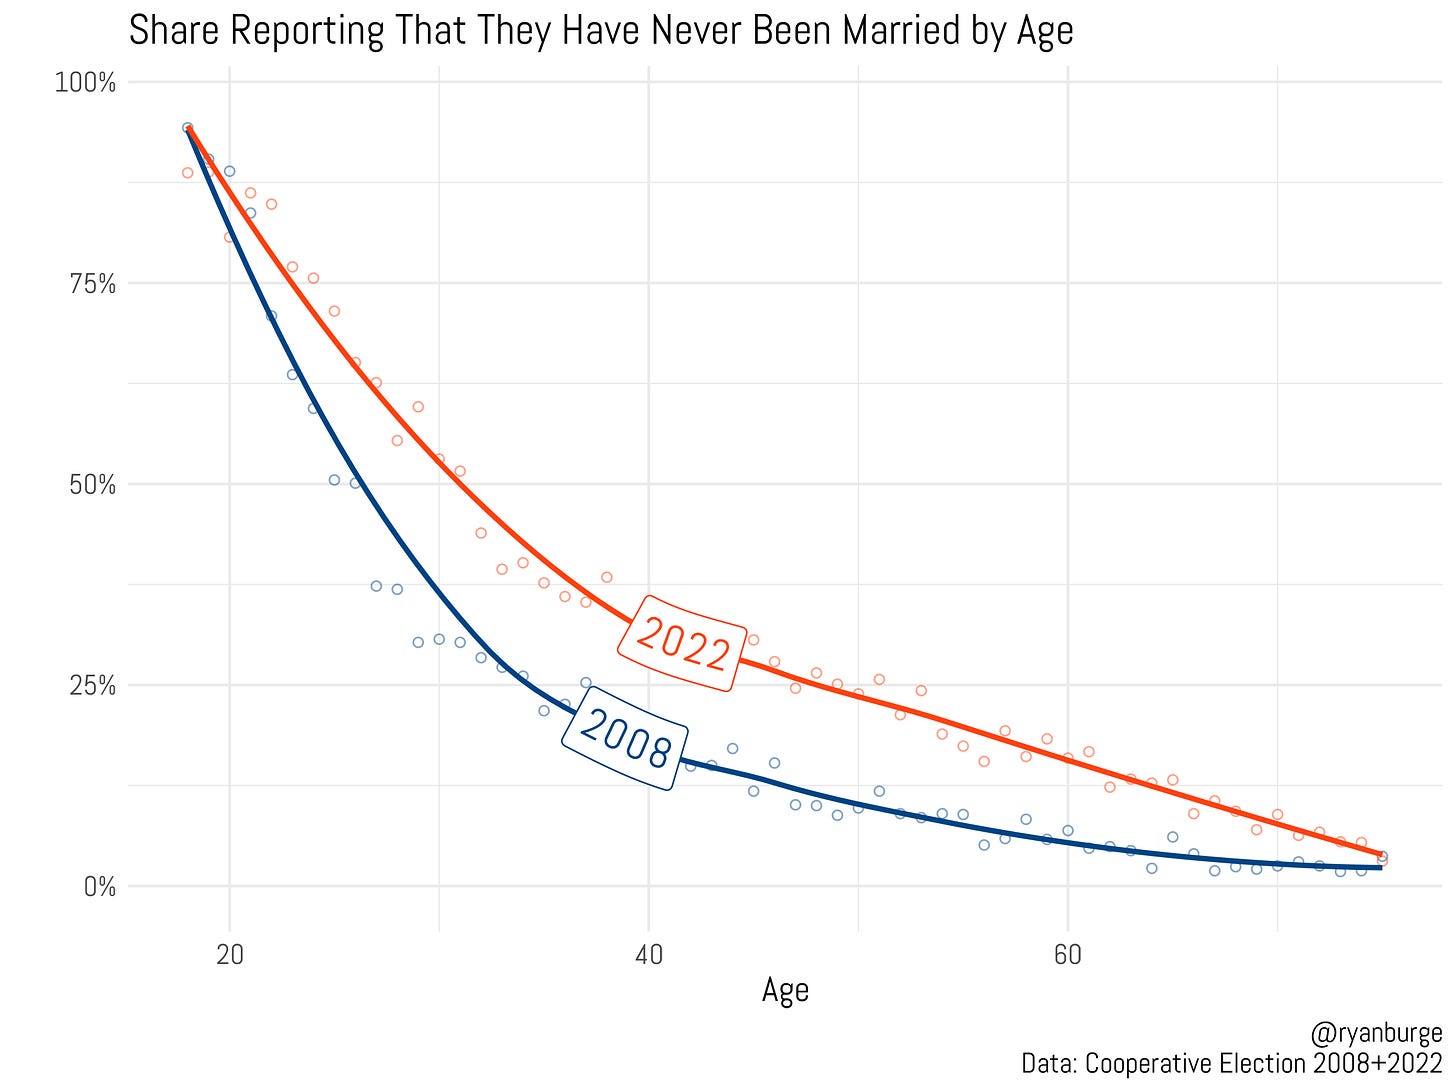
The Cooperative Election Study asks everyone about their marital status. They have a range of options such as: married, divorced, separated, widowed, or never been married. What’s great about the CES is that the sample is huge, so let’s look at the share of folks who say they have never been married at every stage of the life course in both 2008 and 2022.
For those of us who study demographic trends, shifts are subtle. This isn’t subtle, it represents a radical rethinking of the institution of marriage. For instance, in 2008, about half of people were married by age 27. In 2020, that was 31 years old. Among forty-year-olds, ~15% of people had never been married in 2008. In 2022, that was over 30%.
Those gaps persist at every stage of the life course, too! Almost 15% of 60-year-olds in 2022 have never been married now. It was ~5% of 60-year-olds in 2008.
Let me just point a finer point on this:
In 2022, less than half of folks have married by their 30th birthday. Over a quarter celebrate their 45th birthday without having ever walked down the aisle. Marriage is just not on the table for many people now.
Is this predicated on religion? Well, maybe.
This is data just from 2022, so we can clearly see the gaps in marriage rates by attendance level. Again, this is broken down by age. Clearly, more frequent attenders are more likely to be married and to marry younger than those who report going to services less than once a year.
By 27, a majority of weekly attenders have gotten married. That threshold is crossed at thirty years old for moderate attenders. Among those who never/seldom attend, a majority are still unmarried by 32 years old. Note how the weekly and yearly/monthly lines basically converge after age 50, too. That’s not the case for the low attending bunch. Even among those oldest adults, they are noticeably less likely to get married.
But are we seeing marriage rates plummet for just the less religiously inactive or is this an across-the-board phenomenon? I compared marriage rates for each of the six attendance levels in both 2008 and 2022. The results were not exactly what I would have expected.


