



This post has been unlocked through a generous grant from the Lilly Endowment for the Association of Religion Data Archives (ARDA). The graphs you see here use data that is publicly available for download and analysis through link(s) provided in the text below.
I’m always on the look out for ways that I can do some data analysis on countries outside the United States. That’s often not too easy. The data infrastructure in the U.S. is incredibly robust and that’s in large part because we have organizations like the National Science Foundation which provide funding to administer key instruments like the General Social Survey and the American National Election Study. If you attend graduate school in the United States in social sciences you are quickly introduced to datasets like that in research methods.
One problem that plagues researchers is that we “go with what we know” too often. Since we become comfortable with a handful of datasets when we are in the apprentice phase of our careers, it makes perfect sense for us to stick to the tried and true as we move into the professoriate. In my day to day work, I rarely ever just stumble on a high quality survey from another country. It almost has to smack me in the face.
However, I found a way to intentionally expose myself to data that is not on my radar: scroll the Association of Religion Data Archive’s “Newest Addition” page. It is exactly what you think, a simple webpage that just displays the last ten things that have been uploaded to the ARDA repository.
It’s always a fun little potpourri of stuff, too. For instance, when I scrolled the page today there was a dataset of “Religious Inequality in America, 1916” and the “Illinois 1989 Policy Survey.” It’s just like grabbing random index cards out of the card catalog in the library. I love it. But there was one that really jumped off the page for me, “The Australian Survey of Social Attitudes, 2022.” I’ve never really done a deep dive on what’s up with religion in that country and I knew that I could also access the 2022 GSS data from ARDA, as well. So let’s figure out how much these two countries diverge on religion variables.
Let’s start with the usual suspect – frequency of religious attendance. Lucky for me, both the Australia Survey of Social Attitudes and the General Social Survey pose this question in a pretty similar way so I don’t have to spend too much time harmonizing the two variables.
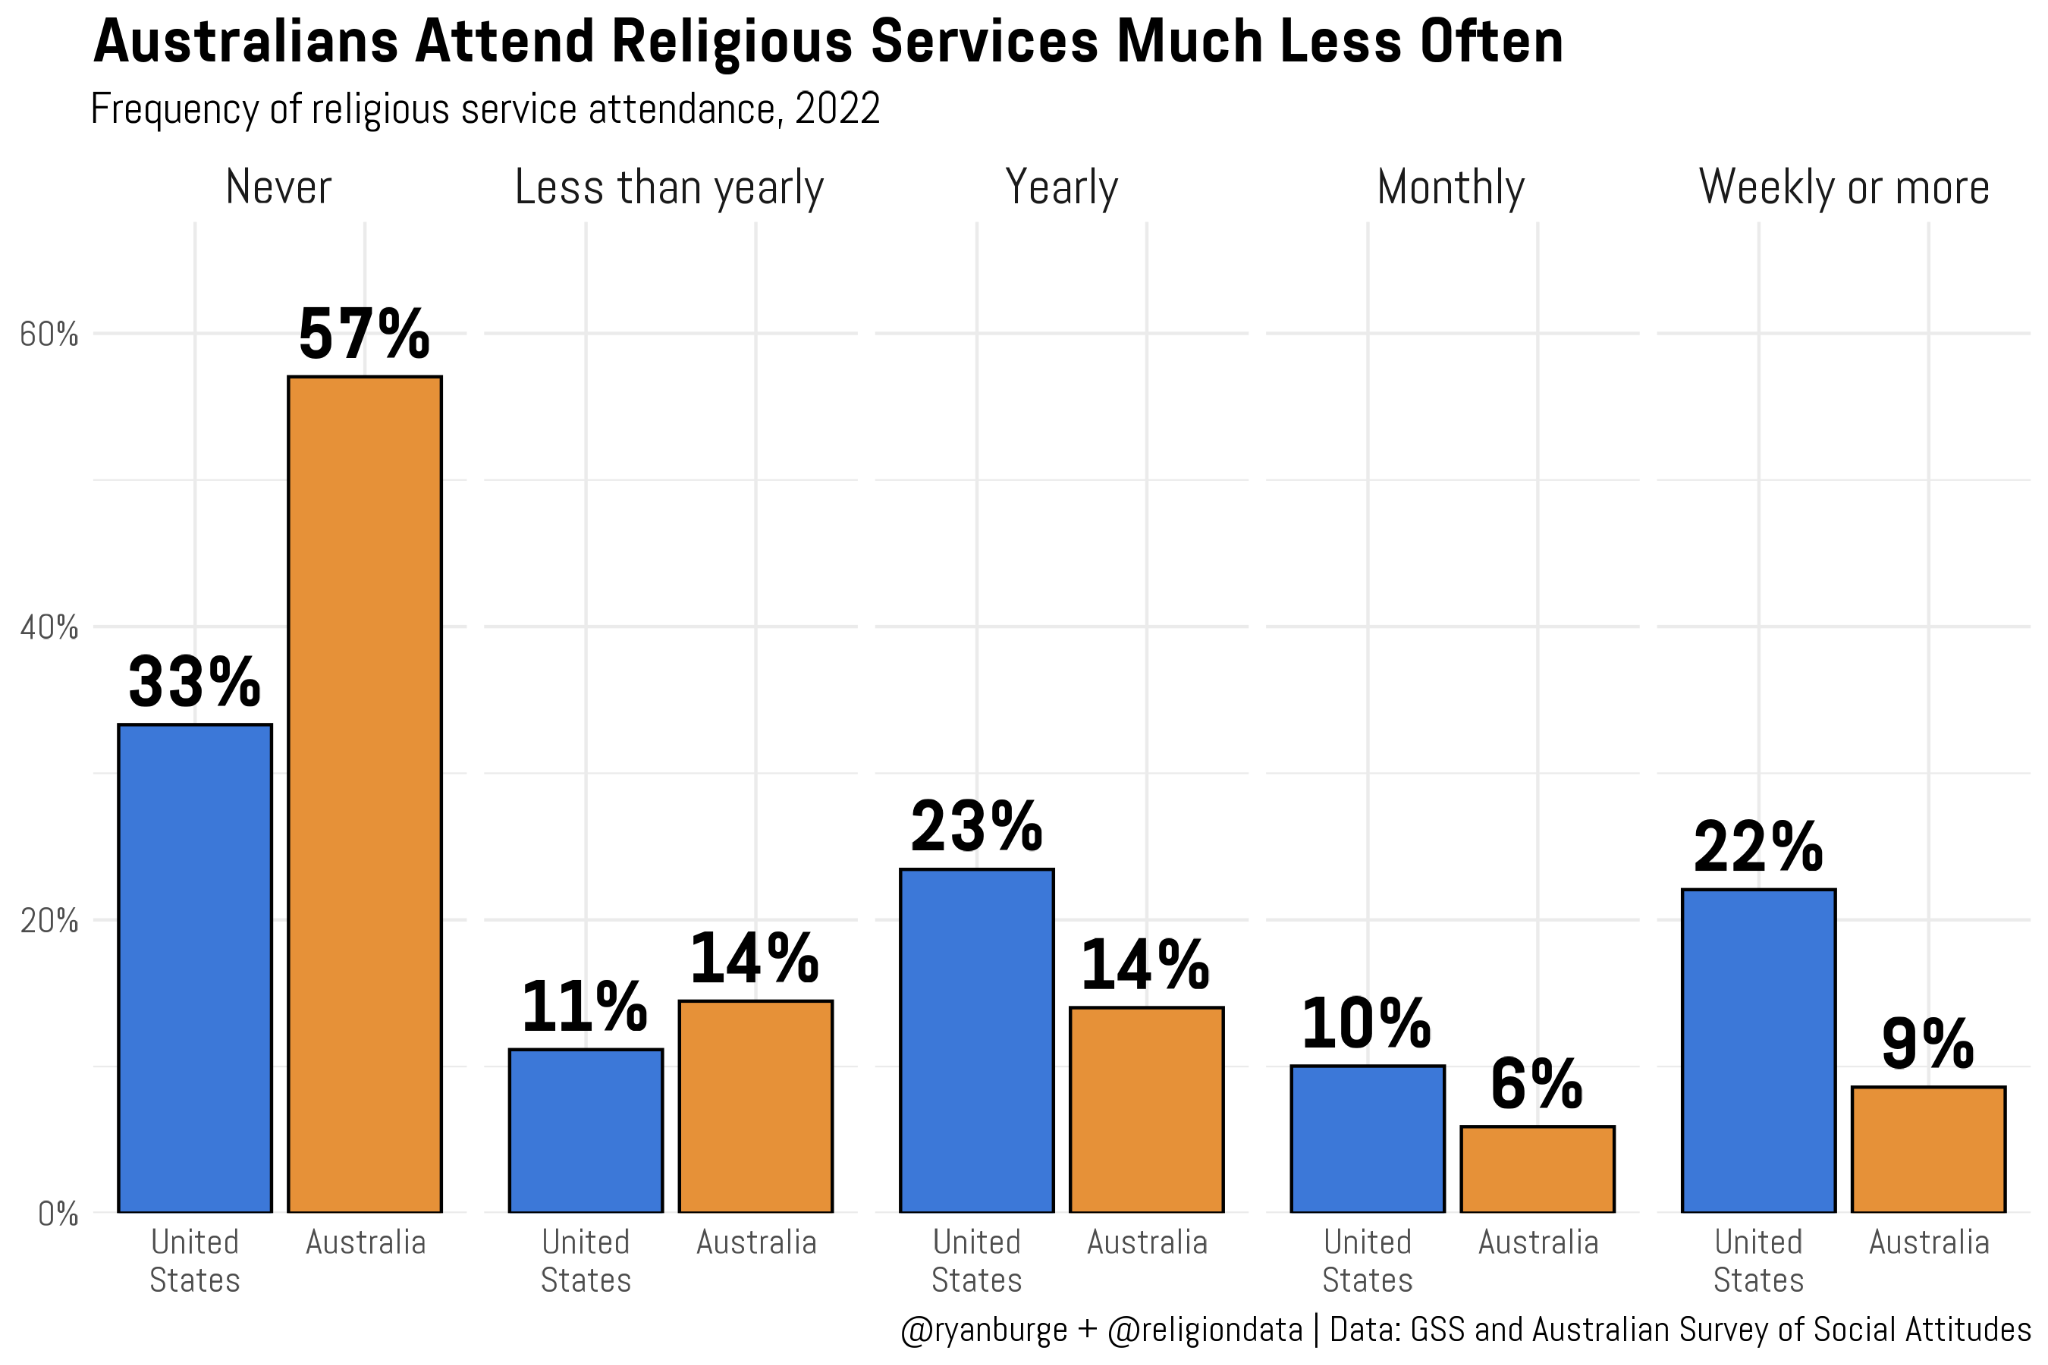
And the results of this comparison pretty much jump off the screen, right? The average Australian is much less likely to show up at a house of worship this weekend compared to the average American. Down under, 57% of Aussies indicate that their attendance level is never. That’s 24 percentage points higher than the American sample in the GSS. In total, 71% of Australians are going to a church, synagogue, or mosque less than once a year. For Americans, that share is 44%.
It logically follows then that Americans are much more prone to regular church attendance. In the 2022 GSS, almost a third of Americans report that they are attending church at least once a month, with 22% indicating that they attend on a weekly basis. Those figures for Australians are: 15% monthly or more attendance and just 9% who attend every single week.
Australians aren’t as religious as Americans if we are measuring by attendance. But maybe if I do the same calculation by age group, there’s a chance that the attendance gap will narrow in the future as older, more religiously active Americans die off?
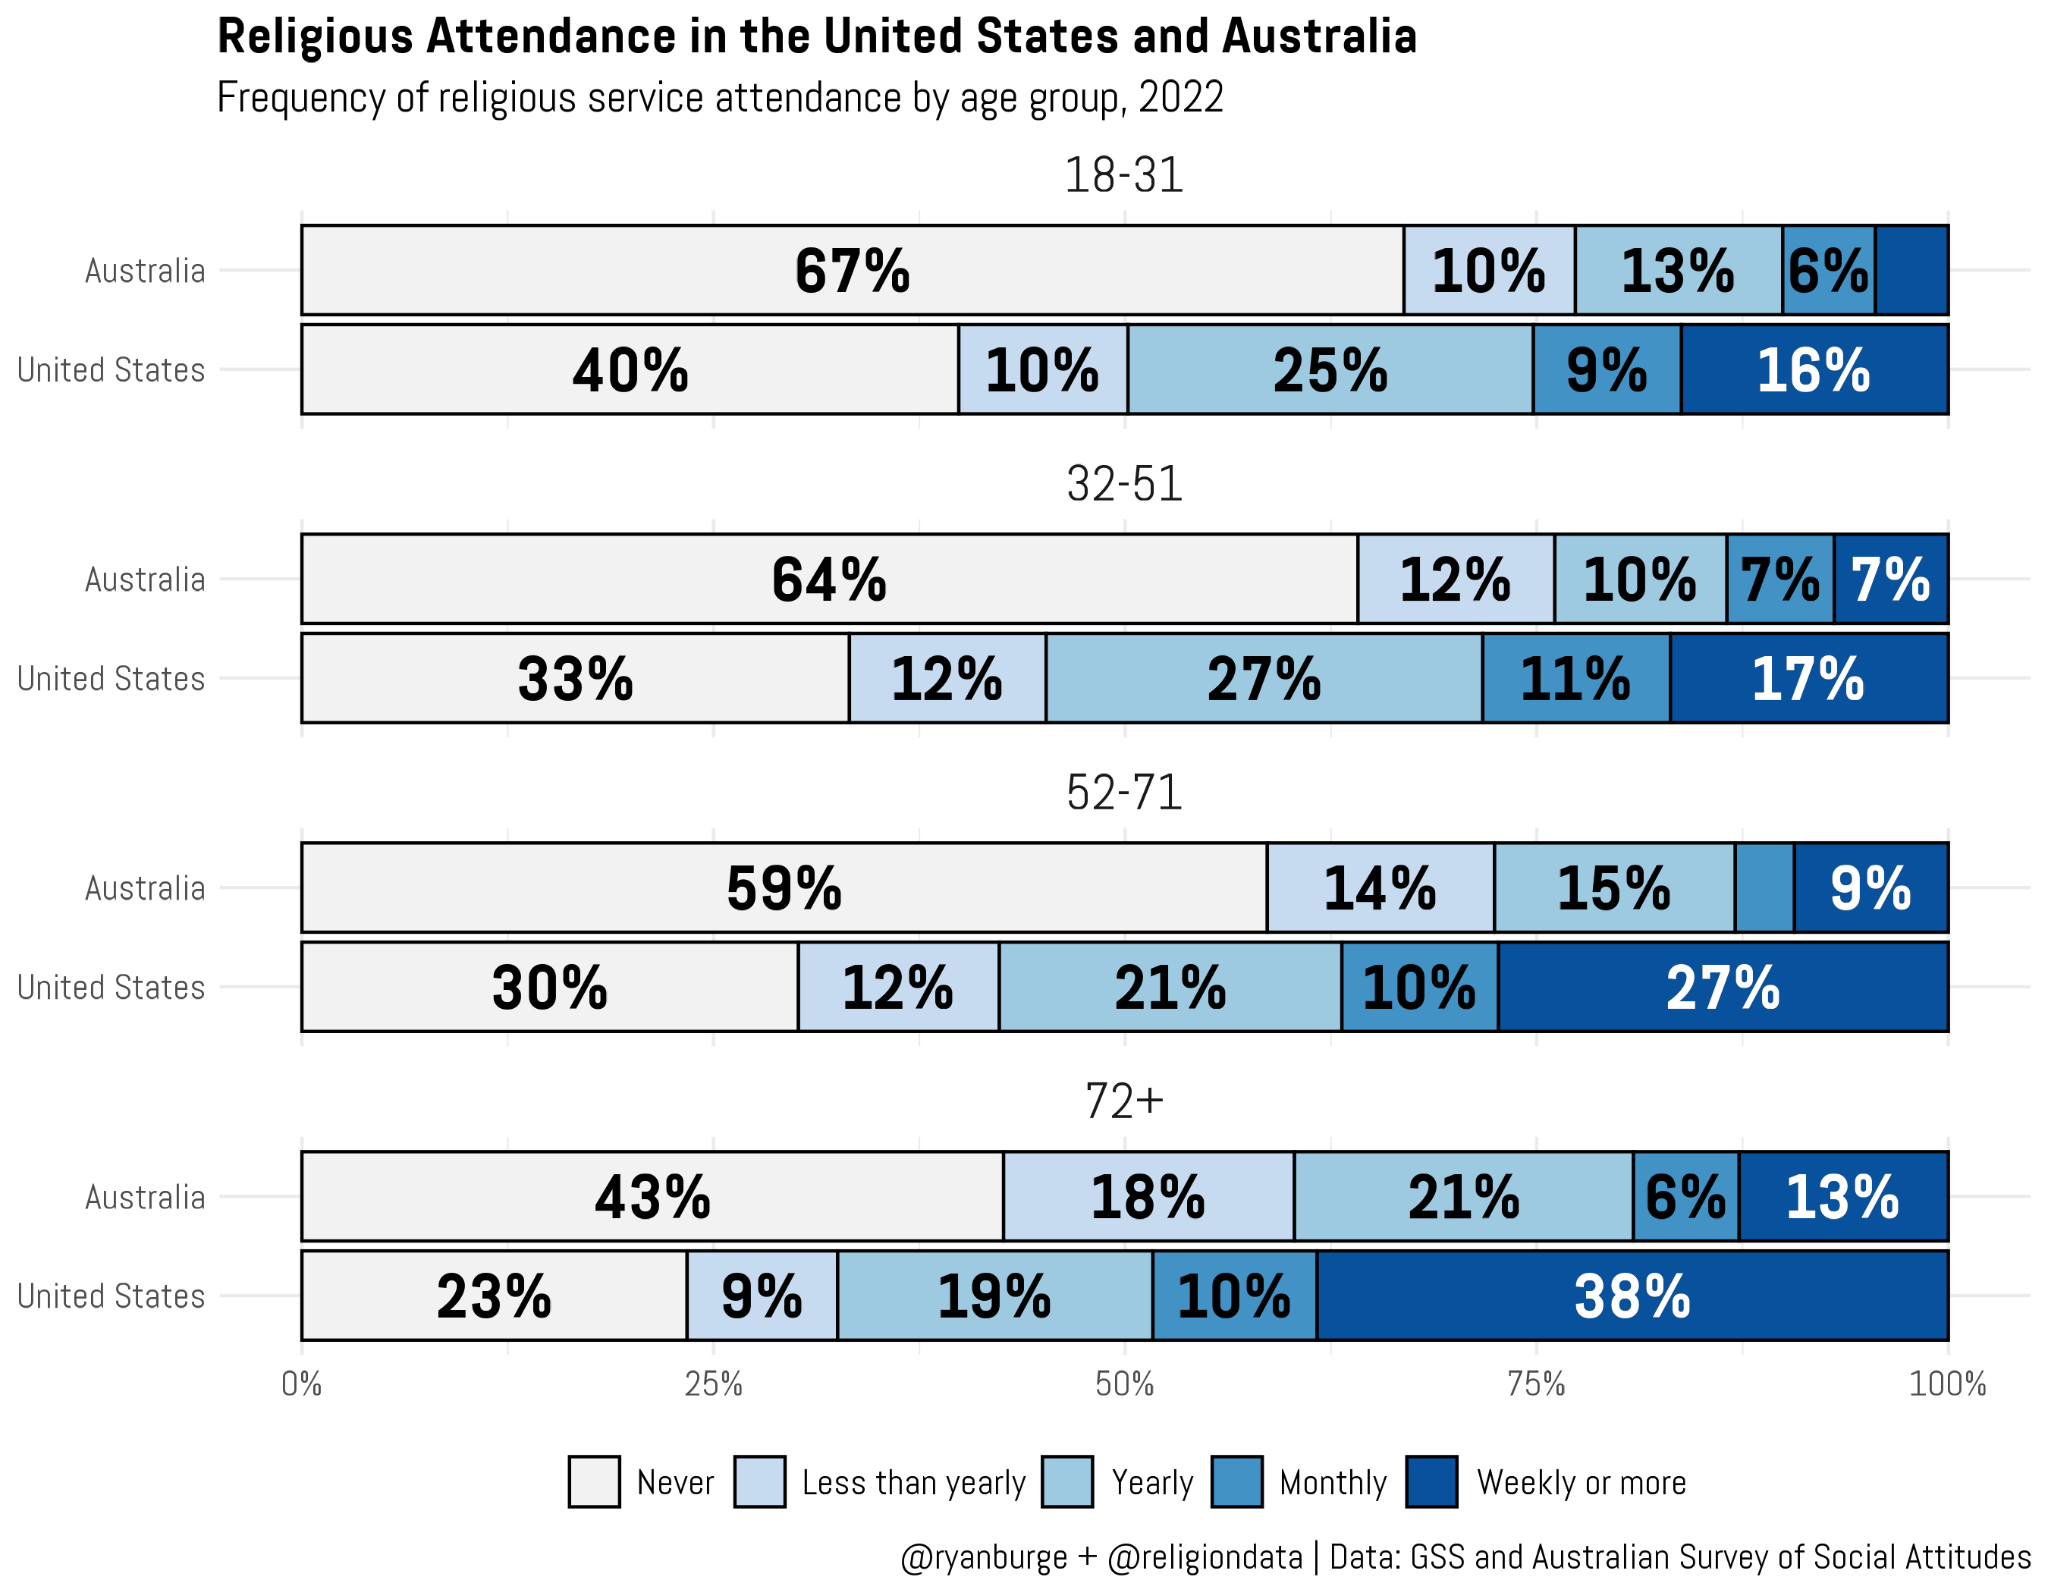
Yeah, I don’t see that happening, either. Not even close. Look at the bottom of the graph. Those are folks who are at least 72 years old. (I know the age categories are odd, but this is the only way to harmonize the age variable across both datasets). For the very oldest Australians, over 70% of them are going to church less than once a year. For the oldest Americans, just 32% are in the bottom two attendance brackets. A retired American is about three times more likely to be a weekly attender compared to an Aussie from the same age bracket.
Those gaps are really persistent when you compare younger respondents, too. Just looking at the “never” attending share of both samples is probably the best way to sort this out. Among those 52-71 years old, an Aussie is twice as likely to never go to church compared to an American (59% vs 30%). The gap is 31 percentage points for the 32-51 age bracket, as well. It does narrow just ever so slightly for the youngest adults. But among young adult Australians, 77% are going less than once a year and just 10% are weekly attenders. Those figures for young Americans are 50% and 25% respectively.
In other words, I don’t see any reason to believe that the attendance gap is going to narrow because of generational replacement.
Now, we turn our attention to a question about religious affiliation. The Australian survey asks, “Do you belong to a religion and, if yes, which religion do you belong to?” Then it’s got 14 different options that are a bit different than what you would typically see on an American survey of religion. For instance, it lists: Anglican/Church of England and Uniting Church/Methodist as top level choices. The GSS doesn’t do that.
So, again, I had to do some harmonizing to get everything lined up as well as possible. I ended up with four categories: the non-religious, Catholics, Protestants, and then everyone else.
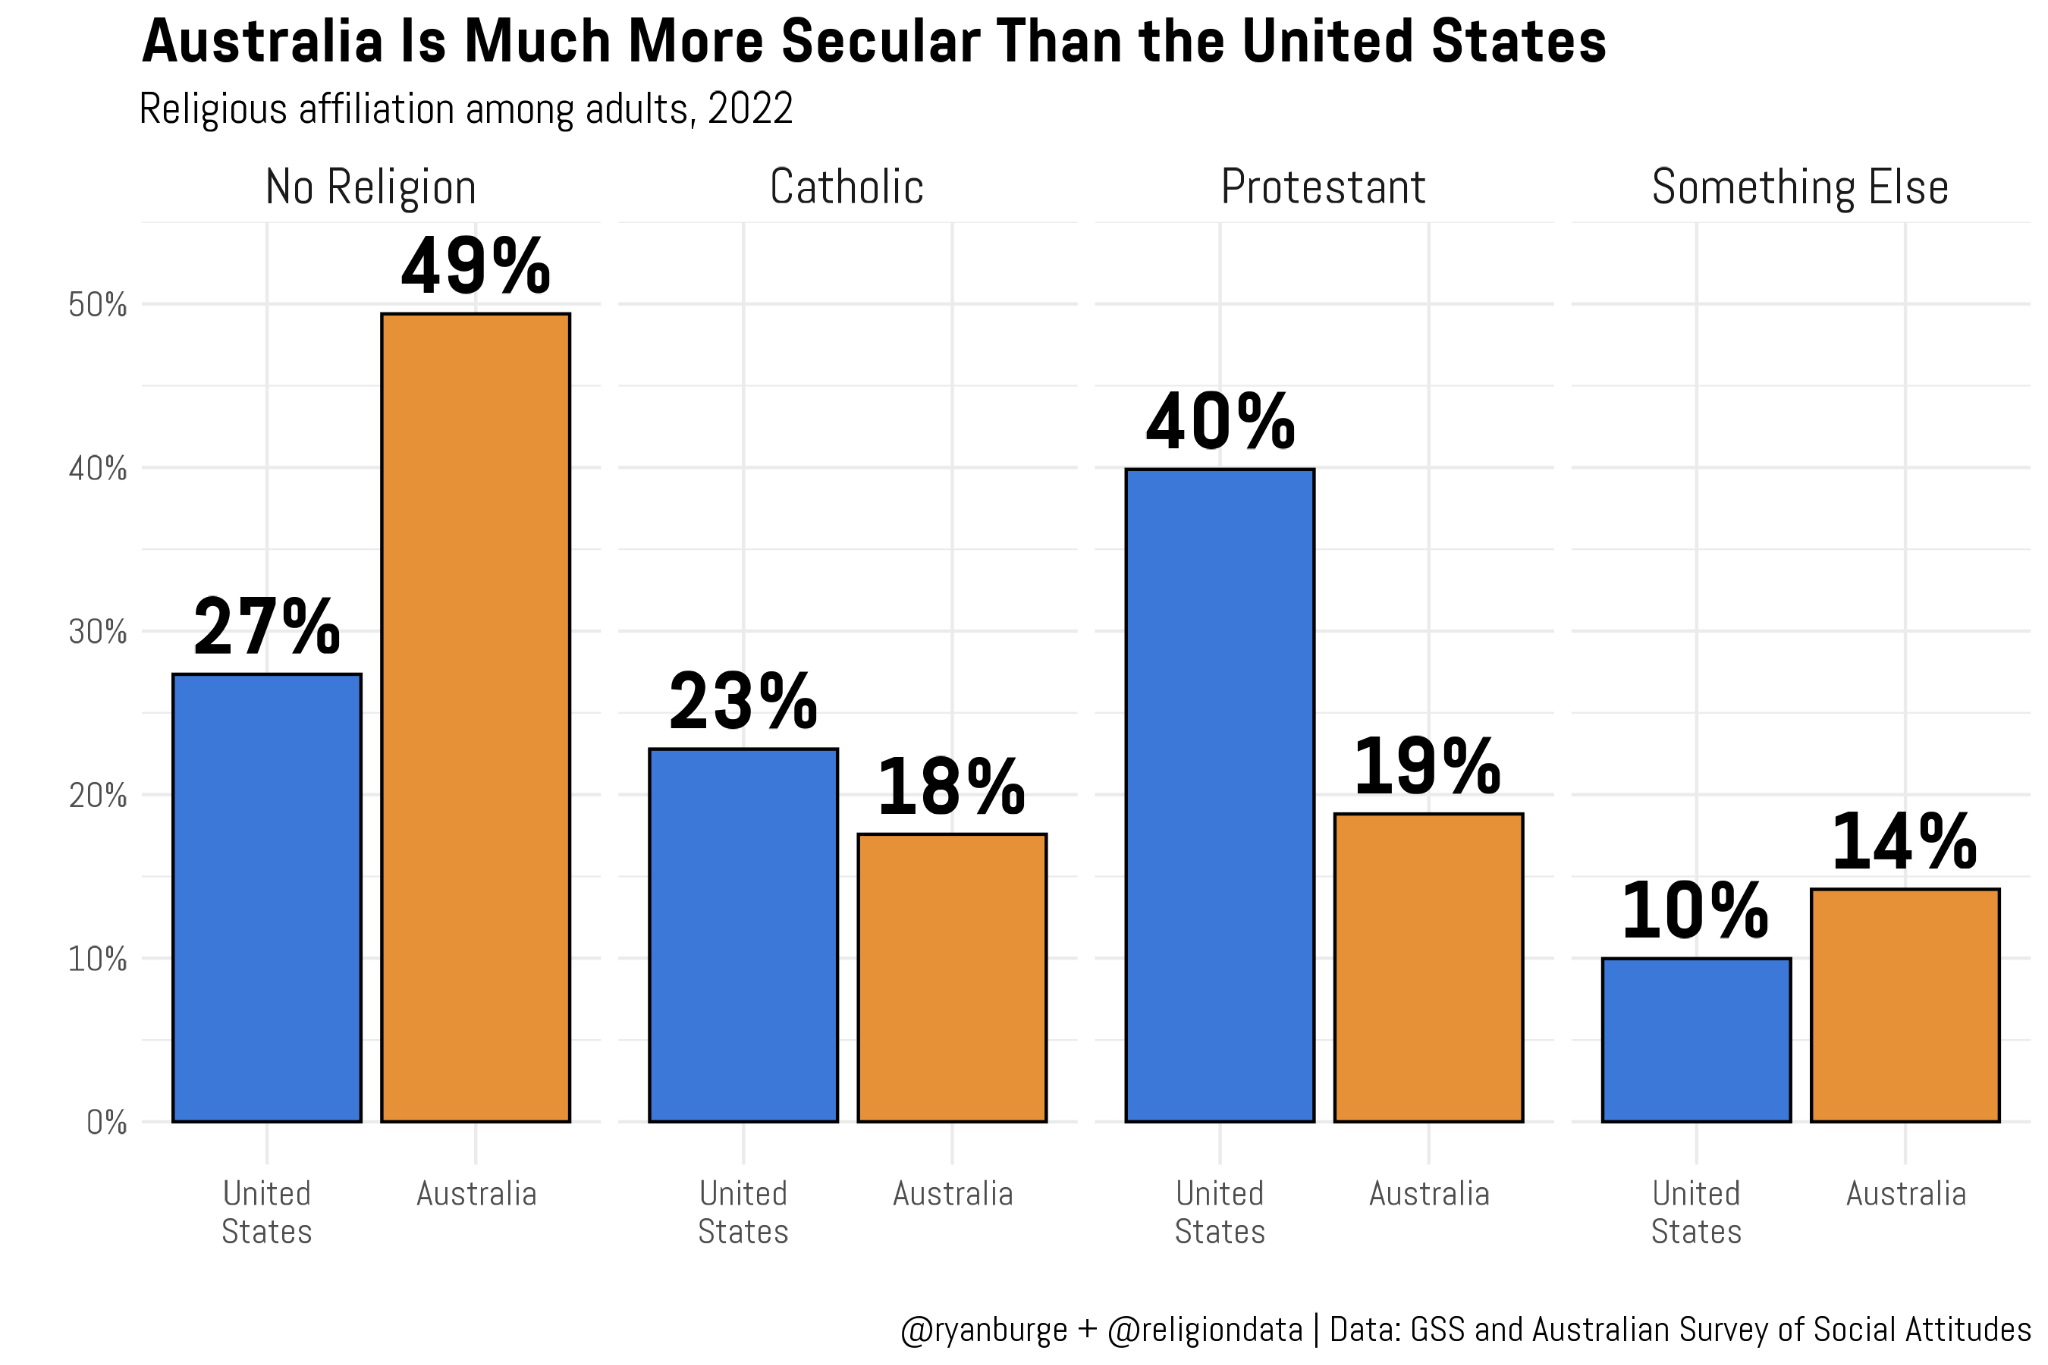
Based on the prior analysis of attendance, it should come as little shock that Australians are much more likely to identify as non-religious compared to their American counterparts. In fact, about half of Aussies indicated no religious affiliation. That’s almost twice the rate of the nones in the U.S at 27%. So, where does the American sample “find” those 22 points? It’s the Protestant category. Americans are twice as likely to identify as Protestant compared to Australians, 40% vs 19%.
The other two groups are remarkably similar, though. Americans are only five percentage points more likely to be Catholic compared to Aussies – 23% vs 18%. And then we have the “something else” category which covers everyone from Latter-day Saints to Buddhists. Here, the Aussies are slightly higher than the Americans at 14% compared to 10%.
Now, for keen eyed observers of the kind of work that I do – I never put the nones first in a graph. There’s a reason for that: in American surveys it’s never listed first. I’ve not once seen a mainstream dataset that put “non-religious” in the first position. It almost always goes Protestant, then Catholic. So why is it listed first above? Well, my friends, this is where things get very interesting.
There is a controversy brewing in Australia right now about some of the methodological choices made by the team of social scientists who put this survey together. The video embedded in this tweet does a good job of explaining a lot of it:


For those who don’t (or can’t) watch it, here’s the gist: The Australian survey put “non-religion” as the first option. Some folks believe that this artificially inflated the share of Aussies who are secular because of this. There is a robust literature in American political science about “ballot ordering” effects, which is the idea that whoever shows up on the ballot first is going to get a few more votes just because it’s easier to pick the top one from the list.
So, theoretically speaking, the critics do have a point here. I would definitely be inclined to believe that this design choice did bump up the nones rate in Australia. By how much? I have no idea. But in the video, they ran their own experiment and concluded that it was at least a ten point difference.
With that aside, let’s do the same calculation but do it by those age cohorts from earlier.
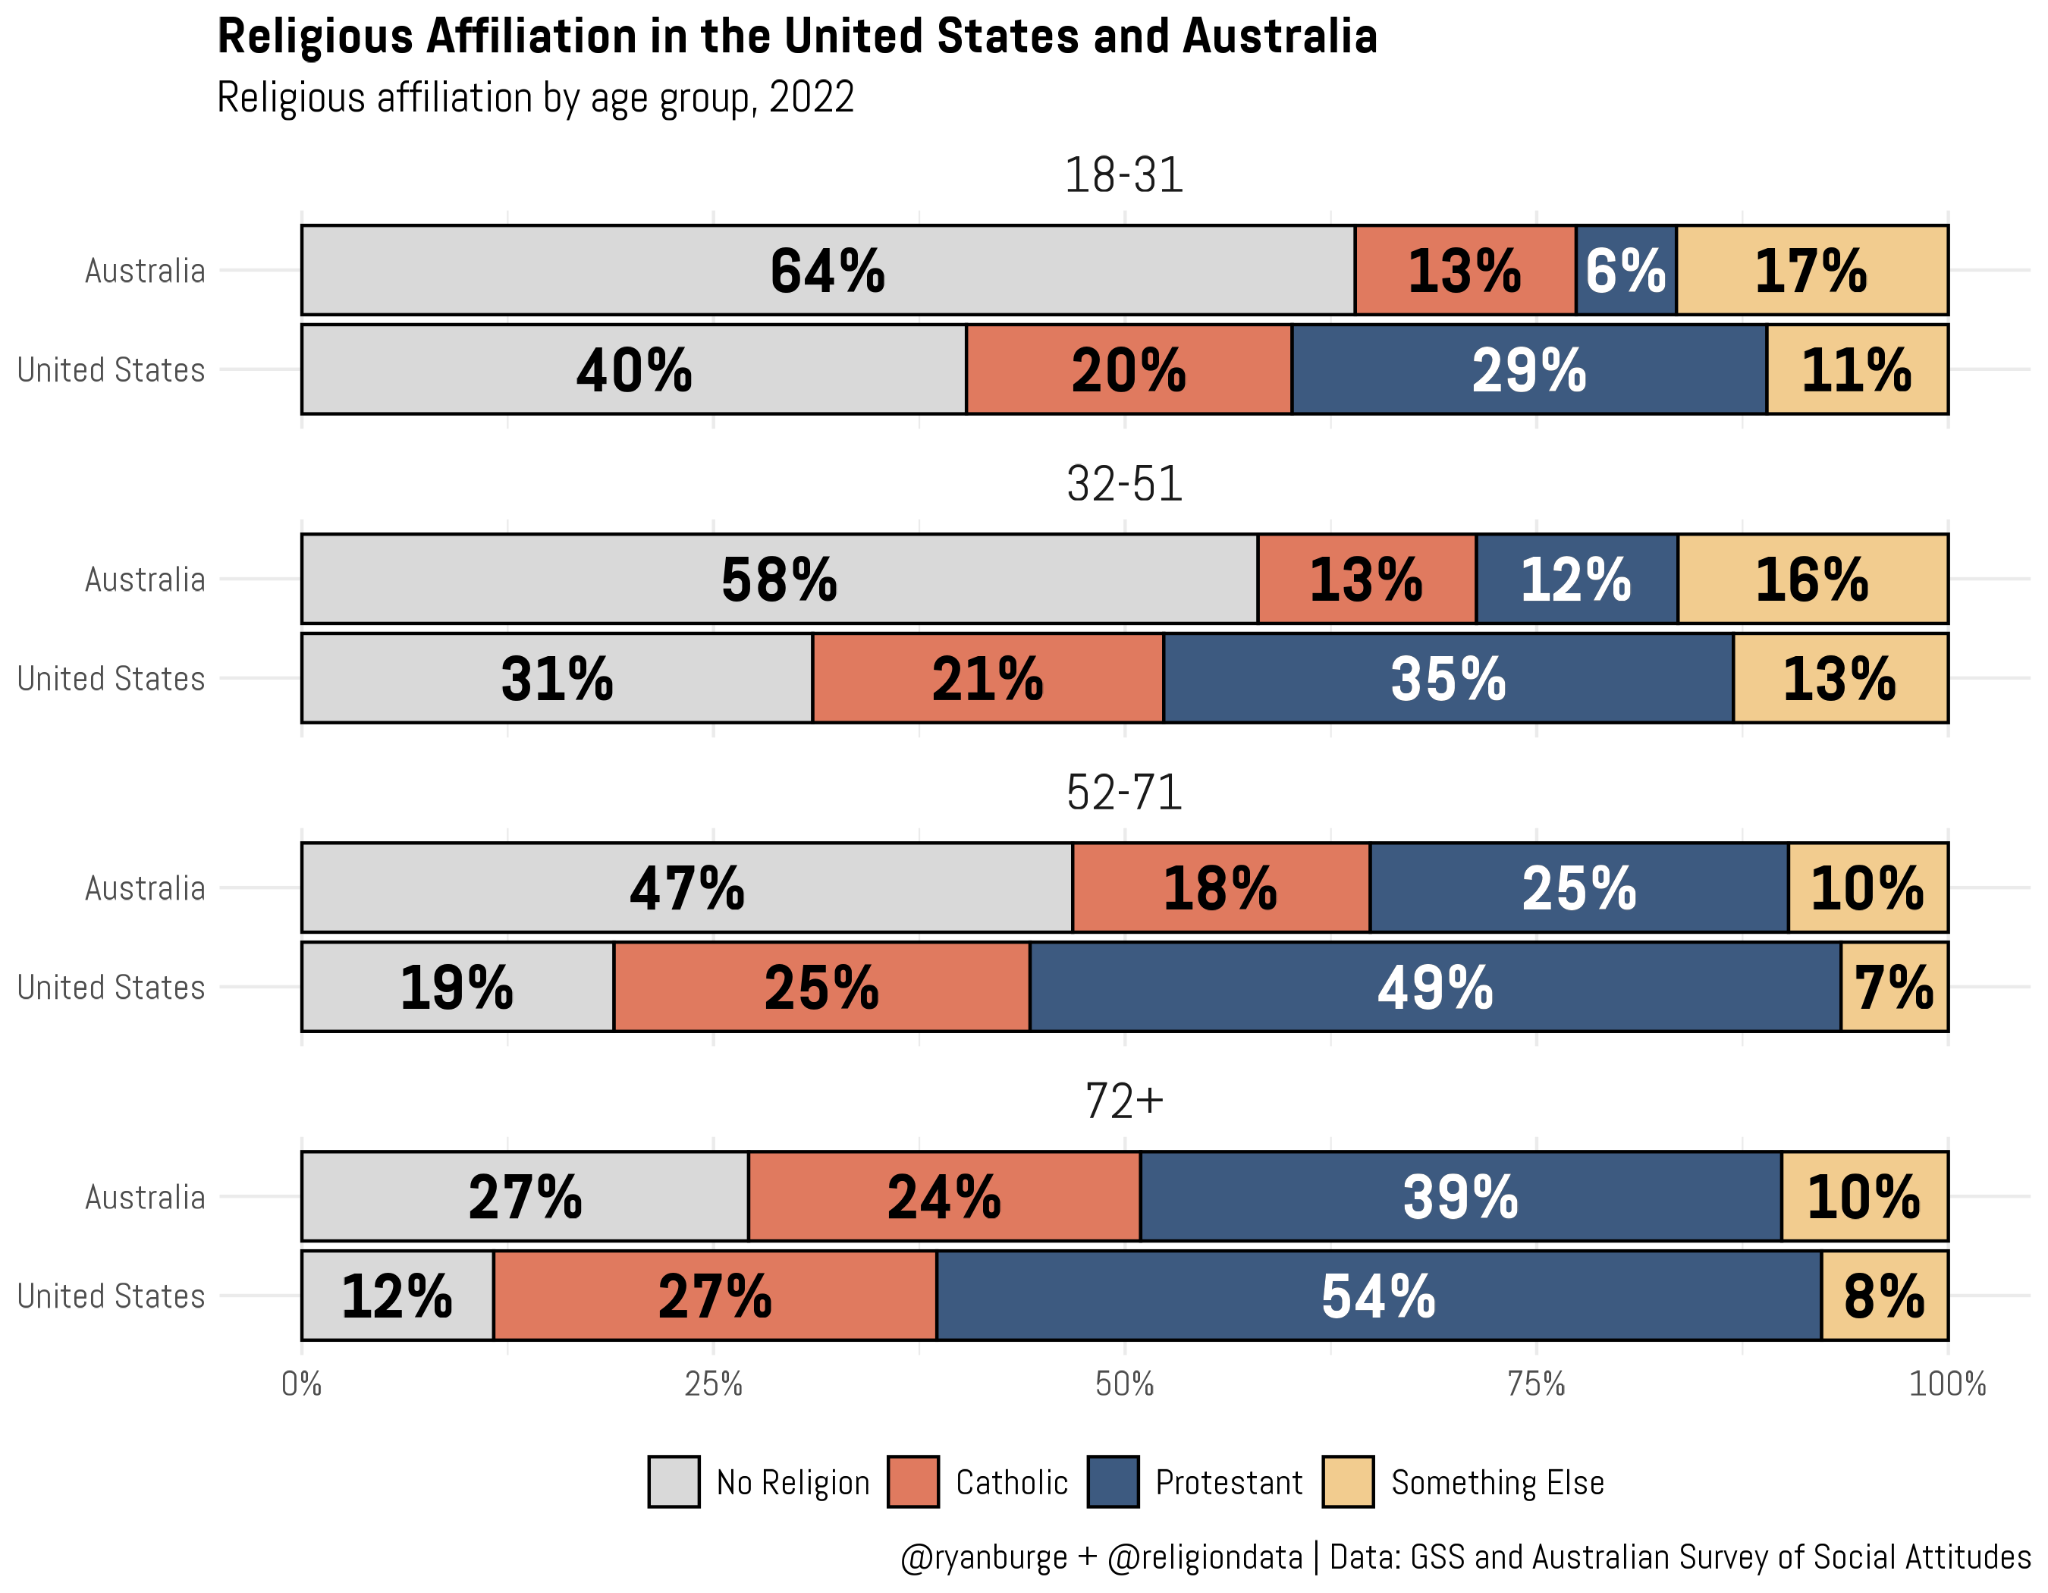
The gaps on the nones here are large and it grows when moving from older age groups to younger ones. For the oldest respondents in Australia, 27% were non-religious. It was 12% of Americans who were 72 or older. The gap is 27-28 points for those in the middle two age buckets, but it does narrow at least a little bit among the youngest adults. Among those who were 18-31, 64% of Australians claimed no religious affiliation, compared to 40% of Americans in that same category. Secularization continues apace in both countries. This is unmistakable.
Now the other thing that really blew my mind in this graph is how much Protestantism is just collapsing in Australia. Nearly 40% of the oldest Australians identify as some type of Protestant. Then it drops by 14 points in the next age cohort and then 13 points more in the 32-51 year old category until it bottoms out at just 6% among the youngest Australians. That’s hard to fathom, really. The share of atheists in America (not nones, just atheists) is around 5%. Only 6% of young Australians are Protestant.
I don’t think I need to make any more graphs to prove this point – the average Australian is a whole lot less religious than the average American, no matter how you measure it.
But I wanted to end this post with what I thought was a fun little battery of questions that basically asked about religious freedom. Each question started with this preamble, “Some religious people hold ‘conservative’ or ‘traditional’ beliefs and feel strongly that LGBTQ+ practices are against the teachings of their religion. Do you agree or disagree with them being allowed to do the following things?”
And then you had scenarios like:
I am going to only show you the share who “strongly disagreed” with each statement because as you can quickly guess, that’s where huge shares of Australians ended up.
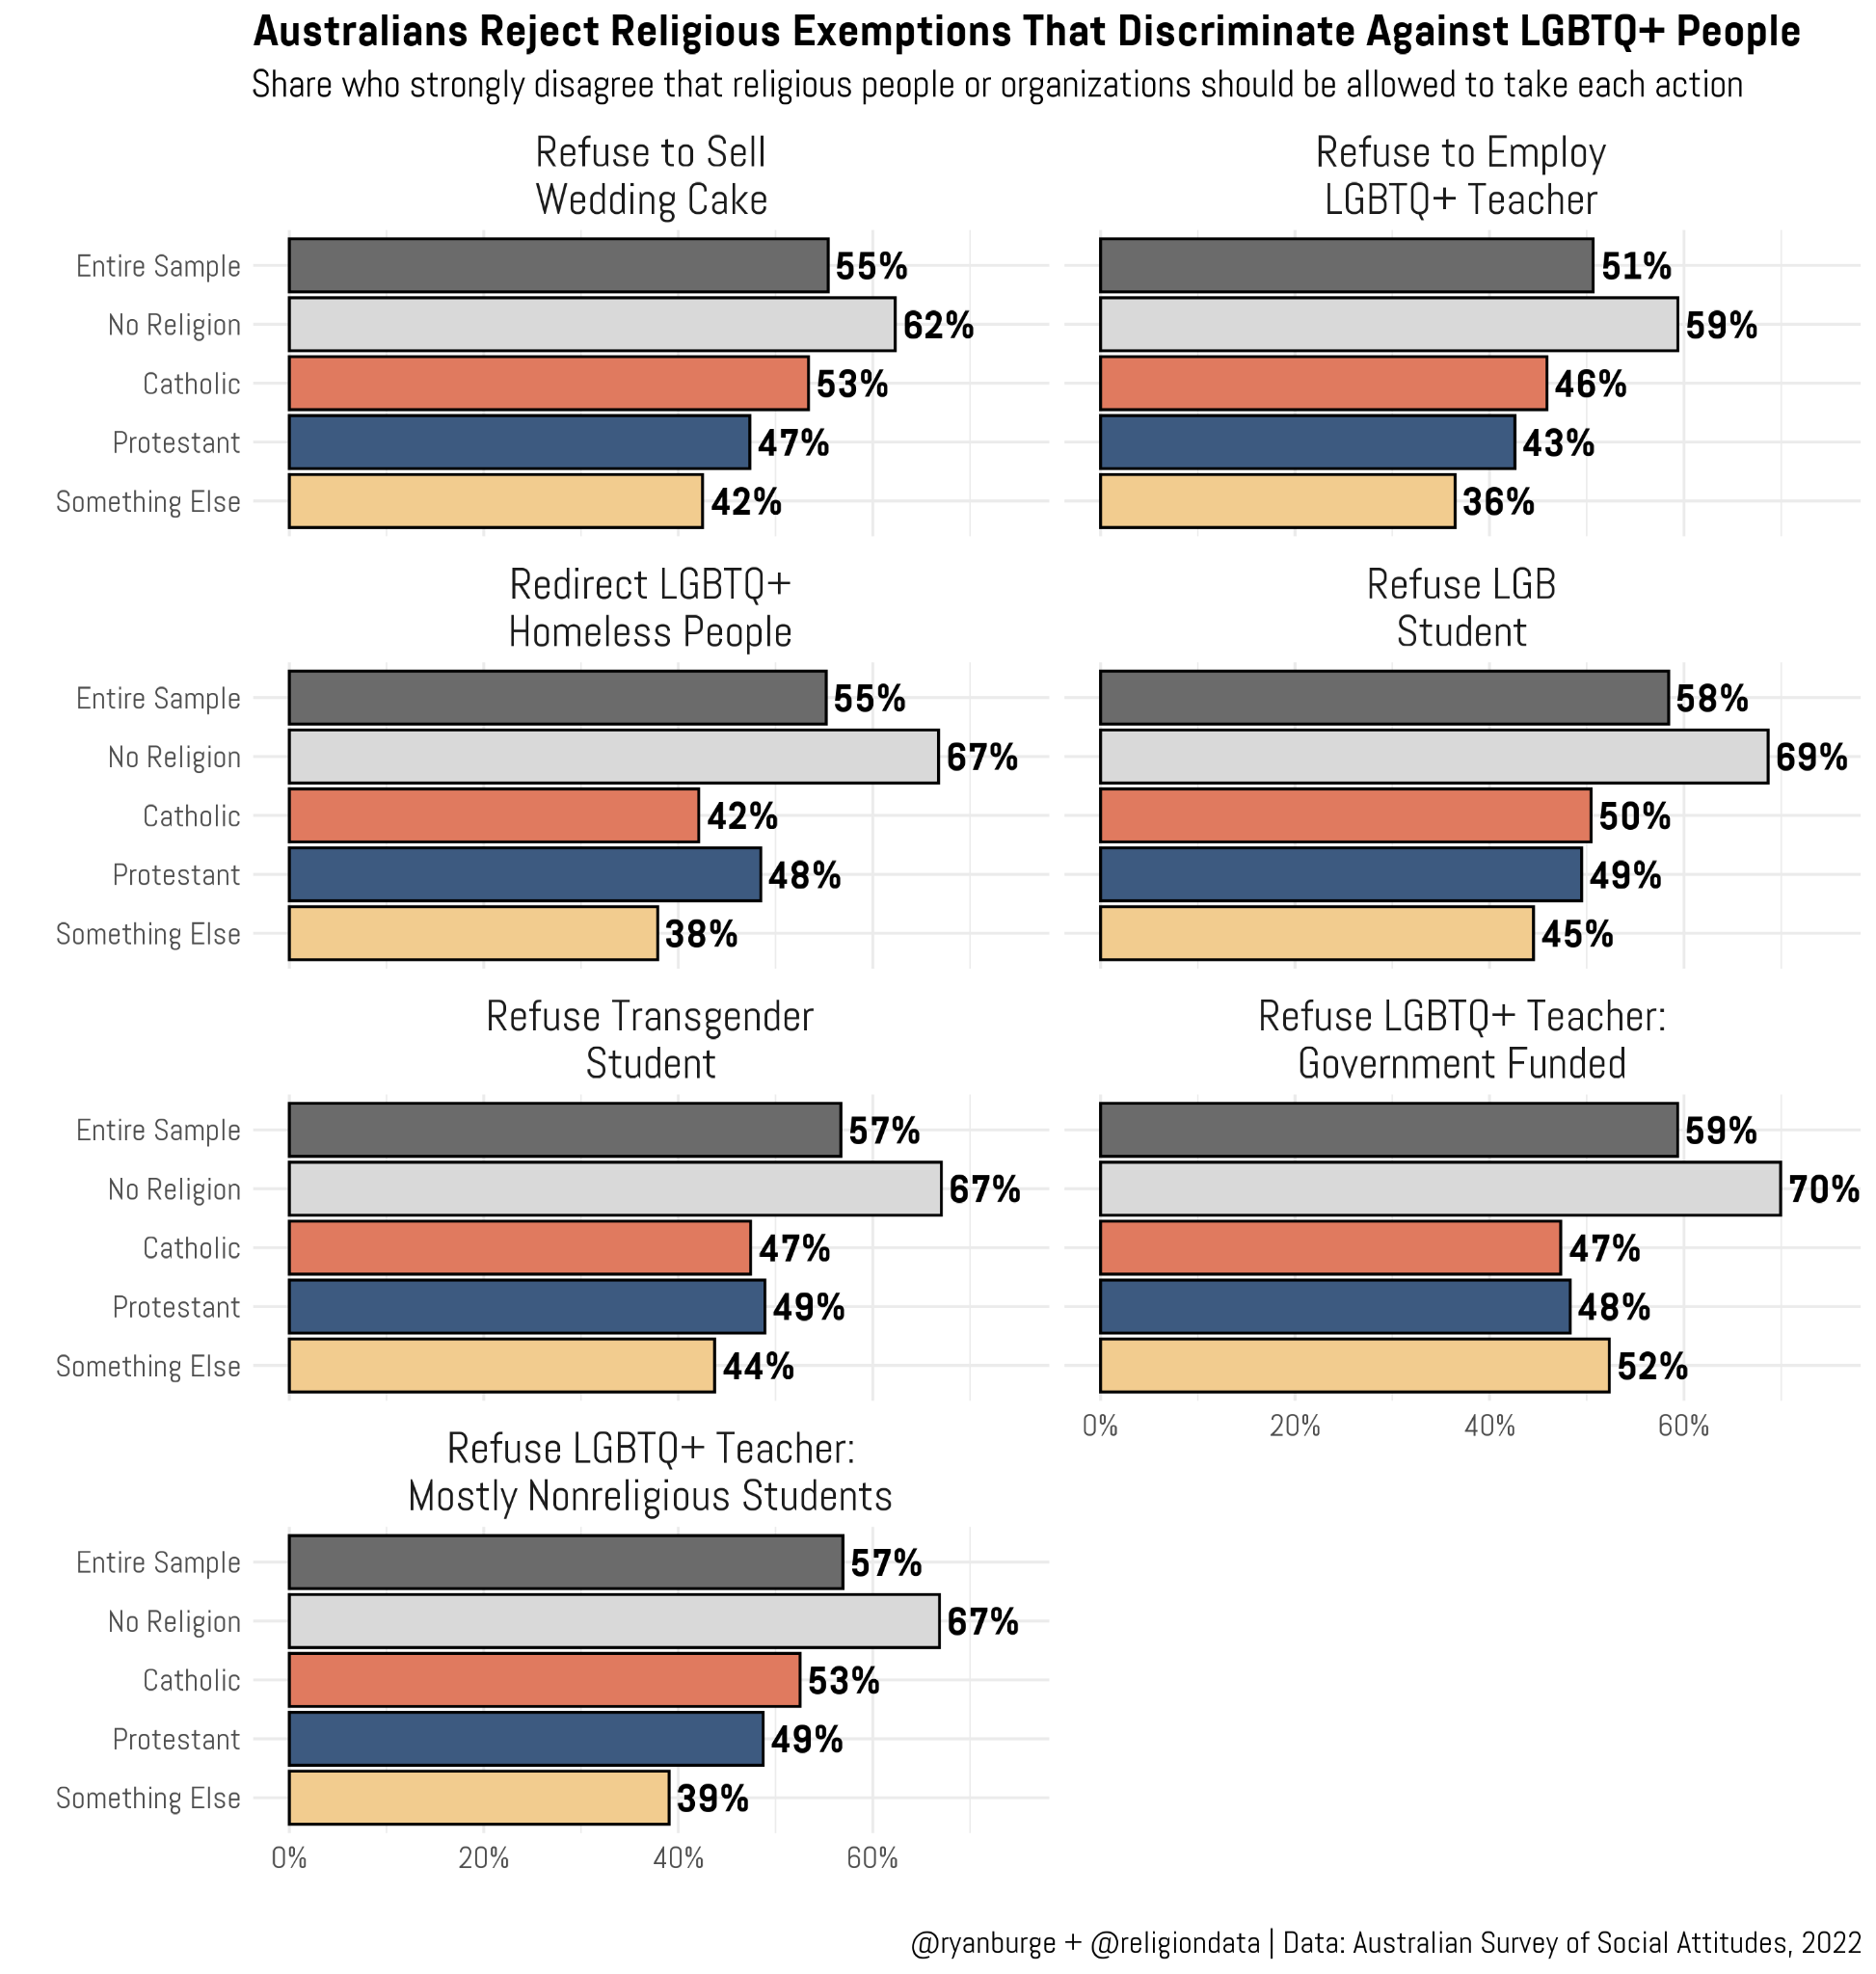
In every single one of these scenarios a majority of Australians said that they completely disagreed with the statement. The one that scored the lowest (at 51%), was the one about conservative religious schools refusing to employ an LGBTQ+ teacher. But every other scenario landed between 55% and 59% in the strongly disagree column. The one that registered the most disagreement was a conservative religious school that refused to hire that teacher when most of the school’s funding comes from the government.
I don’t think it’s that surprising that the non-religious always register a higher level of strong disagreement on these topics. But there are also lots of cases in which the religious sample was close to 50% on this metric. What really jumped out to me, though, is that there wasn’t a clear ranking ordering among the remaining religious groups. Sometimes Catholics scored the highest and other times it was the “something else” category.
In the debate between minority rights and religious freedom, it’s pretty clear where the average Australian falls.
So, there you have it – a pretty broad look at the religious composition of our neighbors from down under. It wouldn’t surprise me at all if Australia is two-thirds unaffiliated in 30 years, with only 20% of the population worshipping at least once a year. I think it’s fair to say the overall religiosity of Australia is much closer to many of their European cousins than the United States.
Code for this post can be found here.
Ryan P. Burge is a professor of practice at the Danforth Center on Religion and Politics at Washington University.

Would you be willing to break down a comparison with regions of the country?