Have We Reached Peak None?
Not if generational replacement has anything to say about it!
For those who are new to the party, let me explain how quantitative scholars of American religion make sense of the last fifty years of religious change.
They use the General Social Survey.
I’m not exaggerating when I say this — there is no other long-term, cross-sectional survey of the adult U.S. population that asks about religion in such a useful way. It’s the tree trunk of empirical social science in this space, and it’s cited everywhere. The phrase “General Social Survey” appeared in more than 4,400 articles published in 2024, according to Google Scholar.
And to my great joy, the GSS just released a second tranche of data that extends our picture of the American religious landscape through 2024. This release includes a bunch of new variables about religious affiliation. So, guess what I’m going to do in this post? Yup — walk you through where American religion stands right now, using the most recent and rigorously collected data available.
I’m using the RELTRAD scheme as the backbone for this analysis because it’s the most widely accepted typology in social science. I’ve published about RELTRAD in peer-reviewed journals a couple of times over the years, but you should know there’s a lively debate among academics about how best to refine the categories. I’m not diving into that here — it’s pretty deep in the weeds and not all that interesting unless you really enjoy methodological rabbit holes.
For our purposes, all you need to know is that I’m using an affiliation measure. You tell the GSS what kind of church you attend, and we sort you into the appropriate bucket based on that answer. There are six of them: evangelical Protestants, mainline Protestants, Black Protestants, Catholics, other faith groups, and the non-religious.
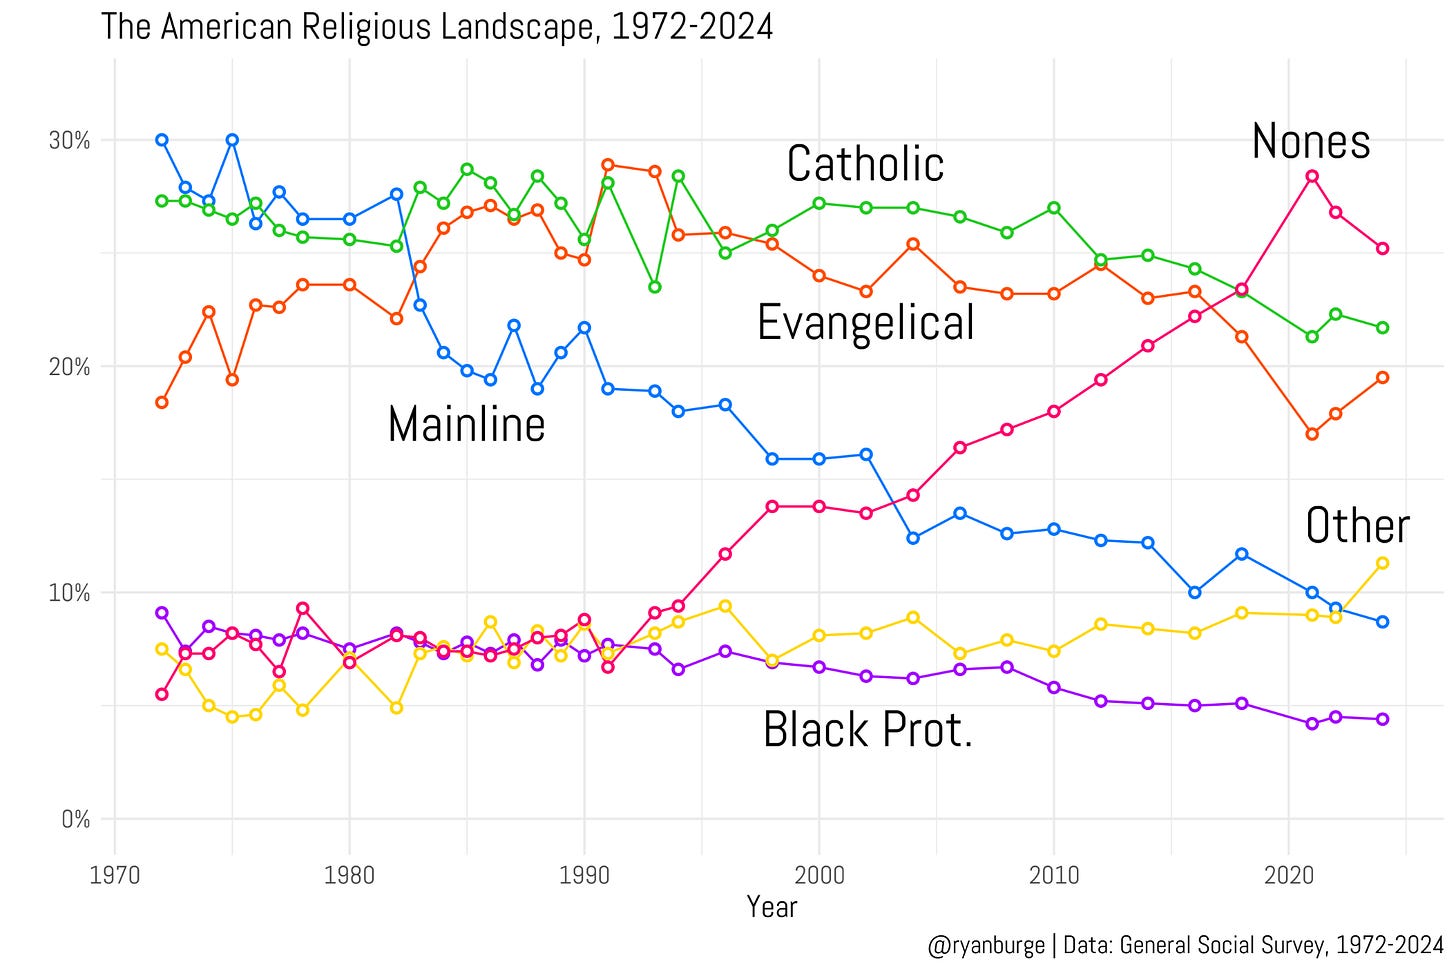
Here’s all six of them in one graph.
This is the graph I start most of my presentations with because it helps orient the audience to what American religion has looked like since 1972, when the General Social Survey was first launched. The best way to describe it is that four of the six lines aren’t all that dramatic. There’s some movement, sure, but it’s slow and methodical. Those steady groups include Catholics, evangelicals, other faiths, and Black Protestants.
Then you’ve got two lines that are impossible to miss in the middle of the graph — mainline Protestants and the non-religious. The former has fallen off sharply, while the latter has climbed almost in mirror image. The big patch of white space in the middle of the chart, forming an “X” around the early 2000s, really jumps off the slide.
Now, let’s dig into each of these groups a bit more closely so I can highlight some details that might be easy to miss when you’re just looking at the overall picture. Let’s start with evangelicals.
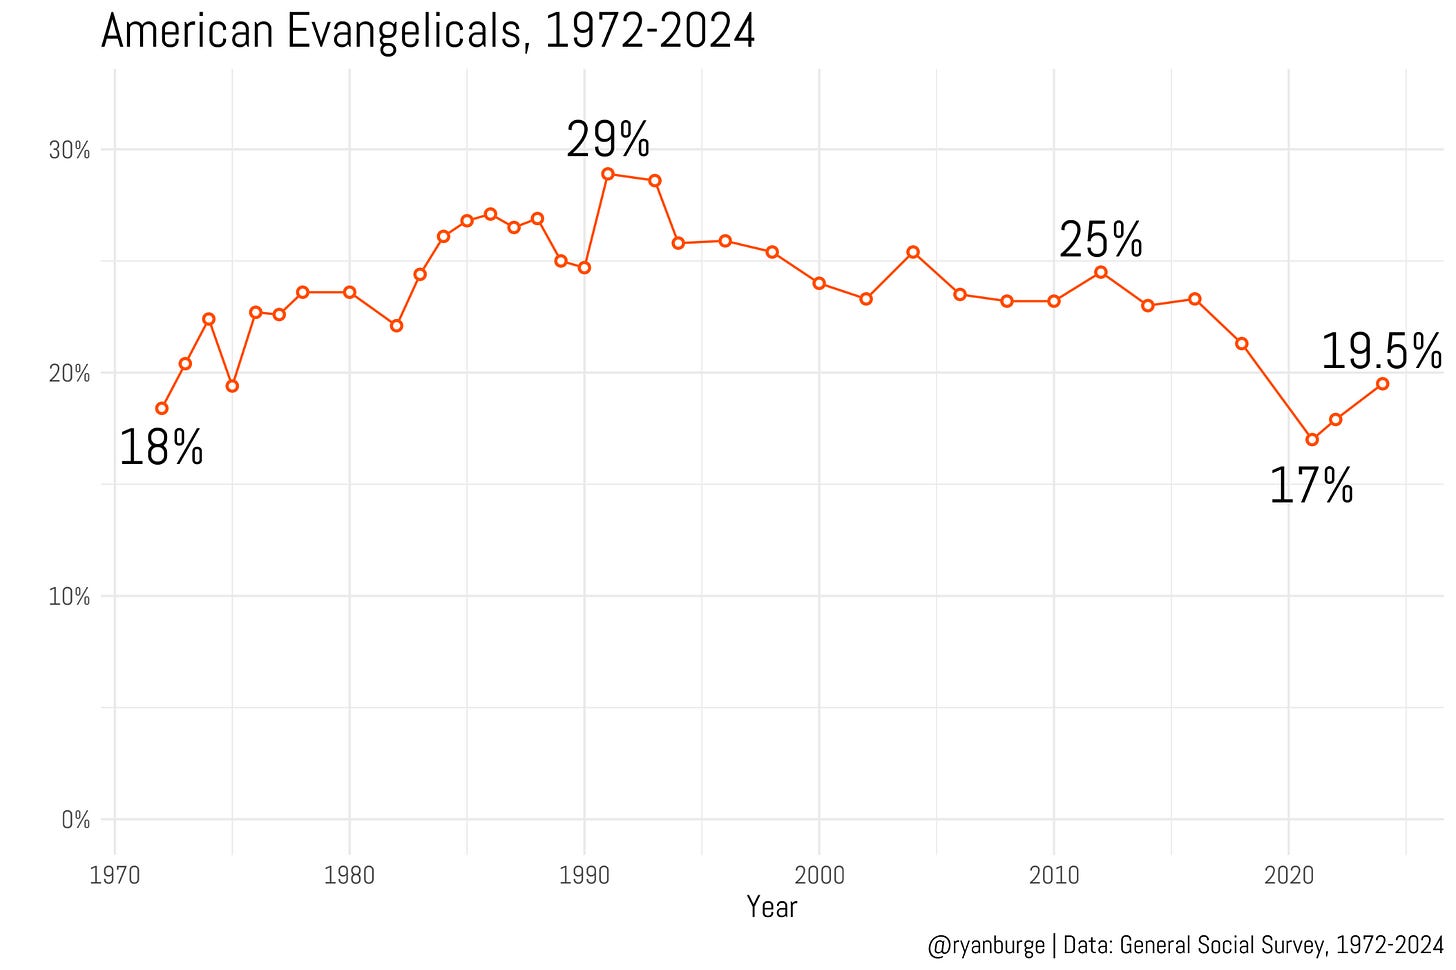
Evangelicals actually weren’t that large a tradition in the 1972 data. In fact, they came in third in relative size, behind Catholics and mainline Protestants, at about 18% of the full sample. That share began to rise pretty quickly over the next couple of decades, though. I’ve written about this before, but I think the data from the mid-1980s through around 2000 is really an aberration. During that stretch, evangelicals jumped from roughly 24% of the sample to nearly 30% of the population—only to give it all back.
From the early 2000s onward, there are two distinct phases. The first runs from 2000 through 2014, when the evangelical share held steady around 23–25%. Then, in 2018, it slipped to about 21%, followed by an even steeper drop to just 17% in 2021 (which, in my view, has something to do with survey mode effects). But in both 2022 and 2024, the evangelical share has crept back up. As of the most recent data, 19.5% of Americans identify as evangelical.
My read is that the evangelical baseline has consistently hovered in the low twenties, and it’s a couple of points below that now. But there’s a decent chance it climbs back to that level in the next few years.
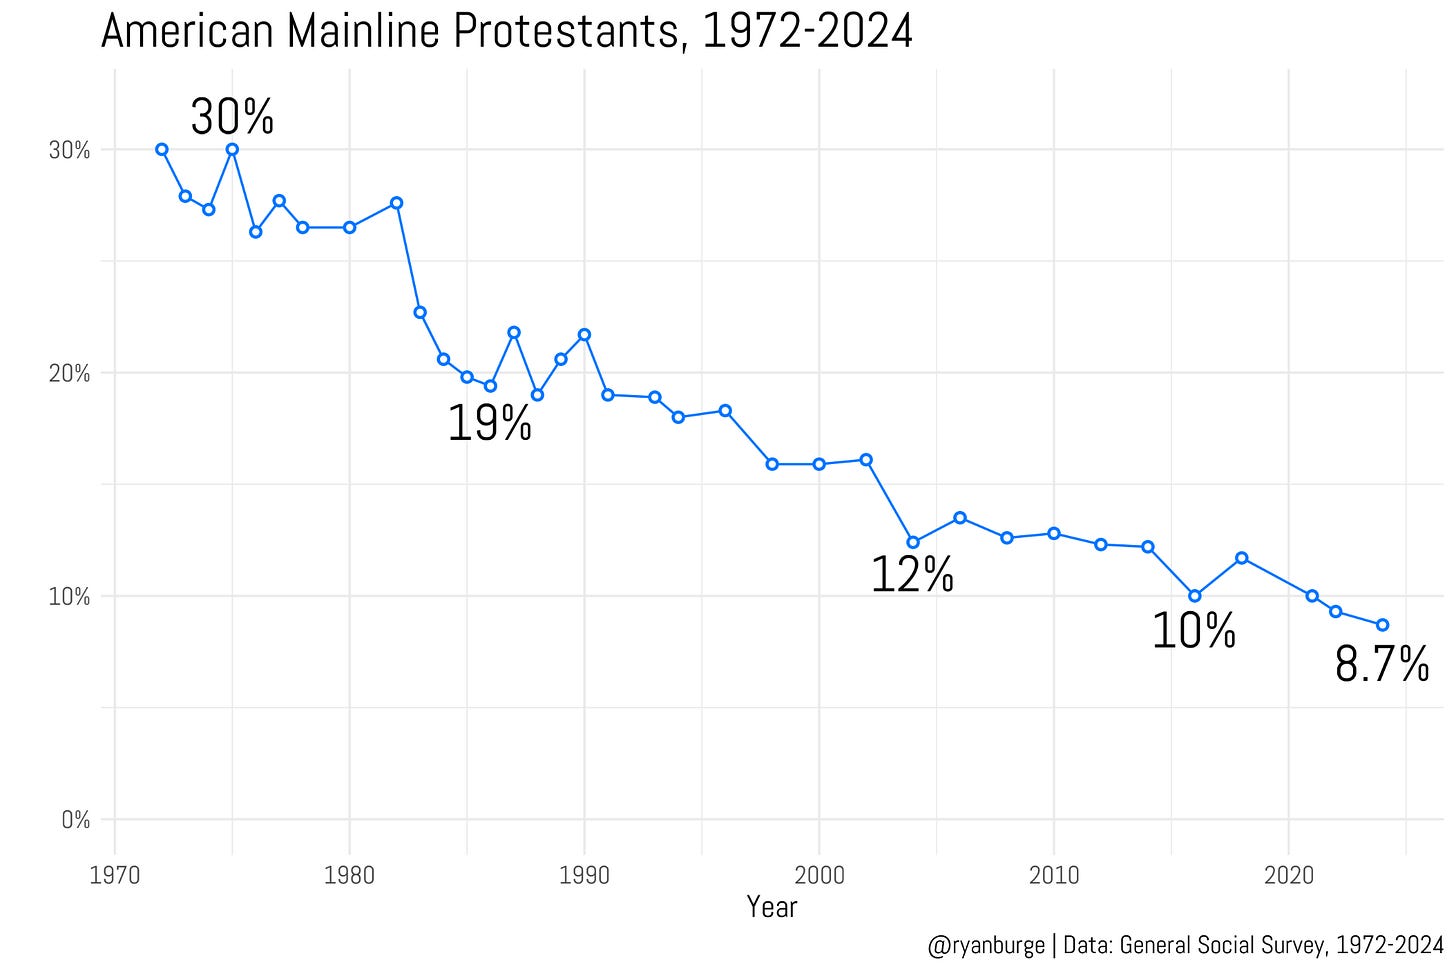
The mainline graph looks completely different, of course. There are no “up and down” macro-level swings here — it’s a steady, unmistakable slide downward. In the 1970s, mainline Protestantism was the largest religious tradition in the RELTRAD scheme by a wide margin. In 1975, they made up about 30% of the sample. No other group has hit 30% in the last half-century. But that dominance didn’t last long.
I really need someone to write a book about what on earth happened to the mainline between 1982 and 1988, when their share dropped from 26% to 19% in just a few years. Through the early 1990s, they hovered around that level before gravity took over again and the decline resumed — steady, methodical, and unrelenting. By 2004, the mainline was down to about 12% of the population.
The last few years have done nothing to reverse that trend. The 2016 estimate was just 10%, which repeated in the 2021 data. In 2022, the mainline share slipped to 9.5%, and in 2024 it fell again to 8.7%. I don’t know why I have to keep writing this, but there’s still absolutely no evidence of a mainline resurgence. If this trajectory continues, they’ll be under 5% of the population within the next decade.
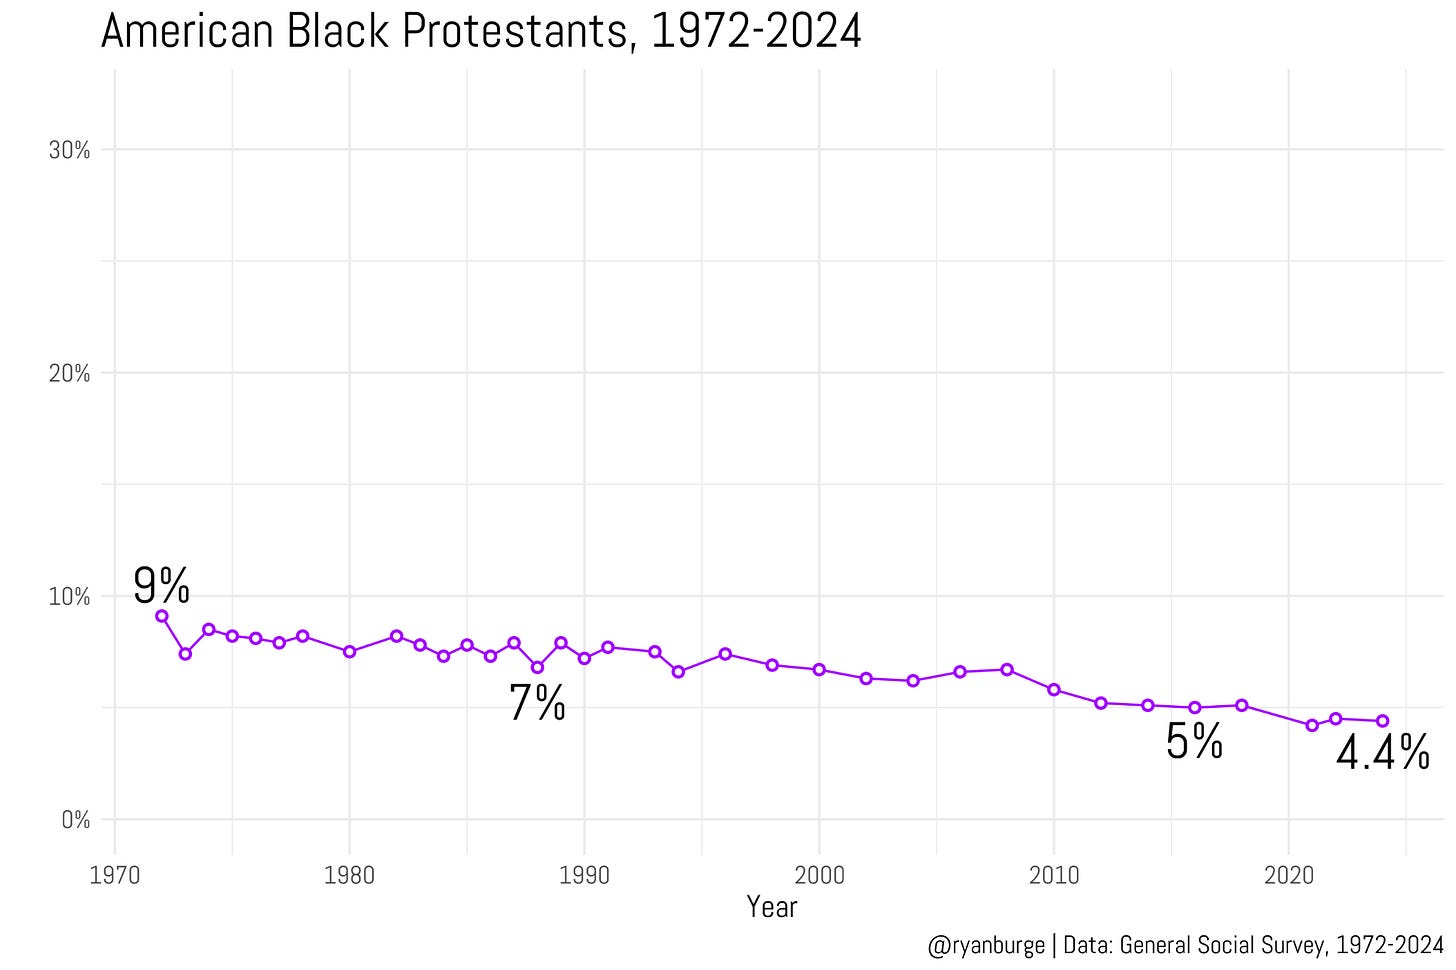
What about Americans who are part of historically Black traditions like the African Methodist Episcopal Church or the Church of God in Christ? I don’t know how many different ways I can say this — it’s a glacial, one-directional movement toward decline. In the earliest years of the GSS, about 9% of respondents identified as Black Protestants. But that didn’t last long; the share had fallen to 7% by 1990.
Over the next two decades, the line barely moves — which is, in itself, remarkable. By the 2010s, the Black Protestant share had slipped to around 5%, and in the most recent estimate it’s just 4.4%. That figure has been basically flat across the three waves of GSS data collected since COVID.
The headline here is simple but striking: the percentage of Americans who are Black Protestants has been cut in half over the last fifty years.
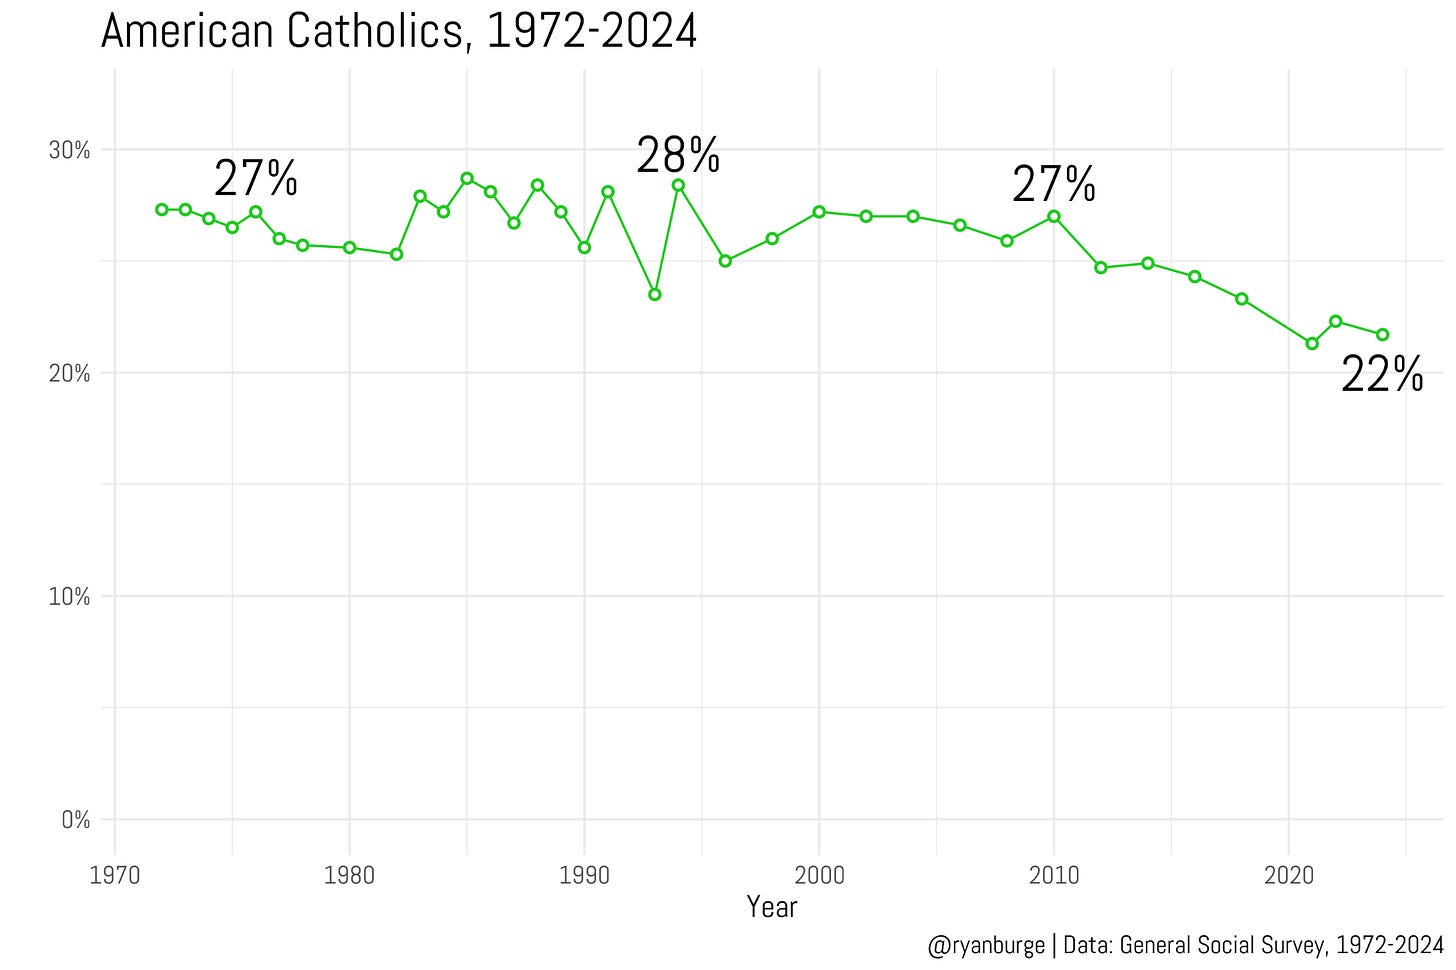
The trajectory of American Catholics really looks like two distinct phases to me. The first spans most of the time series — from 1972 through about 2010. The estimates bounce around a bit, usually landing somewhere between 26% and 28%. Every once in a while, the number dips below 25%, but it always rebounds quickly. In fact, from 2000 through 2010, the Catholic share of the population held almost perfectly steady at 27%. Not much to debate there.
But over the last twenty years, it’s fair to say that Catholics have been in decline. They made up 25% of the sample in both 2012 and 2014, but the number started slipping after that. By 2021, the GSS found that just 21% of Americans identified as Catholic. In the most recent waves, that figure has hovered around 22%.
So in the broad sweep of the last five decades, it’s accurate to say that Catholics are down about five percentage points from their historical baseline.
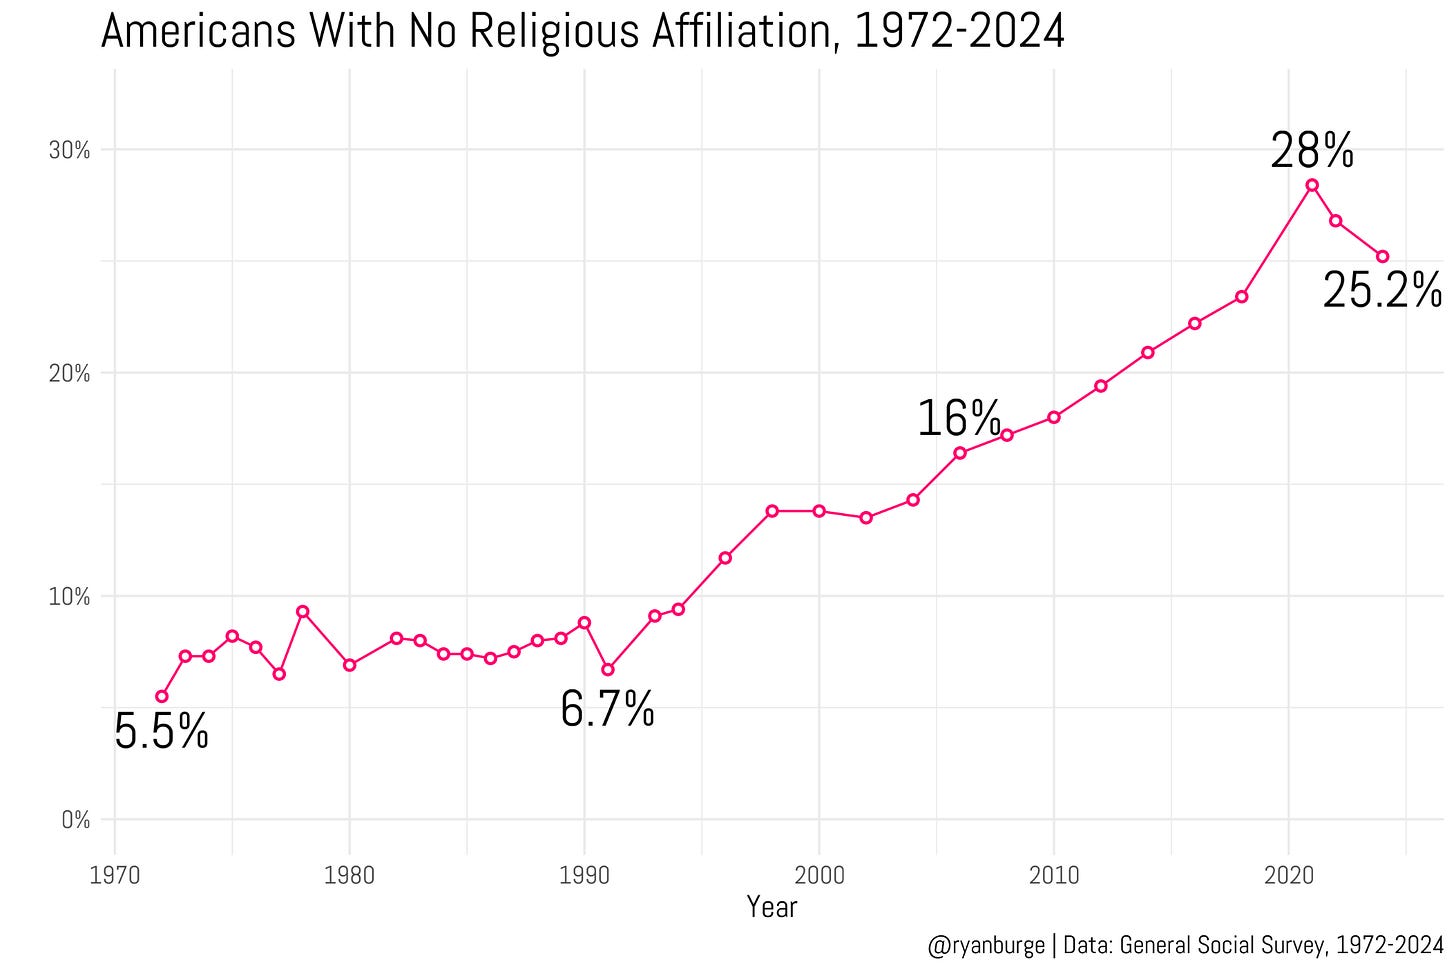
Now, what about the non-religious? This is the graph that’s going to grab all the headlines.
It’s no exaggeration to say that this single graph might be the most important one I’ve made in my entire career. It’s the same one that launched my first truly viral tweet back in March 2019. That version only ran through 2018, but the story since then has gotten even more interesting — and a bit more complicated.
In 2018, about 23% of American adults claimed no religious affiliation. That was higher than the share of evangelicals or Catholics, and that one data point was what sent my tweet viral. But by 2021, the share of nones had shot up to 28%. Here’s where I have to add a big asterisk: everyone I talk to about this has serious reservations about the 2021 data. Because of COVID restrictions, the NORC team had to shift from in-person interviews to online surveys — and that transition wreaked havoc on the data.
The good news is that the last two waves of the GSS have settled back into a more predictable rhythm. In 2022, the share of nones fell to 26%, and in 2024 it slipped again to 25.2%. That’s only about a point and a half higher than the 2018 estimate. Which raises a fascinating question: have we already passed “peak none”?
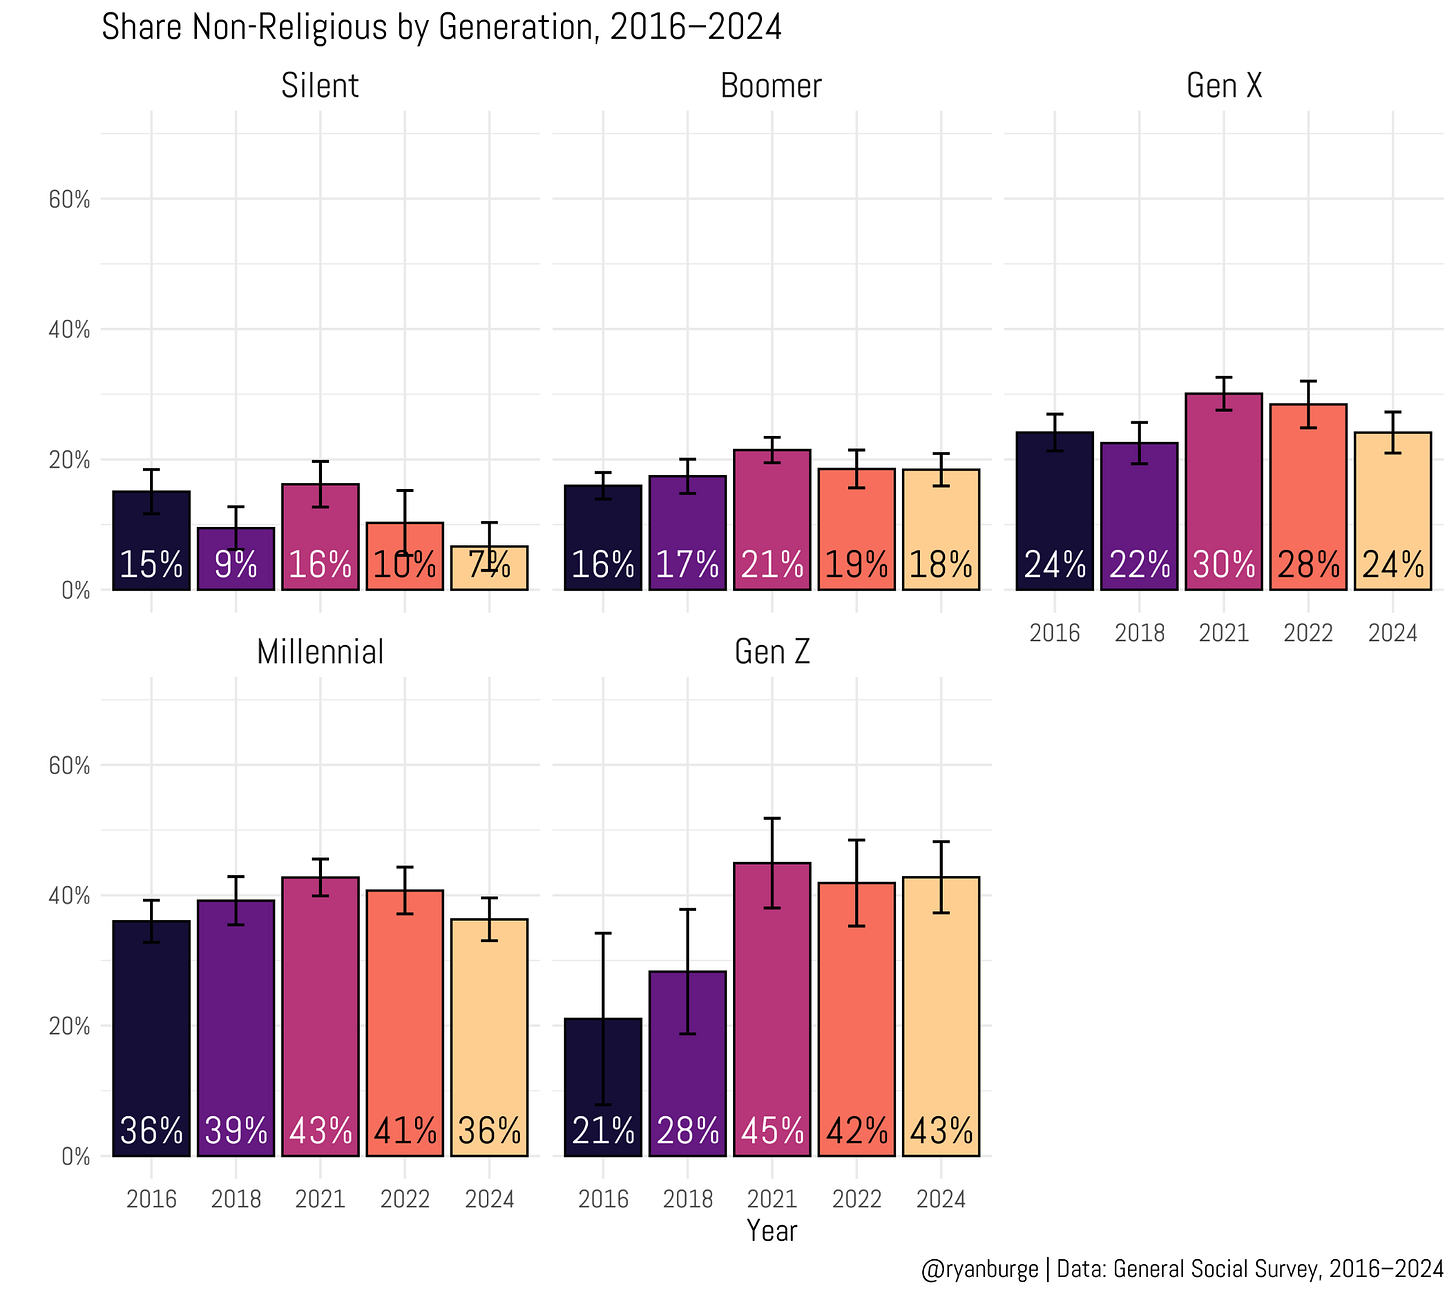
Let’s peel back that question a bit by looking at how each generation has identified religiously across the last five waves of the General Social Survey, beginning in 2016.
Among Baby Boomers, the takeaway from the graph is clear: the share of nones hasn’t budged in any meaningful way between 2016 and 2024. The point estimates were 16% and 18%, respectively — a difference that isn’t statistically significant. Among Gen X, it’s even flatter. The share was 24% in 2016 and 24% again in 2024. And guess what? The same story holds for Millennials. In both years, 36% of them reported no religious affiliation. That’s some strong empirical evidence that America isn’t any more secular today than it was when Donald Trump was first elected.
But let’s linger on Gen Z for a moment. Those first two data points from 2016 and 2018 are a little shaky because of small sample sizes, but things have clearly stabilized in the last three waves. Across those, the share of Gen Z who identify as non-religious has held steady at around 43%.
So, does that mean the rise of the nones is over? Absolutely not. Not even close. Here’s the key point: the reason the overall share of nones has dipped slightly in the last few years is because Boomers, Gen X, and Millennials have stayed flat. The non-religious share rose through 2021 and then ticked down a bit — but there’s a structural force at work that guarantees this story isn’t finished.
It’s the simple, unglamorous truth that older people die. The Silent Generation will be entirely gone within the next decade, and the oldest Boomers will begin aging out in the decade after that. Those older Boomers are only about 15% non-religious. Meanwhile, the cohort replacing them — Gen Z — is at least 40% nones.
That’s what demographers call generational replacement, and it’s one of the most powerful forces in population change. So what would it take for the share of nones to stay at 25%? It would require about 10% of Millennials — roughly eight million people — to return to religion. And another 15% of Gen Z, which would mean another ten to twelve million people, doing the same.
If 20 million younger adults suddenly started identifying with a faith tradition, that would be nothing short of a Third Great Awakening — a revival on a scale the United States hasn’t seen in 150 years. And remember, that would only hold the line at 25%.
It’s fun to talk about hope. It’s not as fun to talk about math. Sorry to spoil the party.
Code for this post can be found here.
Ryan P. Burge is a professor of practice at the Danforth Center on Religion and Politics at Washington University.



I read this latest posting and wonder if young people having children will encourage some of the nones to seek some sort of religious affiliation for the sake of their kids. I am curious about if nones get married, if they get married in a church and if they baptize their kids for perhaps the sake of their own parents and how this compares to various faith traditions.
I once had a friend from the WW2 generation who grew up in a family where his father was Jewish and his mother Lutheran. His mom told his father that perhaps we should give the kids some sort of religious exposure and it didnt matter to her if if was Jewish or Christian. His father responded that boxing lessons would serve him better. But of course that was quite a long time ago.
It would be really good to have the default presentation in terms of 5-year cohorts rather than spurious "generations". That's particularly true given the absence of any obvious distinctions between "Millennials" and "Gen Z", other than the fact that, by definition, Millennials are older