

Faith and the Voting Booth: How Trump's Approval is Trailing the 2024 Vote Share
And the biggest slippage is among his most fervent supporters.


A quick plug: The Danforth Center on Religion and Politics at WashU has released a free public lecture course called 1776, Then and Now for the 250th anniversary of the founding. Big-name scholars (Danielle Allen, Eddie Glaude Jr., and more) on the Revolution and why it still matters — including a whole section on religion, secularism, and religious liberty in the founding era (lead by some of my esteemed colleagues at the Danforth Center). Worth your time.
“I don’t particularly like Donald Trump; I just voted for him because I really didn’t like the alternative.” That’s a comment that I feel like I hear on a nearly weekly basis in various environments. It’s usually during the Q&A portion of a talk about my newest book—The Vanishing Church. I totally understand what that person is trying to articulate, by the way: American electoral politics is a “this or that” phenomenon. If your disdain for Candidate A is an 8/10 and it’s a 7/10 for Candidate B, then the second person is probably going to begrudgingly get your vote when you walk into the voting booth. It’s just the nature of our “winner-take-all” system.
I also think that our binary choice drives this much bigger issue in American politics: affective polarization. This is the idea that a growing number of Americans feel negatively toward the other party not because of their policy positions on things like healthcare or immigration, but simply because they are the other party. It’s the “Cry more, libs” approach for Republicans. A Democrat will demonize or mischaracterize the other side of the argument because this helps them justify their own voting choices. It really goes both ways.
Biden's Approval Rating Among Religious Groups in 2023

One thing I try my best to avoid is posts that are just big dump of graphs that are repetitive. I think that social science, at its best, is story telling with better methods. We have a question, we have data, we have the tools to analyze that data, and it helps us understand the world around us. All good dissertations start with a puzzle and end with a resolution.
But now that we have data from the 2025 Cooperative Election Study, we can actually dig into how vote choices are relating to approval ratings of Donald Trump.
Let me start by just showing you the most basic analysis - here’s Trump’s approval rating in October of 2025 across a whole bunch of different religious groups.
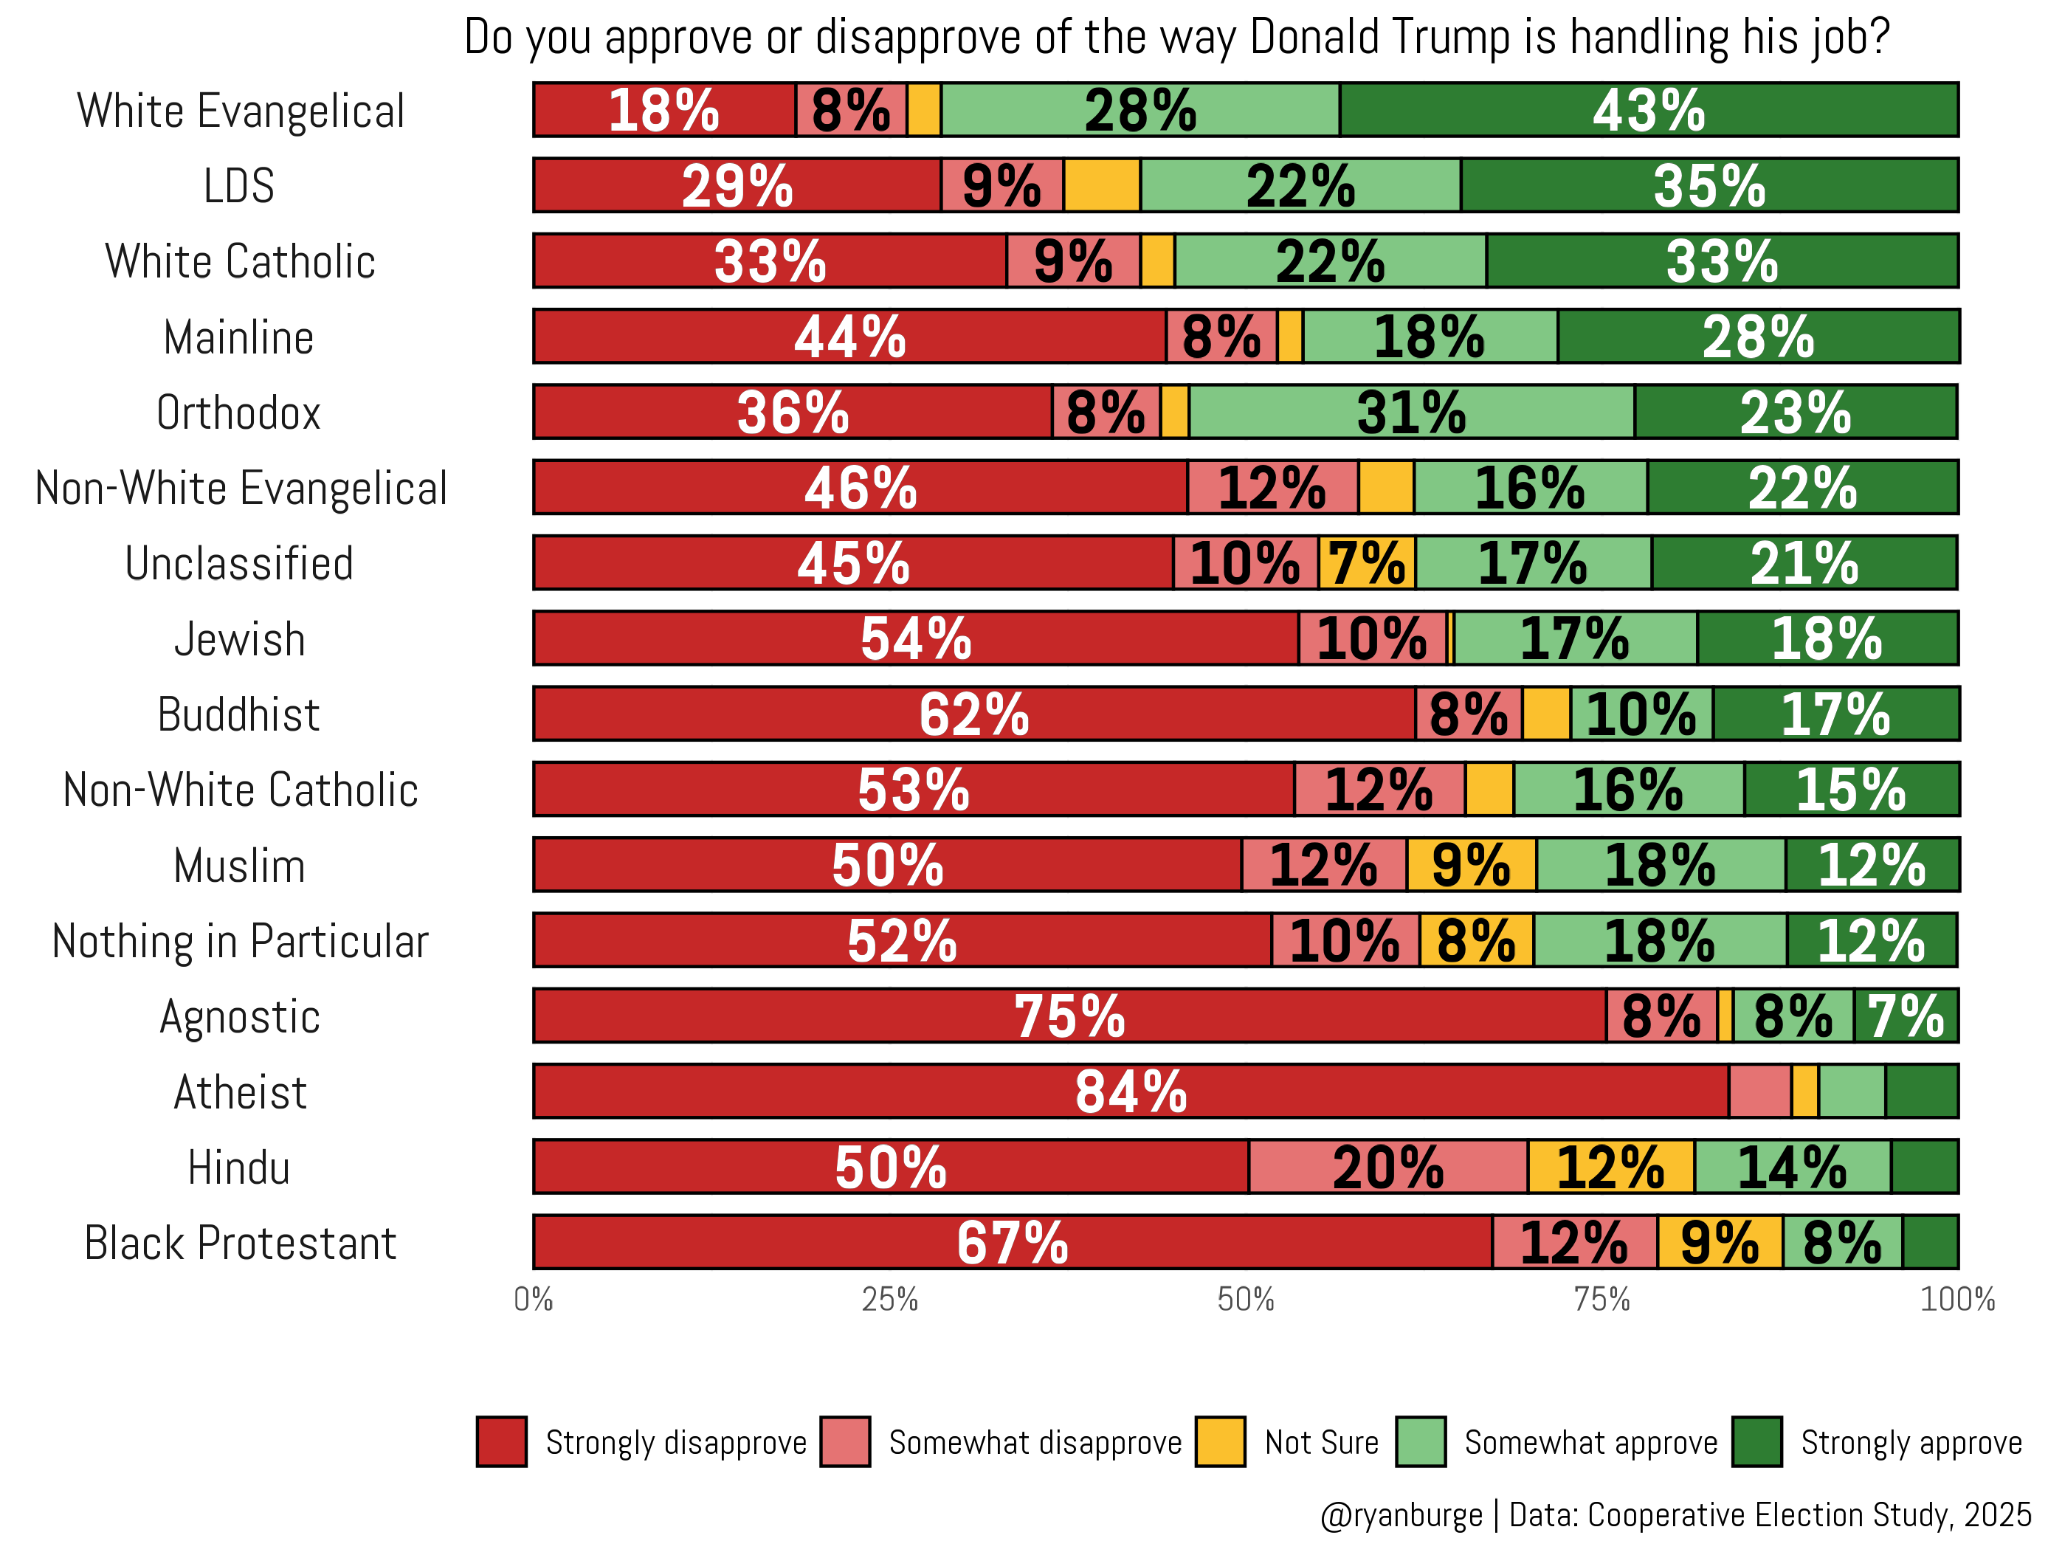
I sorted these traditions in terms of the ones that were the most approving of Trump up top and those who didn’t like him as much near the bottom. You can pretty easily ascertain which groups are the most MAGA. Among white evangelicals, 71% said that they somewhat or strongly approved of his job performance. Next in line were Latter-day Saints at 57% job approval, followed closely by white Catholics at 55%. There was only one other group where Trump was above water: Orthodox Christians with a 54% approval rating. I mean, it doesn’t take a lot of deduction to figure out the common thread among the groups I just listed: white and Christian. That’s Trump’s base. It’s always been that way.
But he’s underwater with all kinds of other religious traditions. Among mainline Protestants, disapproval was 52% and approval was 46%. His standing with non-white evangelicals is twenty points underwater. It’s even worse with non-white Catholics: 65% disapproval against 31% approval. It’s pretty apparent from this that Trump is just not doing well with non-white voters. I mean, 79% of Black Protestants disapproved of his performance.
However, he is also doing incredibly poorly among non-religious voters, too. For atheists, strong disapproval is a whopping 84%. It’s just slightly better with agnostics: 75%. The “nothing in particular” crowd is 30% approval/62% disapproval. That’s pretty terrible, to be honest.
For a baseline, the full sample was 55% disapprove and 40% approve. Things are not going well for the second Trump administration.
I wanted to see what religious groups tended to have the most regrets about a Trump vote. To do that, I plotted two things: approval from 2025 and then vote choice from 2024 for all sixteen groups. The line below is helpful because any groups to the right of that line are folks whose approval of Trump is lower than his vote share.
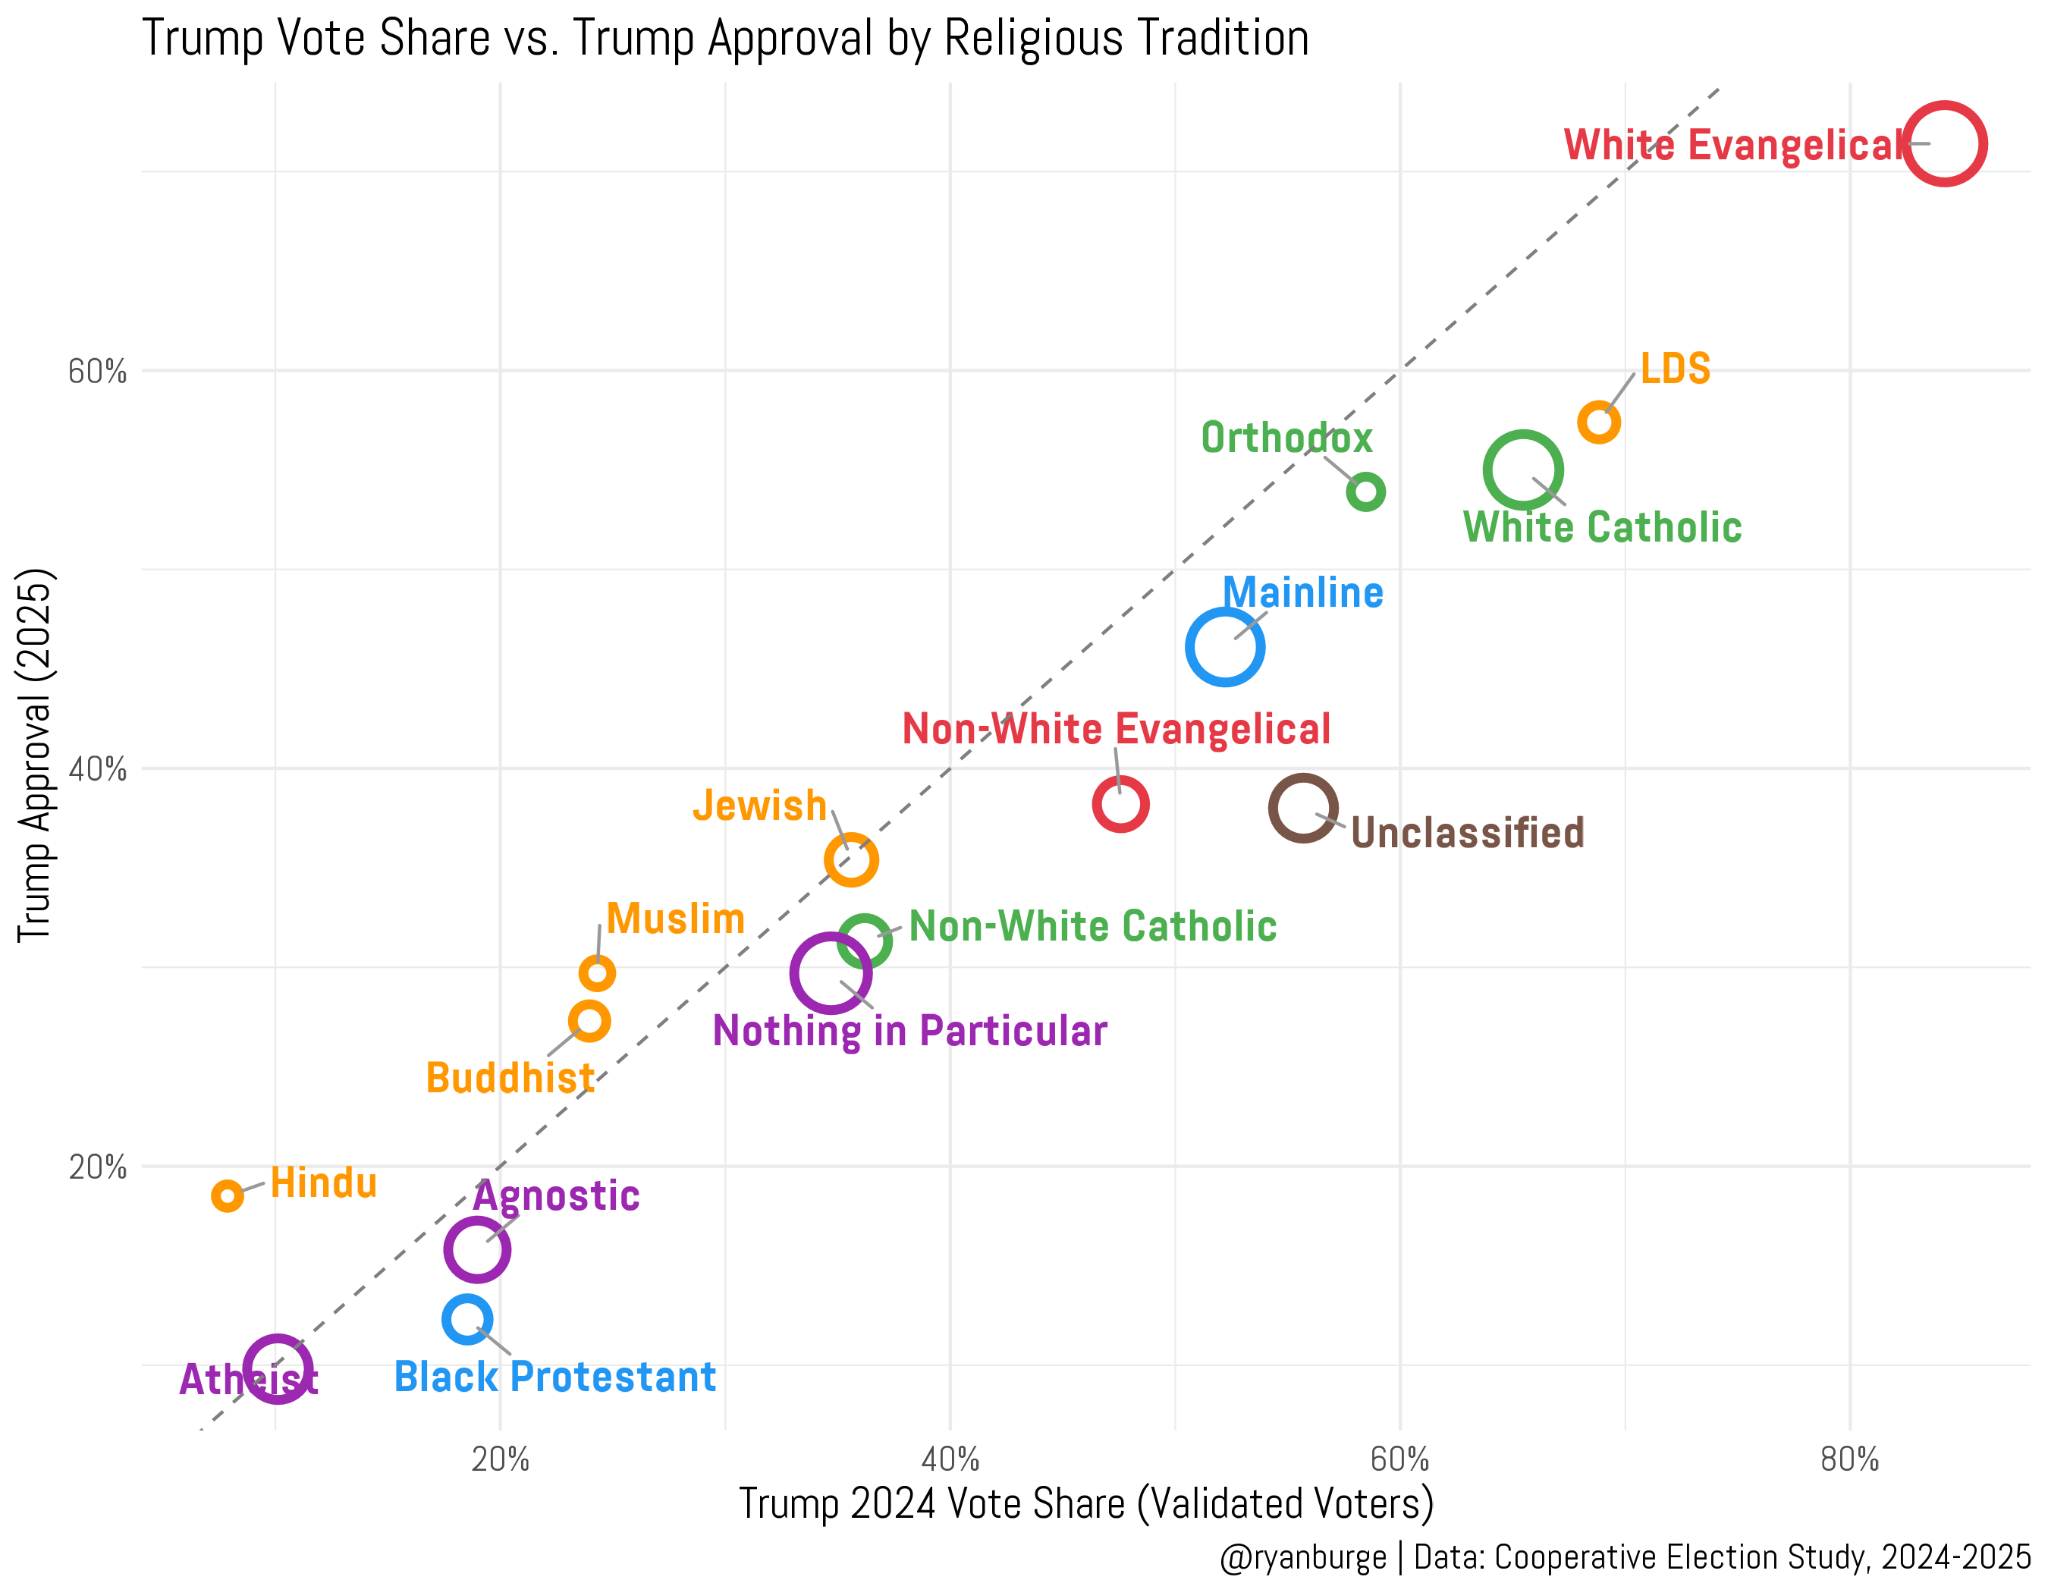
The group that deviates the furthest from that line? Surprisingly, it’s white evangelicals. He earned about 84% of their votes in the 2024 election (voter validated), but then his approval rating in 2025 had slipped to just 71%. That’s a fourteen-point slide in just about a year in office. There are a couple of other groups with a double-digit difference here:
Non-white evangelicals: 48% vote share vs. 38% approval
White Catholic: 65% vote share vs. 55% approval
Latter-day Saint: 69% vote share vs. 57% approval
It’s pretty clear to me that Trump did lose quite a bit of ground with some groups that made up the core of his coalition.
But for the rest of the groups, the differences between vote choice in 2024 and approval in 2025 are pretty small. It’s about five points for non-white Catholics. Just 3 points for agnostics, and for atheists, there’s no difference at all: 10% of them cast a ballot for Trump in 2024 and his approval rating in 2025 was 10%.
Notice just a handful of groups that are to the left of the line—these are folks who have a higher approval of Trump in 2025 than vote share in 2024. It’s three groups: Muslims, Buddhists, and Hindus. The biggest deviation is Hindus: he got 7.8% of their votes in 2024 and his approval rating was 19% with this group a year later. But we really need to mind the sample size issue: it’s just 57 respondents in 2025. It’s less than 100 Muslims, too. So we shouldn’t make too much hay about this.
I wanted to dig down one layer on some of these larger groups to try and sort out which factors are driving down Trump’s approval ratings. To start with, I just zeroed in on the age of the respondent. I wanted to know if it were younger white evangelicals who were souring on Trump faster than their older counterparts.
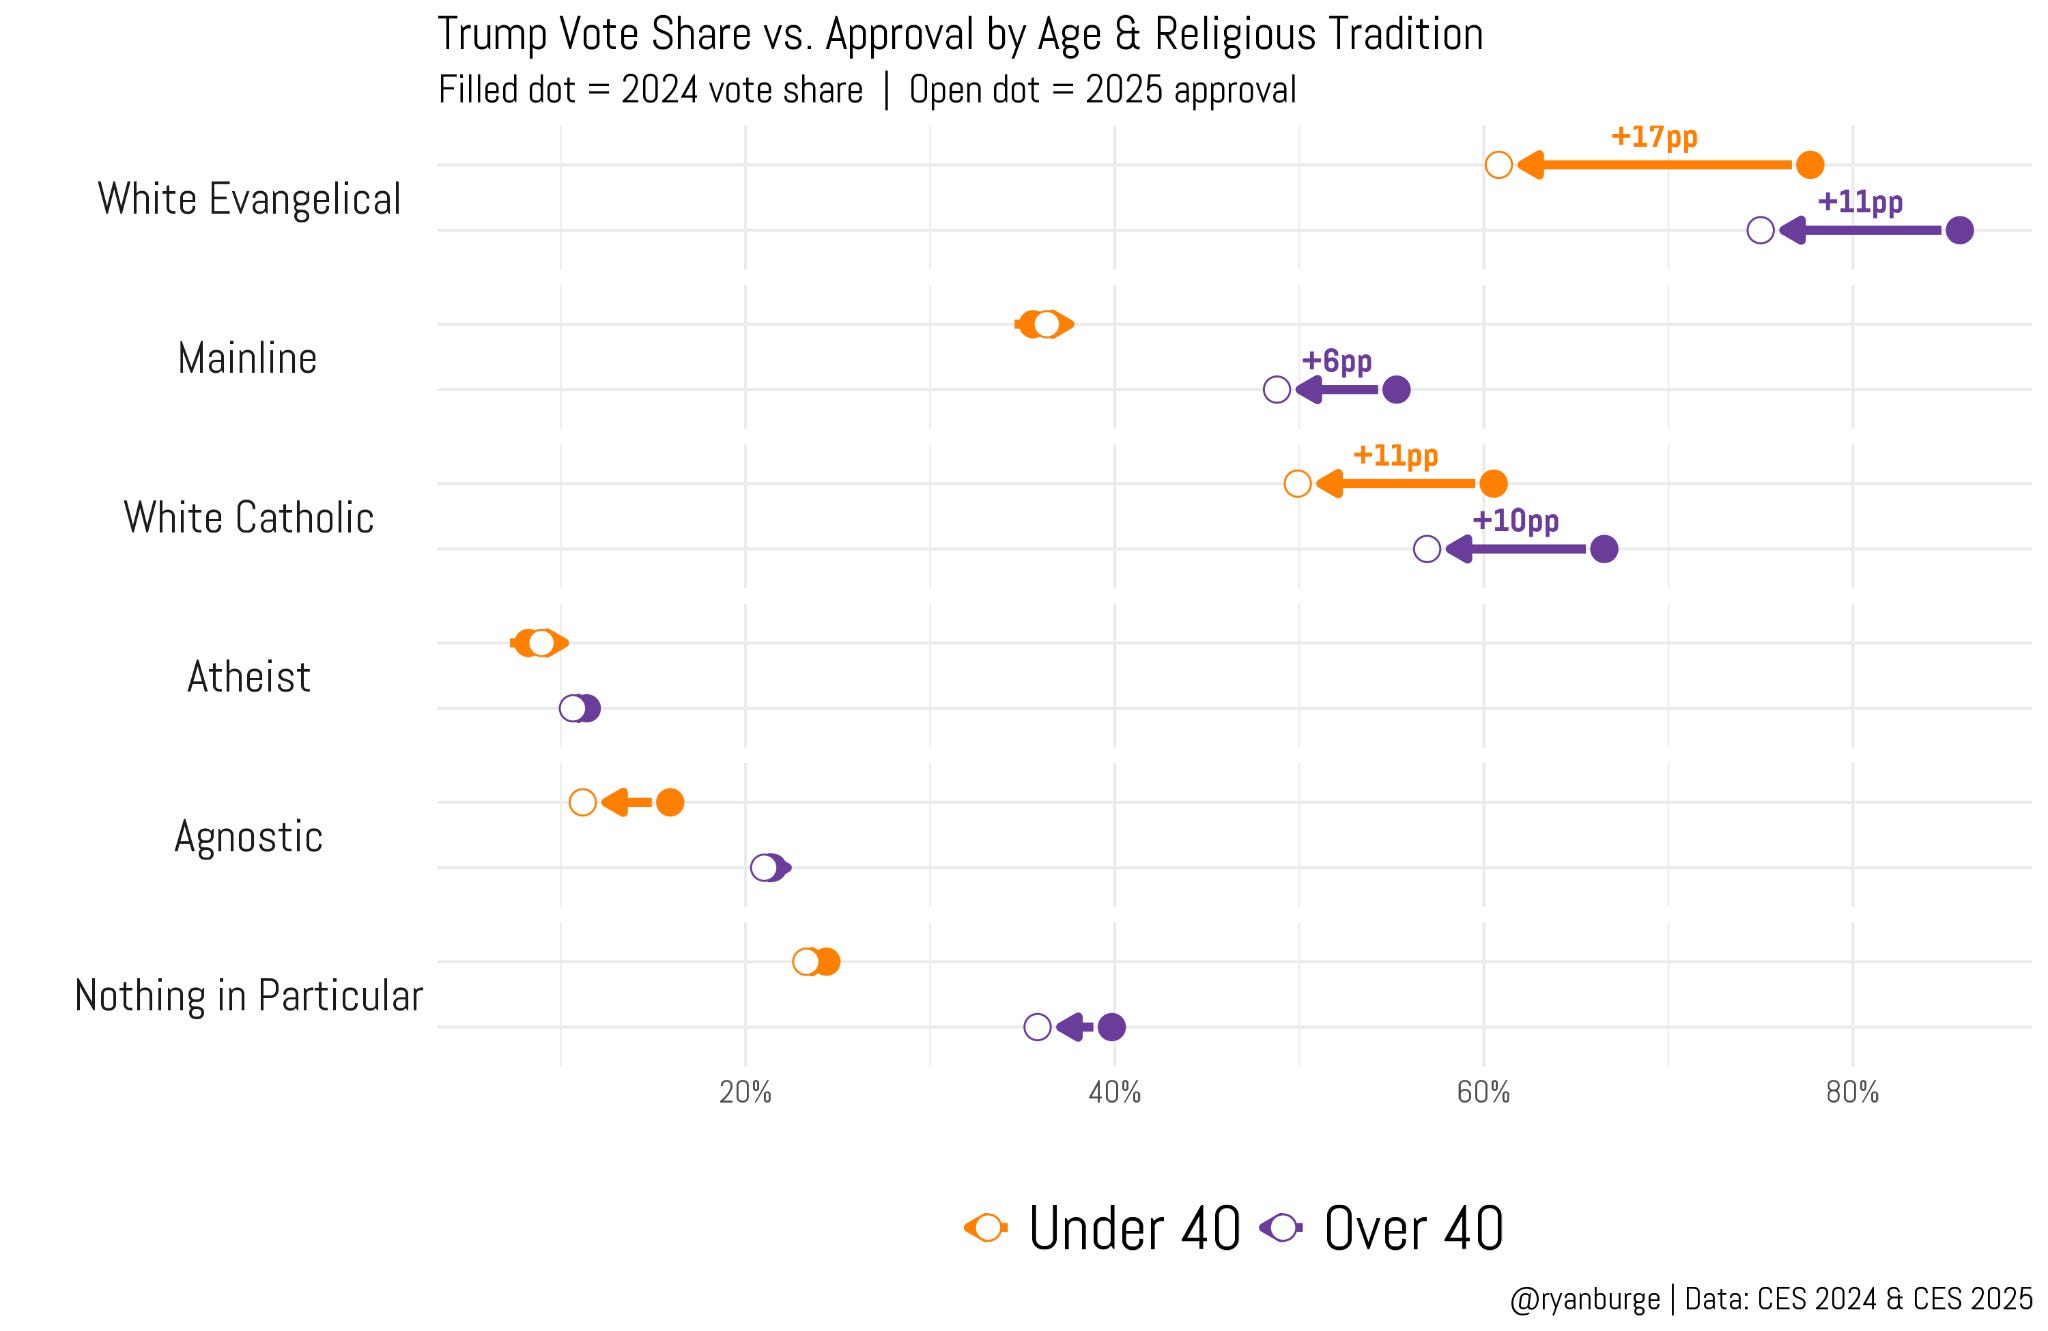
That’s exactly what the data indicates. The biggest divergence between vote choice and approval rating is among white evangelicals who are under the age of 40. In 2024, nearly 78% of this subgroup were Trump voters. But in 2025, Trump’s approval rating was 61% among this same group. That’s a seventeen-point slide. Among older white evangelicals, the difference is smaller but still significant: 86% down to 75%. That’s an eleven-point drop in just a year. That’s a really consistent finding here: white evangelicals were near-unanimous supporters of Trump; however, they aren’t quite as enamored with him now.
There are also a few other instances of a drop, most notably among white Catholics. Among the younger set, his approval rating stands at exactly 50% in 2025, while 60.5% supported him in the 2024 race against Kamala Harris. For older white Catholics, it’s a slide from 66.5% vote share to 57% approval. So, it doesn’t look like Trump is doing well among the two largest white Christian groups regardless of age.
There’s not much worth pointing out among the other subgroups. One interesting finding: older mainliners have slid 6 points away from Trump. We just don’t see anything notable among the “nones,” though.
What about if we break down the larger Christian groups by level of attendance?
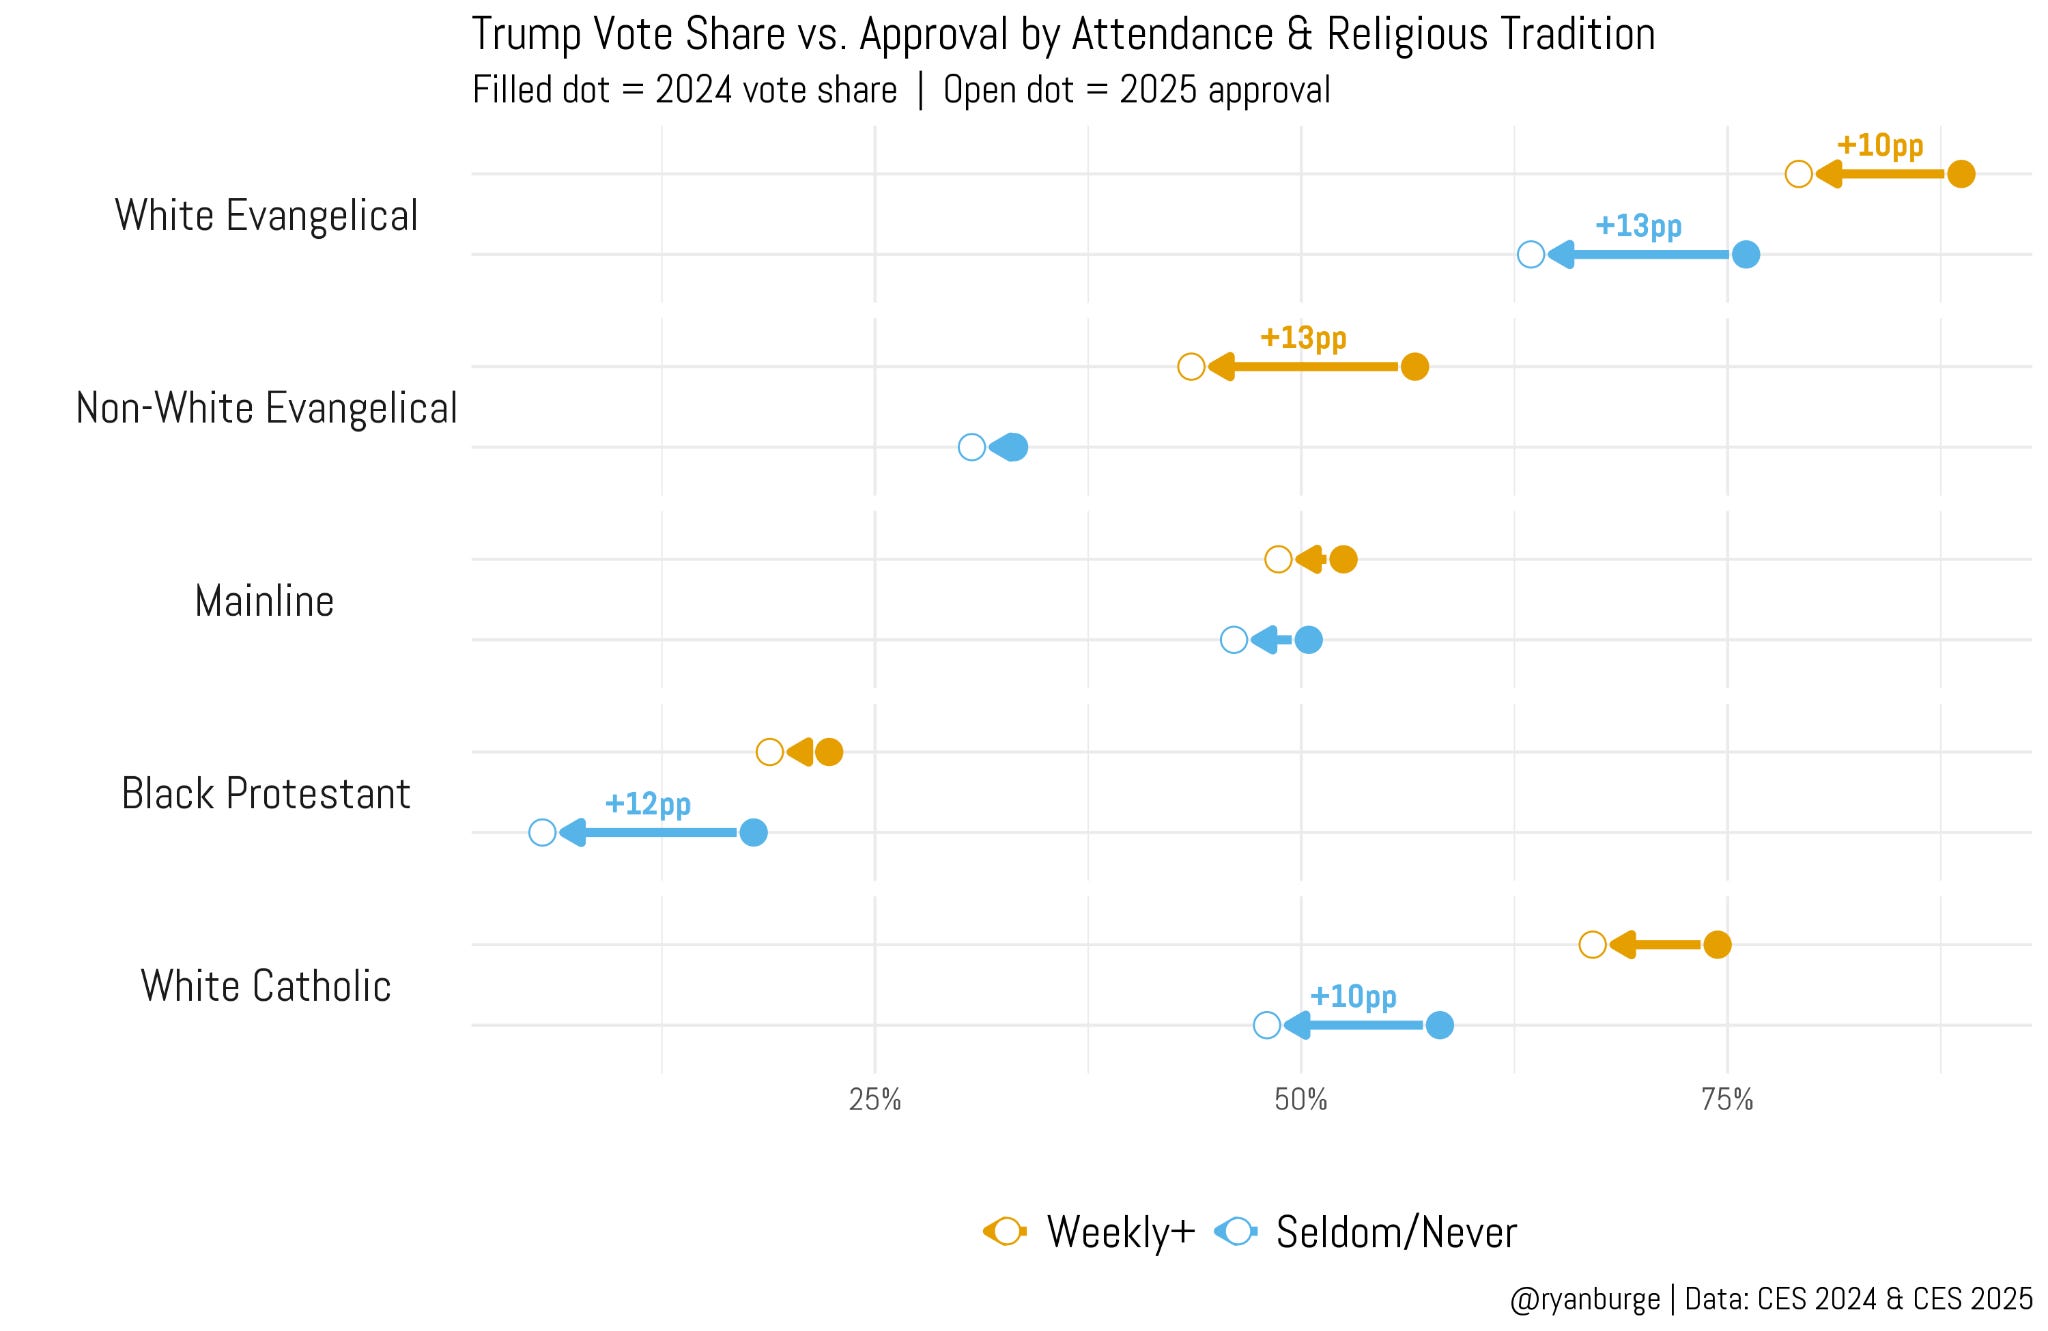
Again, those white evangelicals have slid away from Trump in a noticeable way. That’s true for those who are going to church on a weekly basis as well as those who are seldom/never attenders. The magnitude of the move is nearly the same, as well: ~12 percentage points. What’s really interesting is how non-white evangelicals who go to church a lot have really turned against the president. He earned nearly 57% of their votes in 2024, and his approval rating was down to 44%. There’s been no real movement among non-white evangelicals who don’t go that much.
Two other results are worth flagging. Trump has lost a dozen points among Black Protestants who don’t go to church that much (but it’s not like they were big fans of his anyway). But the white Catholics who don’t go to Mass that much represent a much more consequential result. Among this group, a strong majority favored Trump in 2024: 58%. But his approval rating was down to just 48% in 2025. This is not a small group, either: 5% of all Americans are white Catholics who rarely go to Mass. That’s about the same size as atheists.
Now, here’s a fun question: is Trump doing that much worse nine months into his second term compared to the same period back in 2017? We can check that really easily using the Cooperative Election Study.
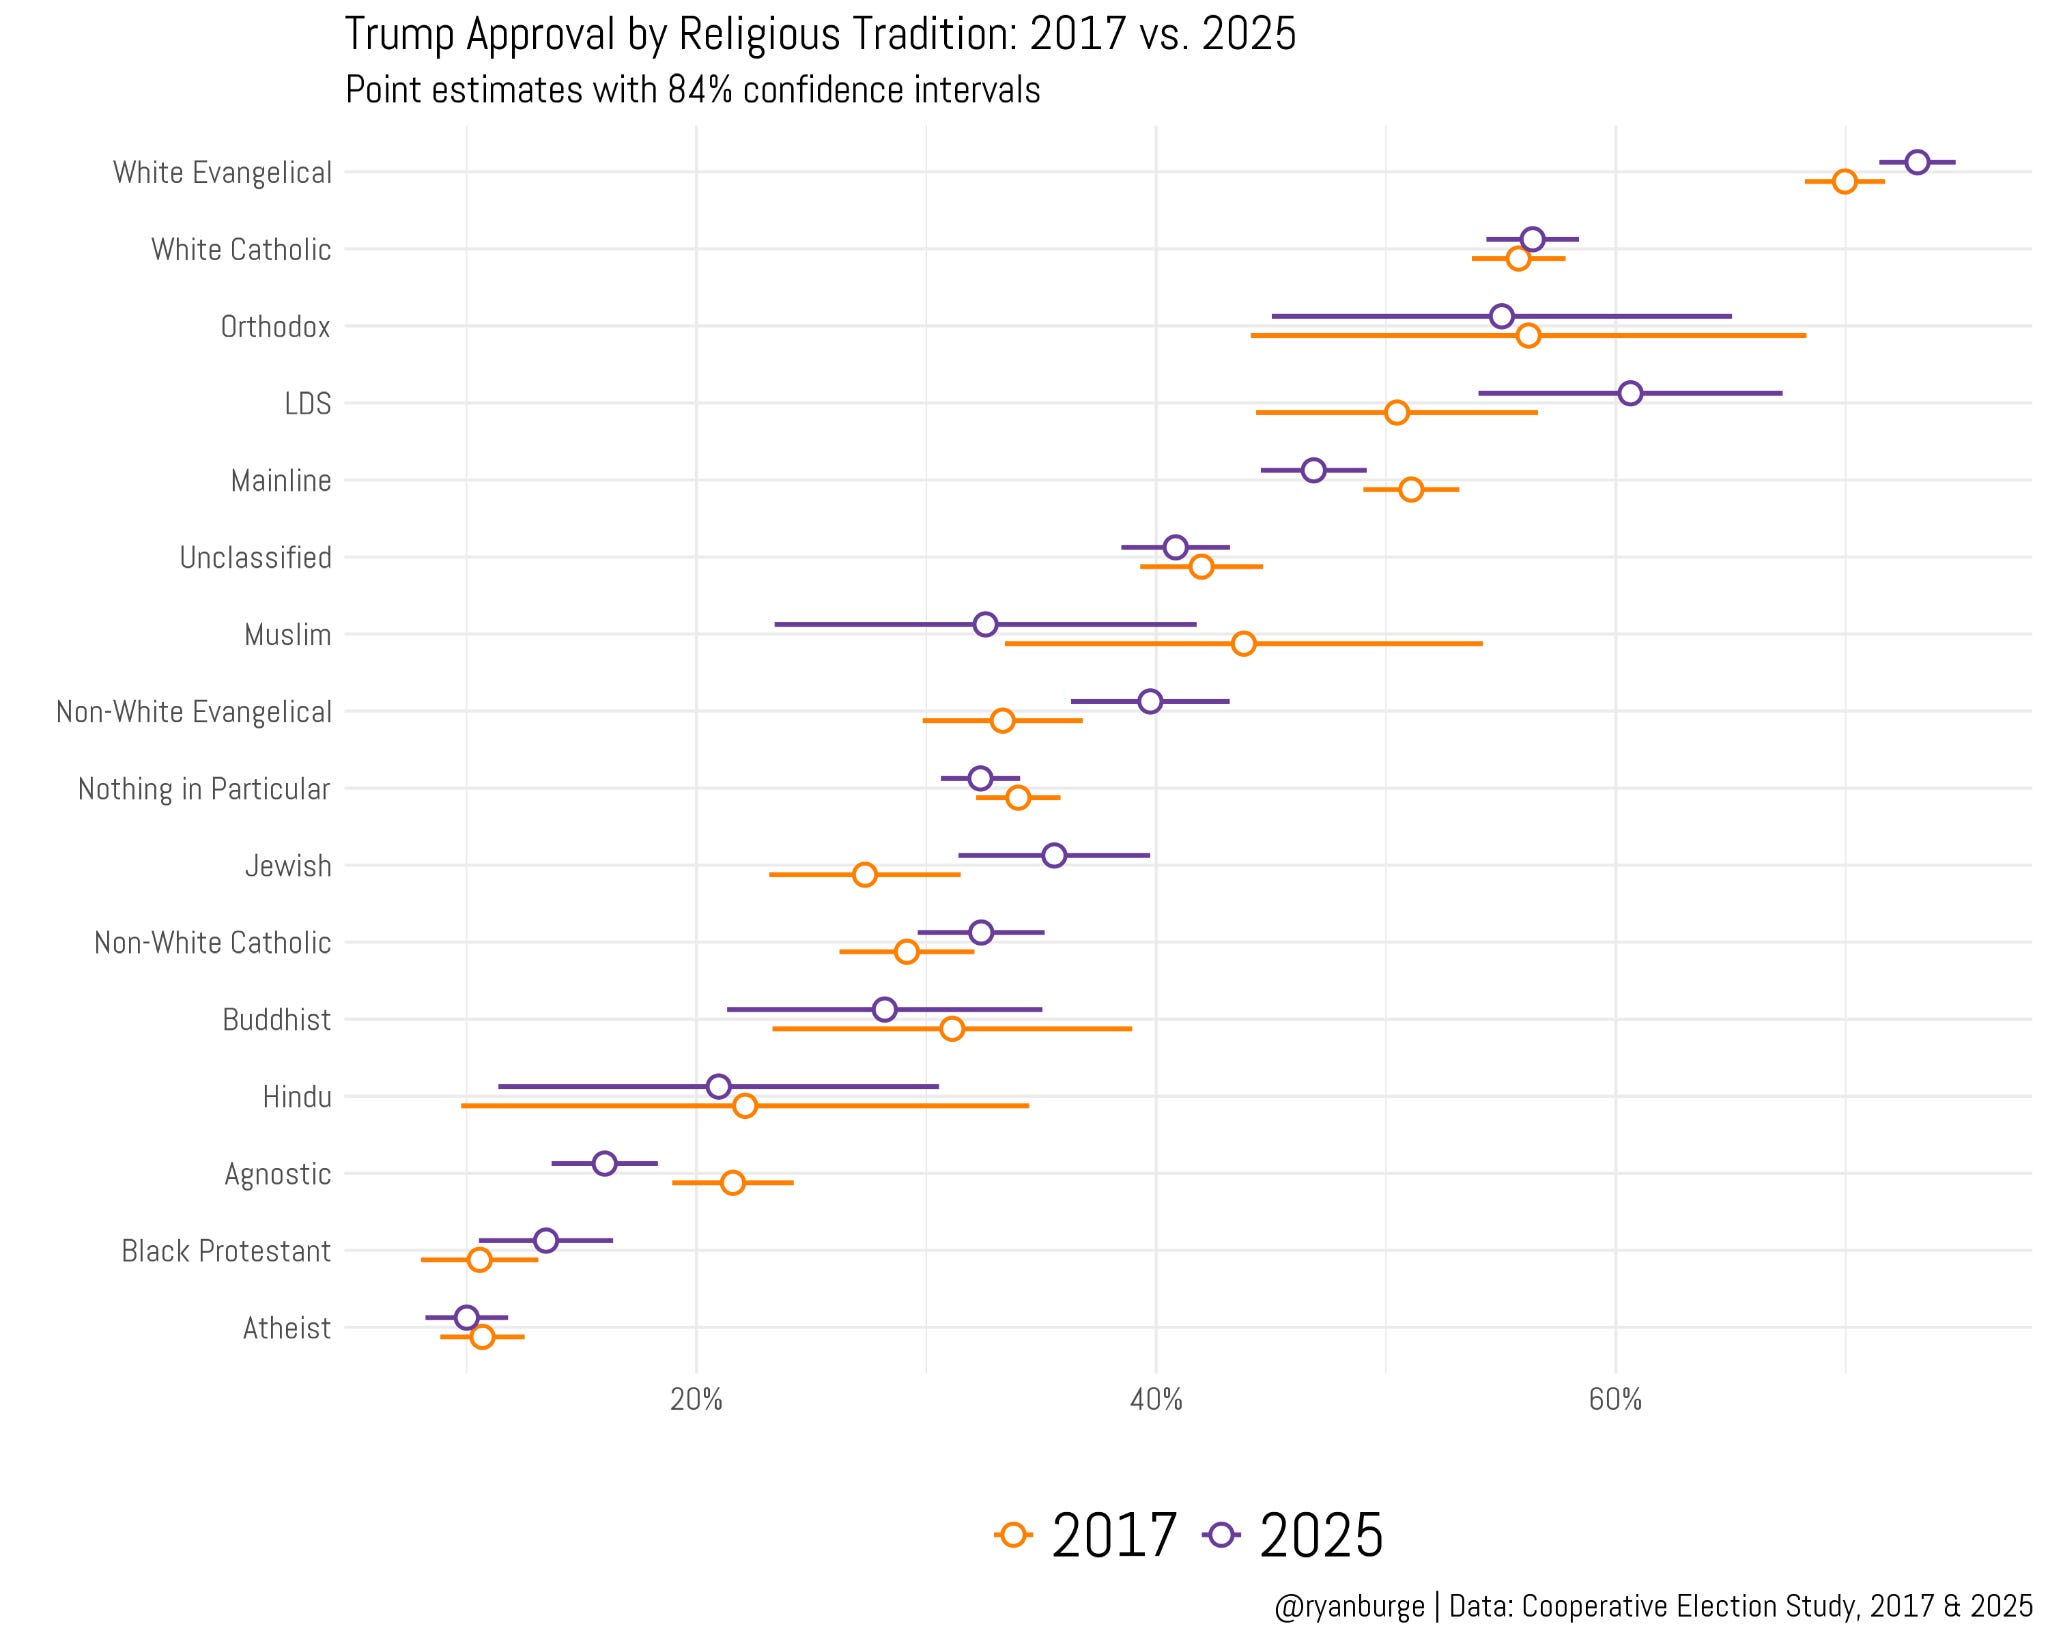
The answer is unequivocal: nope, not in any meaningful way. If I plot mean approval in 2017 and 2025 and add in those confidence intervals, what you see is a whole bunch of overlap between the two estimates. For many groups, the actual percentage differences are so small it’s hard to even see them on the graph. That’s the case for huge groups like white and non-white Catholics, “nothing in particulars,” atheists, and Black Protestants.
Now there are a handful of groups where the differences get outside the margin of error. For instance, Trump’s approval rating among white evangelicals was 70% in 2017. It was 73% in the 2025 data. That’s outside the margin of error, but is it substantively significant? I think we can debate that point. You can see that mainline Protestants are a bit less warm toward Trump in 2025 compared to 2017 (47% vs. 51%). There’s also been some movement in Trump’s direction among Jews, too: 27% vs. 35%. Agnostics have moved five points in Trump’s direction.
However, looking at all of this broadly I just don’t think that I can make a strong claim here that Trump is doing particularly worse in 2025 compared to 2017.
I thought I would end this by building a table that has a couple key metrics: Trump’s vote share in 2016 and 2024, along with his approval in 2017 and 2025.
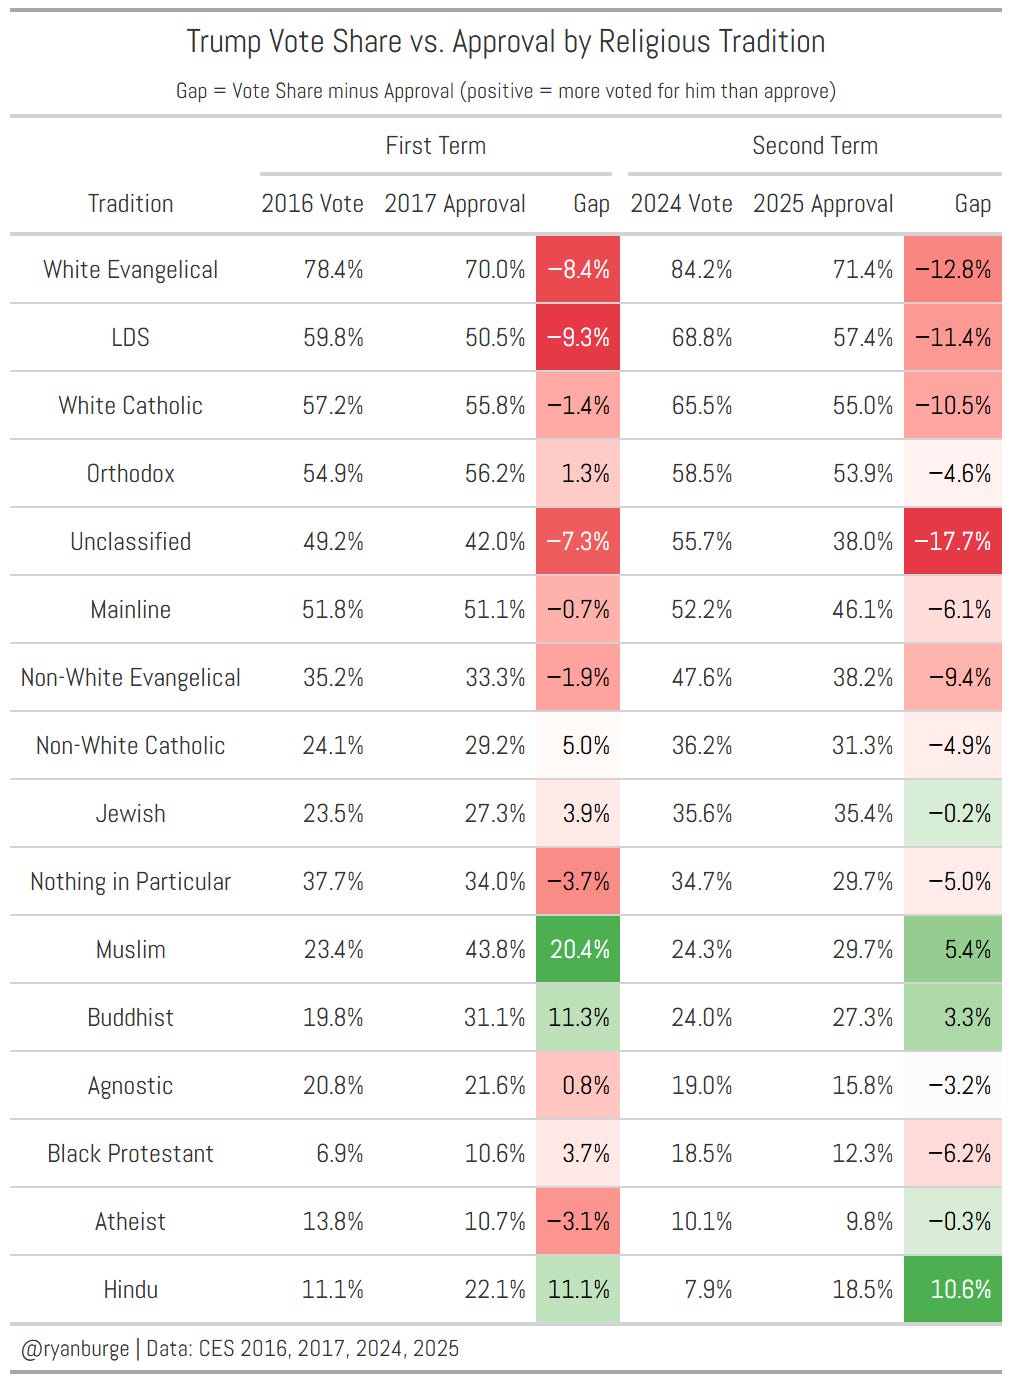
I think the most helpful way to look over this data is comparing the gap in 2016/2017 vs. the gap in 2024/2025. For white evangelicals, there’s been more movement away from Trump in 2025 compared to 2017: 13 points vs. 8 points. The difference for white Catholics is even larger, though. In 2016/2017, the difference was nearly zero. In 2024/2025, it was 10.5 points. That’s entirely because of a shift in vote choice, not approval, among this group.
The Religious Composition of the Political Parties Over the Last 50 Years

American religion is shifting rapidly now. The nones are climbing every single year. Mainline Protestants are losing ground day by day. And evangelicals are still having a huge impact on American culture, religion, and politics. The purpose of this post is to give a broad overview of just how much the parties have shifted from the 1970s through today.
The movement among non-white Catholics is also worth pointing out. During Trump’s first term, they actually warmed up to him in his first nine months in office (+5). That’s not what happened during Trump 2.0: he went five points the other direction. And the reason is exactly the same as it was for white Catholics: a higher share voted for him in 2024 compared to 2016, but his approval rating stayed about the same.
After looking over all of this, the impression that I get is that Trump’s approval nine months into each term is basically the same in 2017 vs 2025. The big difference? He won a bigger share of a lot of groups, but then they quickly seemed to regret their decision. That’s what is leading to the big erosion in Trump’s support between November of 2024 and November of 2025.
Code for this post can be found here.
Ryan P. Burge is a professor of practice at the Danforth Center on Religion and Politics at Washington University.

Great study Ryan. Thanks for the Danforth lectures, I will definitely watch those.
Your opening comments were more accurate than your conclusion. It’s not regret or a gap or a slide. It’s just that the democratic candidate was so bad in 2024 that more people who really don’t like or approve of Trump still voted for him because they dislike him less than they dislike the alternative.