

Does Religion Make You Happier? Yes, But So Does Money
And, Gen Z is truly miserable


This post has been unlocked through a generous grant from the Lilly Endowment for the Association of Religion Data Archives (ARDA). The graphs you see here use data that is publicly available for download and analysis through link(s) provided in the text below.
Measuring happiness is a real problem for social scientists. It’s an area of intense interest because I think all of us would like to be just a little bit happier. But it all seems pretty subjective and transient at some level, right? I mean, if you took part in a social survey that asked you: “Taken all together, how would you say things are these days — would you say that you are very happy, pretty happy, or not too happy?” How would you answer that question right now, and if asked again in four hours, would you give the same answer?
Take the often hyped-up “World Happiness Report,” published annually by Oxford’s Wellbeing Research Centre in partnership with Gallup. The report asks respondents to imagine a ladder with the best possible life at the top and the worst at the bottom, then place themselves on it. It’s elegant, but notice what it actually measures: not happiness in any rich sense, but a cognitive life appraisal. And each respondent is comparing their life to a “best possible life” that could be completely different from another respondent. When a Dane rates herself a 7.5, she’s not reporting a feeling so much as rendering a verdict. It’s a valid measure, certainly. But is it measuring the same thing as happiness? Are satisfied people always happy?
The report also tries to explain its rankings using six factors: GDP per capita, social support, life expectancy, freedom, generosity, and corruption. Notice what’s missing? Things like religiosity, family structure, community belonging, a sense of transcendent meaning. Build the index around those variables instead, and the map of global happiness looks very different. For what it’s worth, the Human Flourishing research is doing a better job of leaning into a wider variety of variables. I’m excited for that data to become publicly available.
With that preamble, I want to focus on probably the best long-term measure we have of self-described happiness: the data from the GSS. The Association of Religion Data Archives has been hosting the General Social Survey files for a long time now. Lucky for us, the happiness question has been asked in every single wave of the GSS, all the way back to 1972.
We should start by just looking at how responses to that question have changed over the full time series.
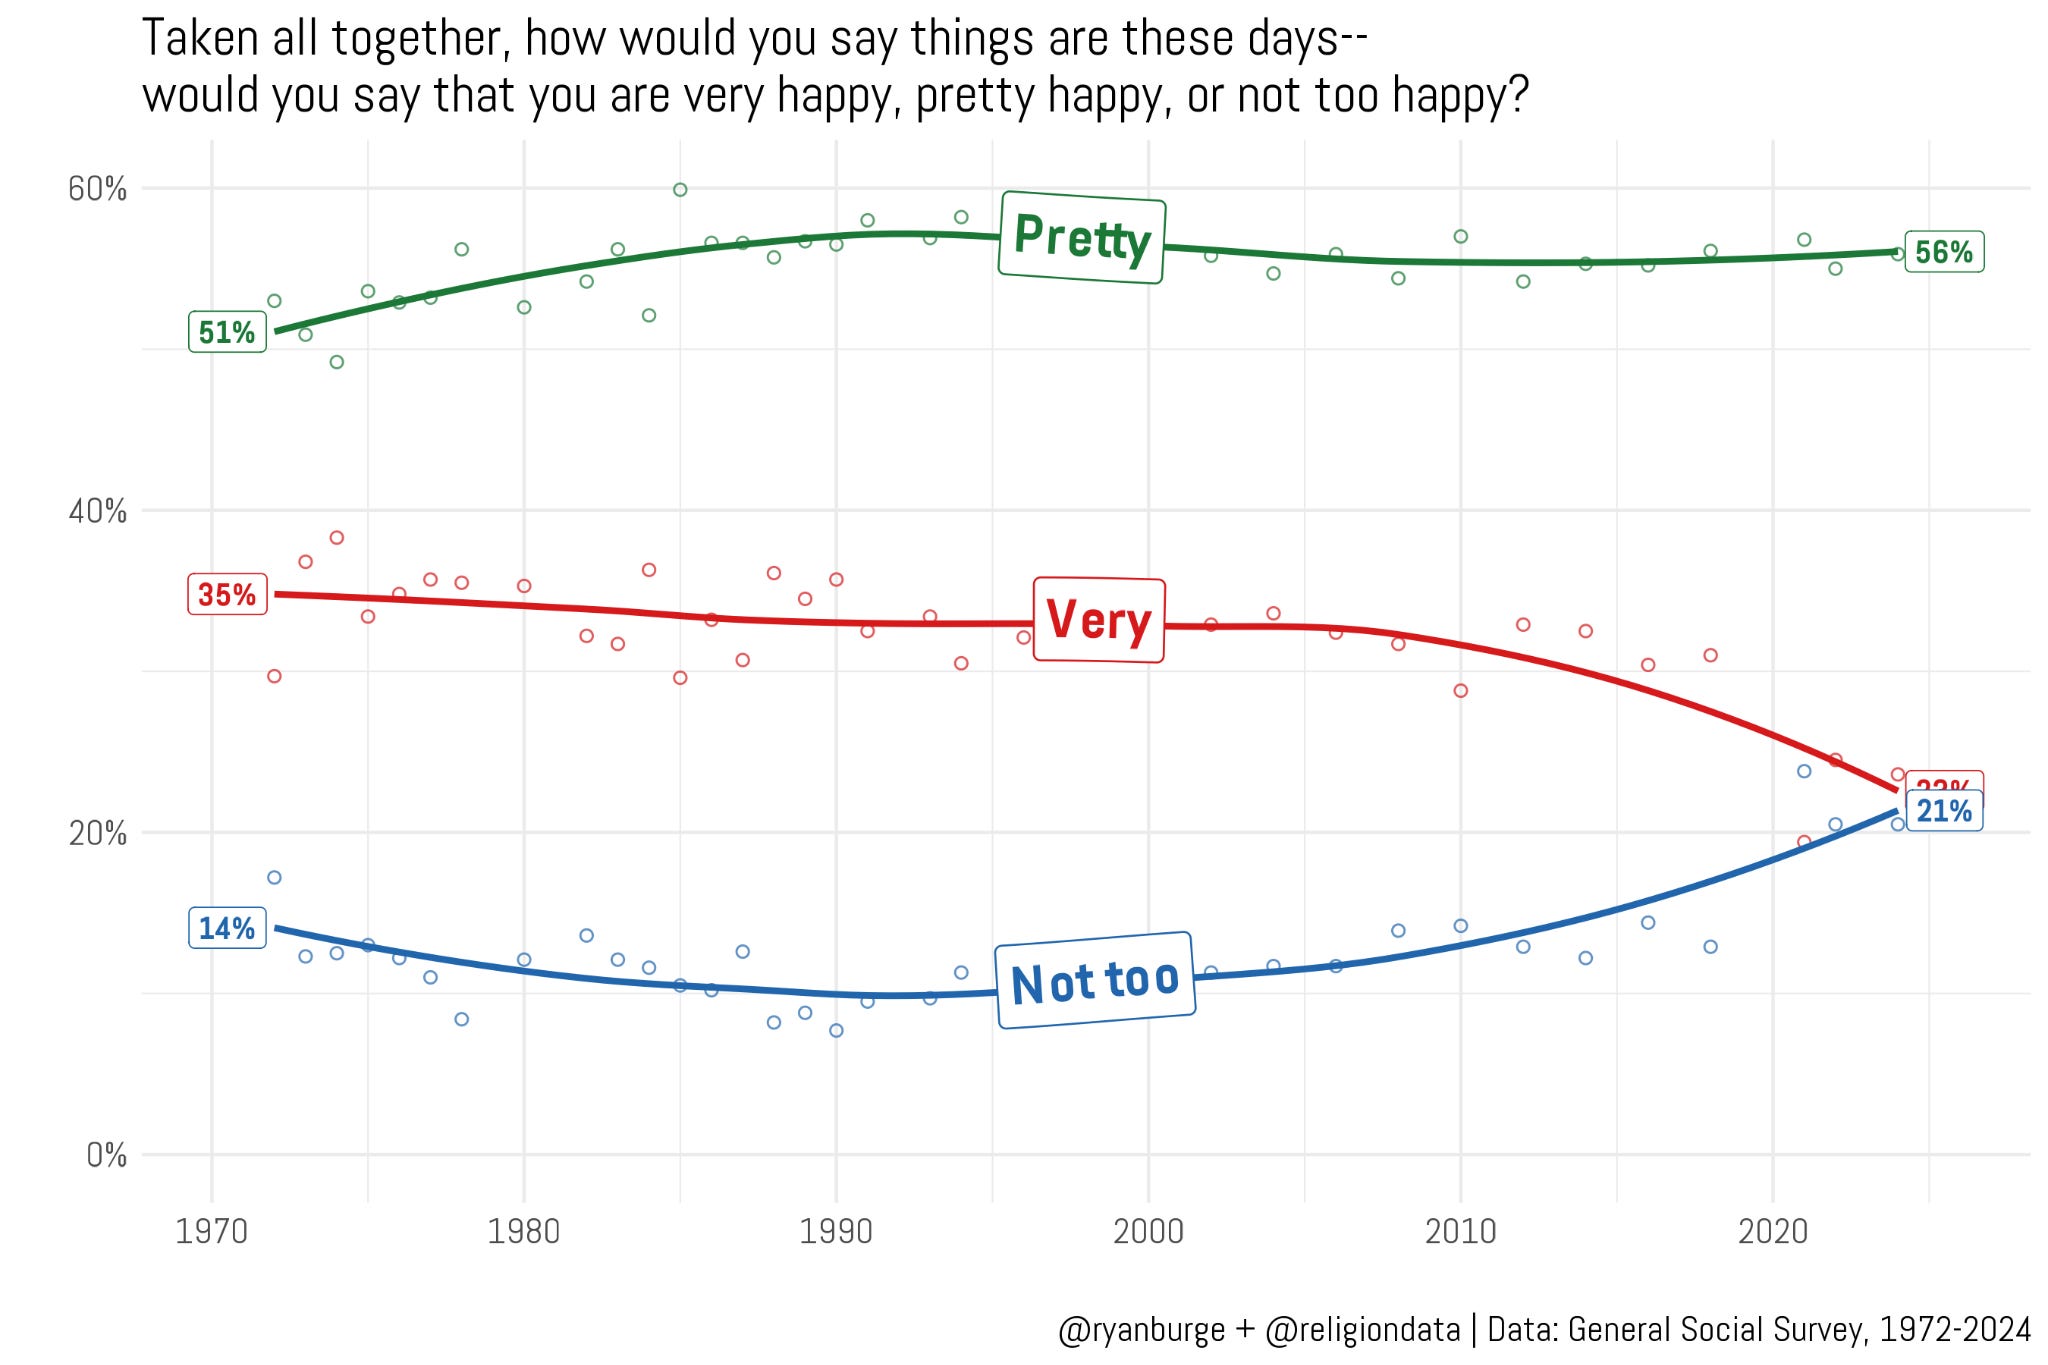
There was a whole lot of long-term stability in these measures. It’s startling to see how flat these lines are across several decades. The share of Americans who said they were “very happy” was basically the same from 1972 all the way through 2000 — about one-third of the population. The “not too happy” line held in the 10-15% range, and the “pretty happy” line edged up just a bit, rising from the low fifties to the upper fifties between 1972 and 2000. I don’t think we can make strong claims about a big shift in happiness during this period.
But that’s certainly not the case in the last fifteen years. Happiness has clearly declined recently. The share of people who said they were very happy was 32% in 2004. It was 22% in 2024. The share who said they were not too happy rose about ten percentage points over the same period. There used to be a 20-point gap between those two lines. Now the gap is statistically zero.
There is a methodology shift worth mentioning here -- the GSS had to pivot to online administration because of COVID, and that subtle change can have big ripple effects on a question like happiness. But as Sam Peltzman argues in this paper, that shift can only explain part of the “happiness crash.” There really has been a happiness dip in the United States.
Let’s spend a bit of time trying to parse through the factors that would contribute to this pretty significant bump in the share of “not too happy” people. Obviously, we should start with religion. All I did was divide the sample into religious people — meaning they claimed any affiliation — and the nones.
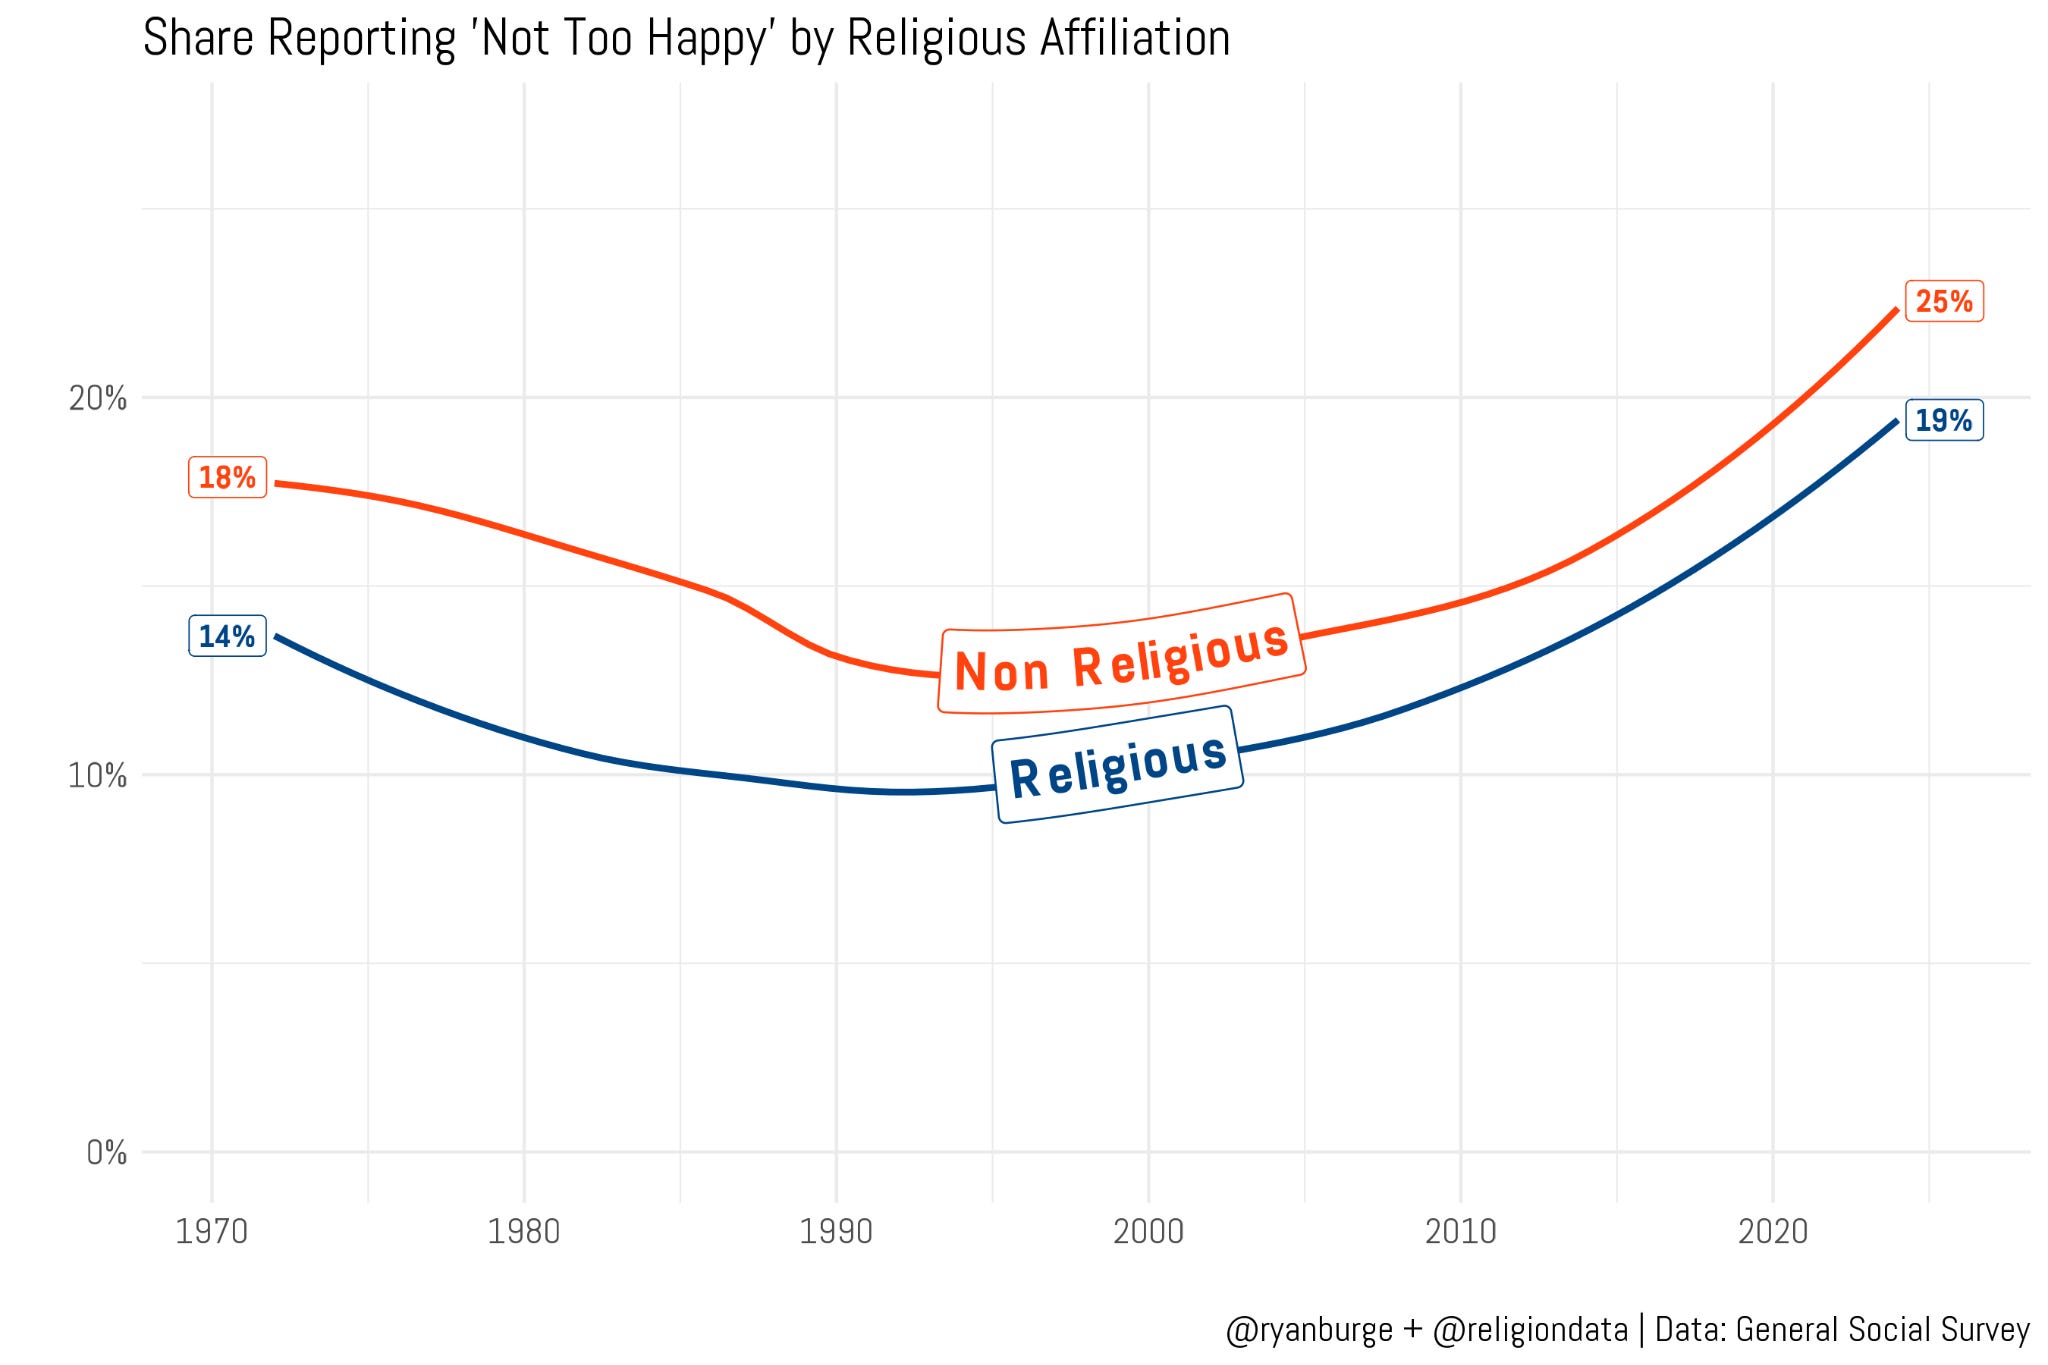
The first thing I want to point out is how these lines tend to move in near concert with each other. When one starts trending downward, so does the other. That tells us that macro-level conditions in the United States tend to shift happiness for everyone. There’s really no evidence in the data backing the claim that non-religious people grew much less happy while people of faith remained more upbeat.
But the other conclusion is hard to miss: non-religious people are more likely to say they are “not too happy” compared to religious people. That gap is statistically and substantively significant, and it’s persistent — averaging about five percentage points across the full time series. In 1972, 18% of nones were not too happy compared to 14% of the religious sample. In 2024, the numbers were 25% and 19%, respectively.
So, a pretty plain result: religious people tend to express higher levels of happiness than non-religious folks. But we all know there are confounding factors that can complicate that. Non-religious folks tend to be more politically liberal, and a persistent finding in the data is that liberals are just not as happy -- though some recent work has complicated that narrative.
Let’s check with our GSS data.
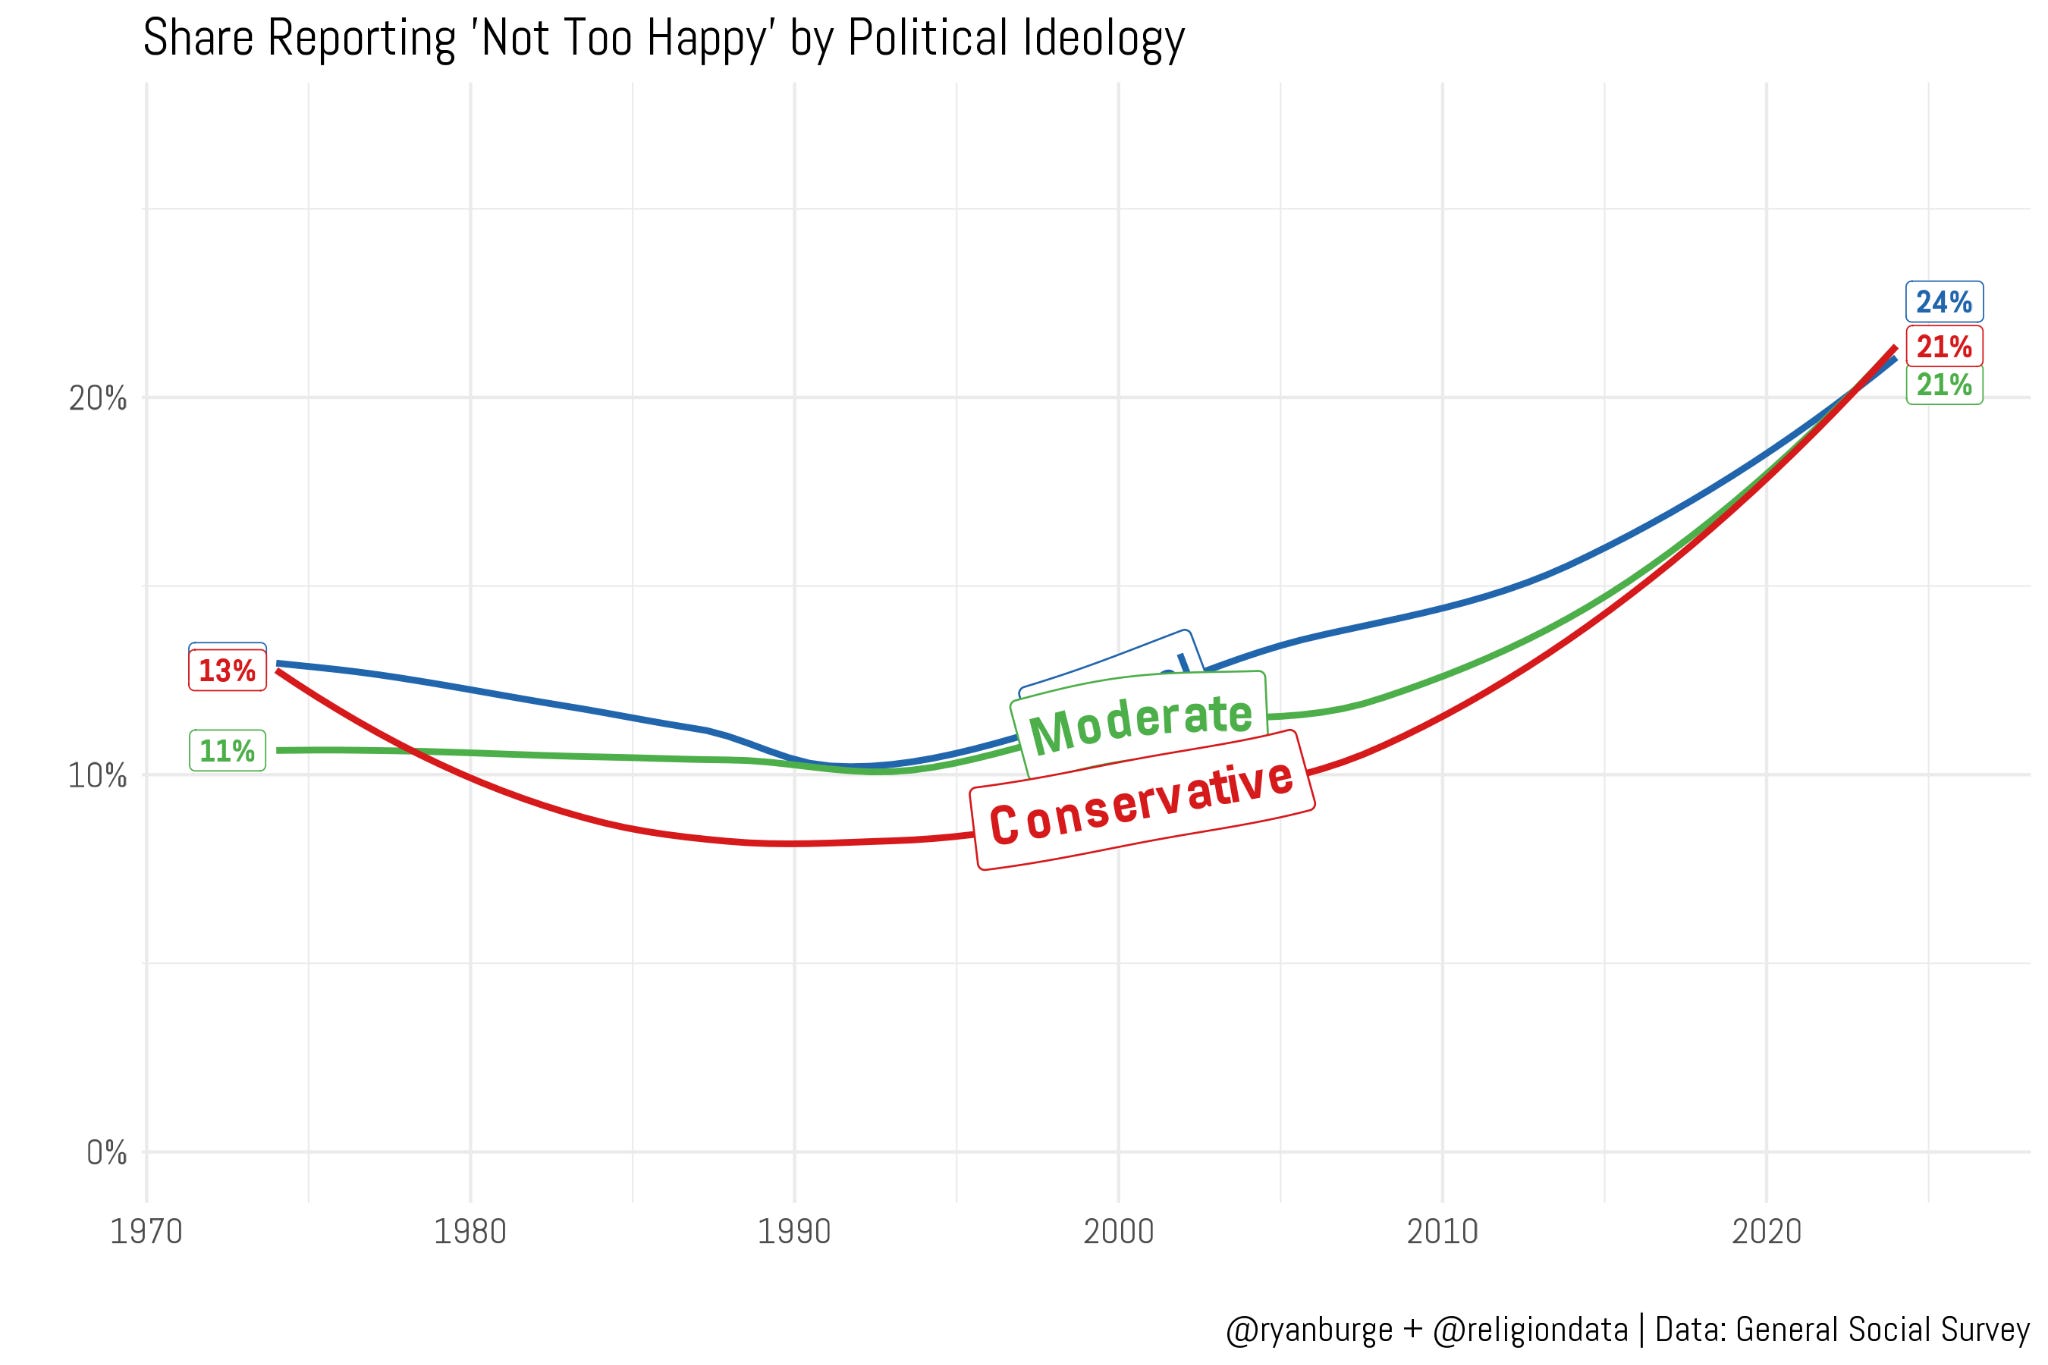
And this is the absolute definition of a null result. The gaps between liberals, moderates, and conservatives are basically non-existent across the full 52-year sequence. In 1972, 13% of conservatives said they were not too happy — the exact same share as liberals. Moderates were just slightly lower at 11%. I do find it interesting that the conservative line dropped noticeably over the next few decades, with the “not too happy” share falling into the single digits from about 1980 through 2005. That wasn’t the case for moderates and liberals, who stayed in double digits throughout.
The last fifteen years are really about convergence. By the late 2010s, there was no substantive difference in the share of each group saying they were “not too happy.” The trend line is unmistakably upward. Between 2010 and 2024, the share of liberals who were not too happy basically doubled — but the same thing happened for conservatives and moderates. Everyone just got grumpier in the last decade, regardless of politics.
So we have a mixed bag. Religious people are noticeably happier than non-religious people. But we can’t chalk that up to politics. Let’s keep digging by tracing how each generation answered the happiness question as they aged through the life course.
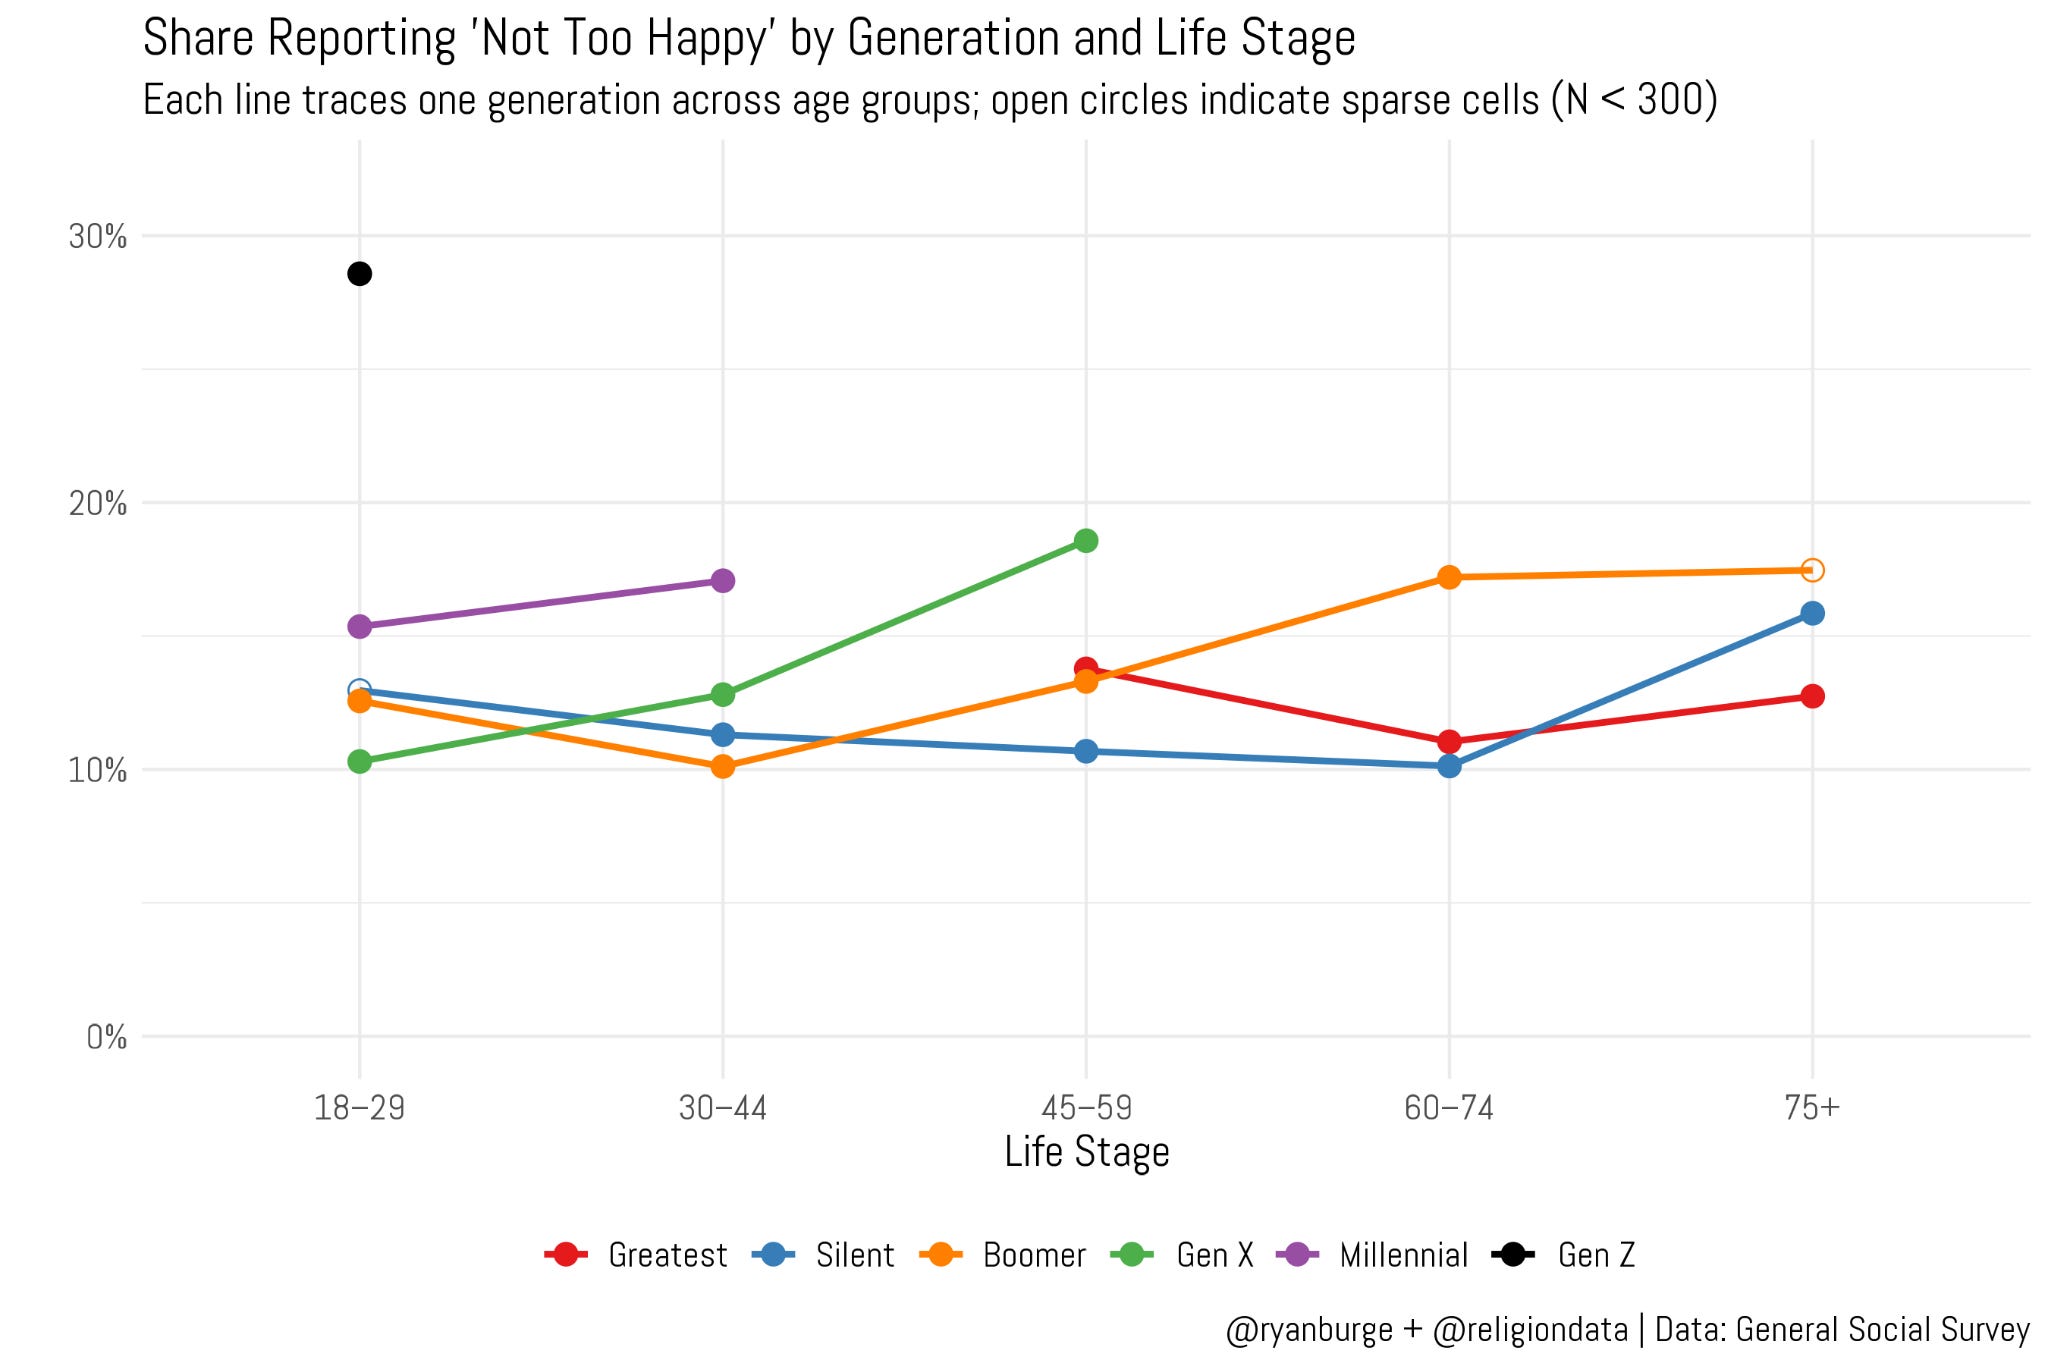
Again, stability is the big takeaway. When the Greatest Generation aged through the back half of their lives, the percentage who said they were “not too happy” was remarkably consistent: 12-14%. For Silents, the share actually dipped a few points as they aged, then jumped noticeably in the last life stage — which makes sense. Many were probably dealing with health concerns and the loss of a spouse, both of which tend to alter happiness.
Boomers are a fascinating pattern. They really have gotten less happy as they’ve aged. When they were between 30 and 44, only 10% were not too happy. By the time they reached their sixties and seventies, that rose to 17%. The back half of life has not been kind to Boomers. But Gen X seems to be speed-running this. At 45-59, they are already less happy than Boomers were at that same age.
For Millennials and Gen Z, we obviously don’t have as many data points since they haven’t reached as many life stages yet. But it’s unmistakably clear that Millennials are less happy than their parents or grandparents were at similar life stages — though we haven’t seen a big sudden bump. They just started at a higher baseline. And speaking of baselines, look at those Gen Z numbers. Oof. Among the youngest adults, 29% say they are currently not too happy. That’s nearly double the rate of Millennials at the same age. Gen Z is starting out adult life as the unhappiest generation in American history.
There are a lot of moving parts here, though — age, religion, political ideology. I need to hold some of that constant while testing the impact of something like church attendance or education on happiness levels. That’s exactly what I’ve done below. I built a model with controls for gender, partisanship, education, religious affiliation, religious attendance, and income — all factors that could have a big impact on happiness. I’m showing just the two ends of the spectrum: the predicted probability of saying you are “not too happy.”
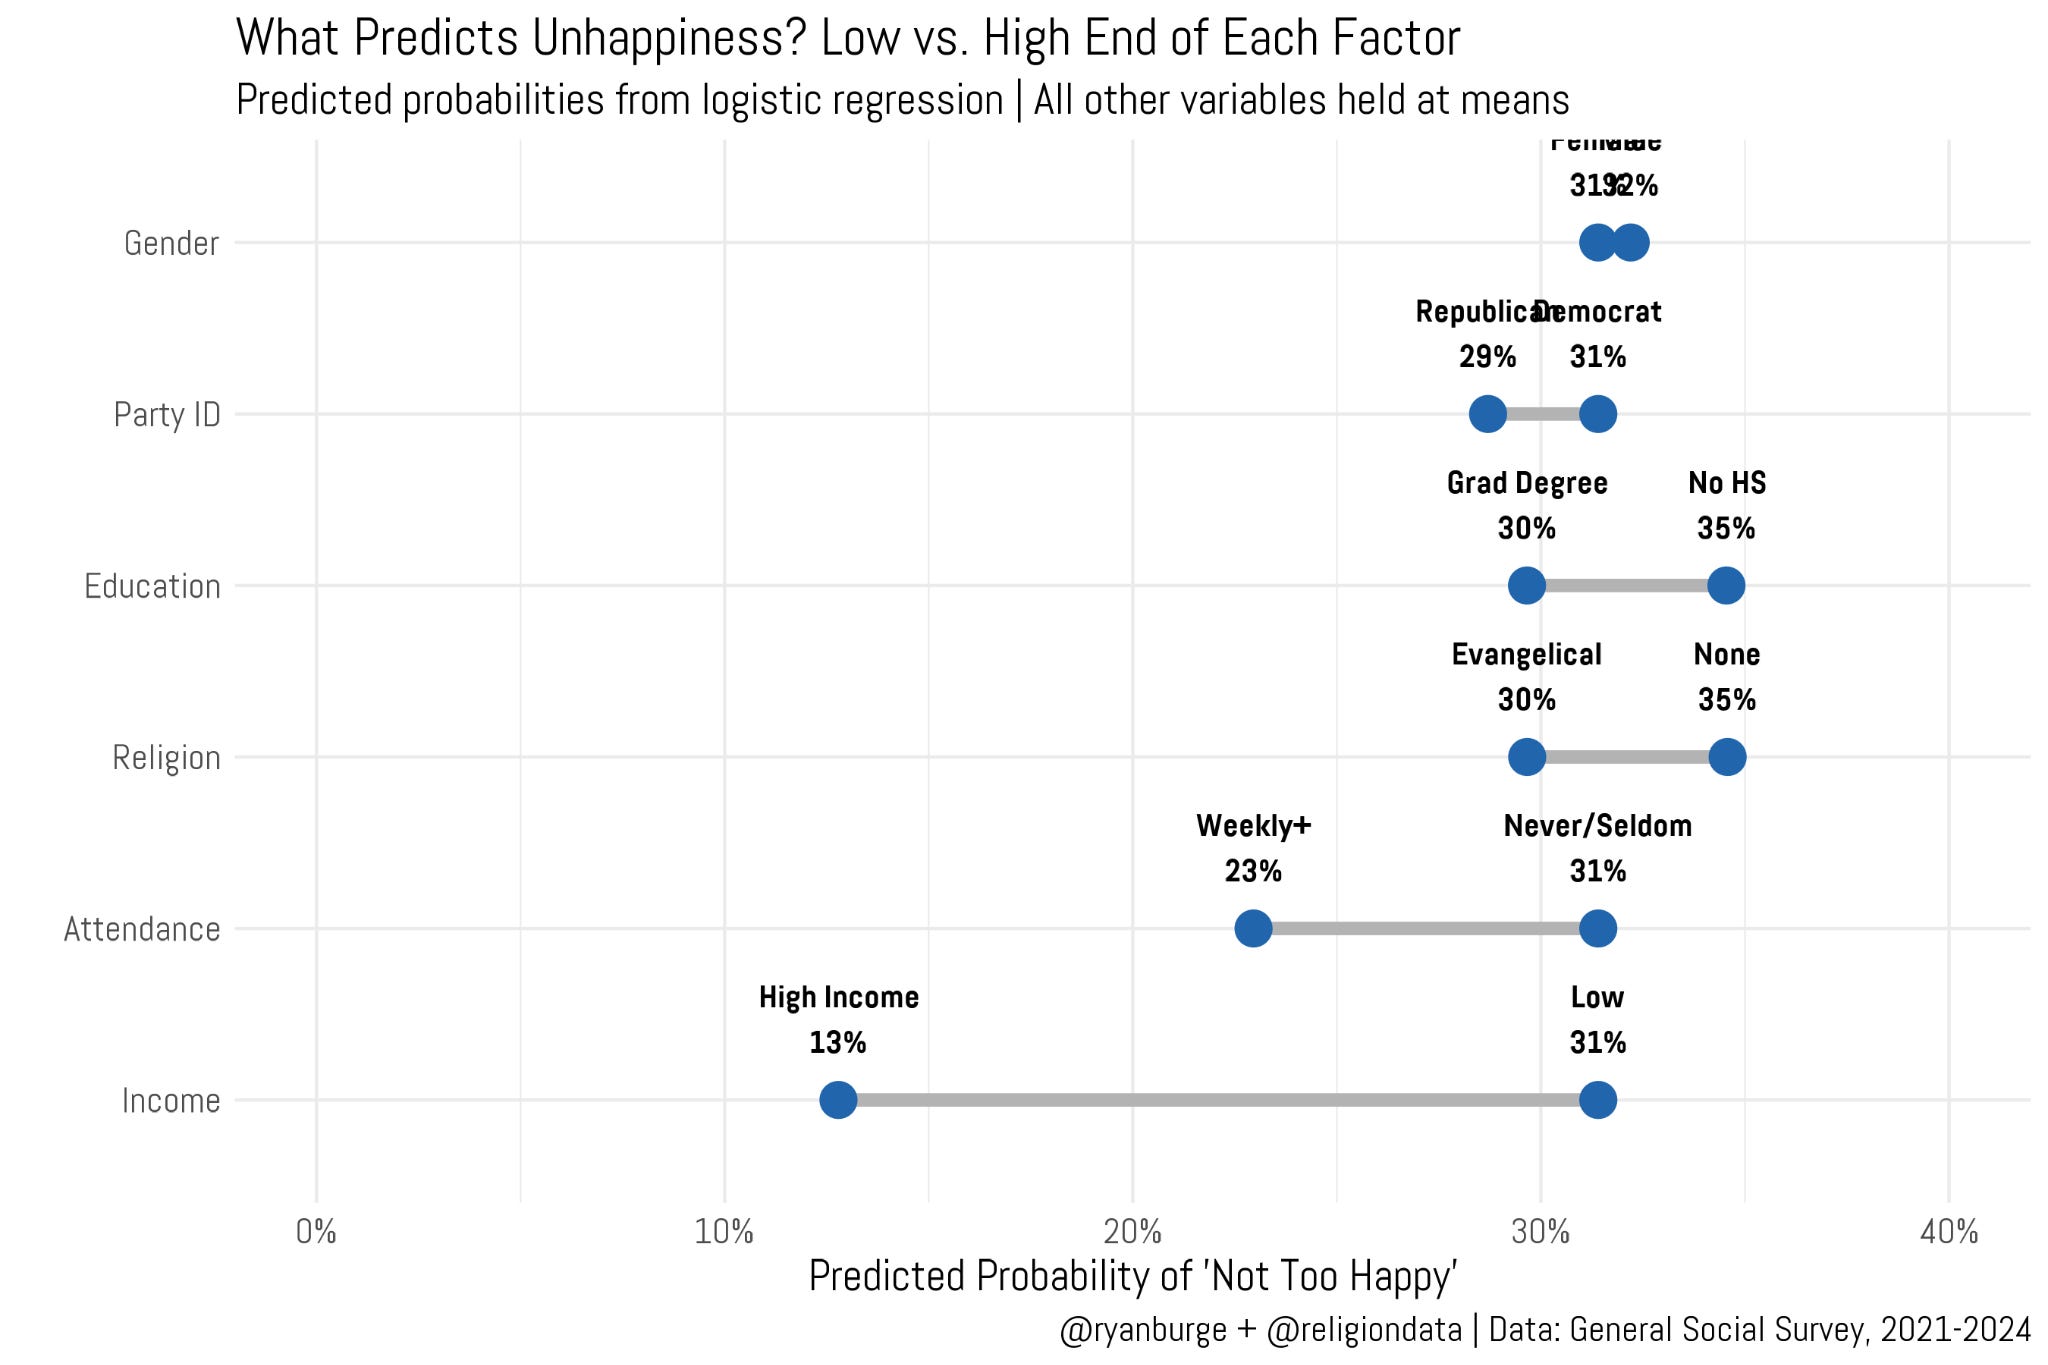
The variables at the top don’t pop. There’s really no difference in happiness levels between men and women — just one percentage point. The same is basically true for Democrats vs. Republicans. A Democrat is about two percentage points more likely to be “not too happy” compared to a Republican, holding everything else constant. So we can’t chalk it up to gender or religious differences.
As we move down the list, though, the gaps widen. A person with a graduate degree is about five percentage points less likely to be “not too happy” compared to someone who didn’t finish high school. The biggest gap is on income. Holding everything else constant, about 31% of people in the bottom third of incomes said they were “not too happy,” compared to just 13% of people in the top third. Does money buy happiness? It does seem to help quite a lot.
What about religion? A non-religious person is about five points more likely to be unhappy compared to an evangelical — and remember, we’ve controlled for ideology, so we can’t attribute that to political differences. But an even bigger factor is attendance. Among those who attend services at least weekly, only 23% report being “not too happy.” For those who never or seldom attend, it’s 31%. The data paints a pretty clear picture: religious folks — however you measure the concept — are less likely to report being “not too happy.”
Of course, measuring happiness is difficult, as I noted at the top. Maybe religious people are just conditioned to put on a happy face in ways that non-religious people aren’t. If your tradition teaches you that suffering has meaning, that gratitude is a virtue, and that contentment is next to godliness, you may simply be primed to report greater happiness, regardless of how your life actually feels from the inside.
But here’s an interesting wrinkle: the World Happiness Report consistently ranks Finland — one of the least religious countries on Earth — as one of the happiest. Yet religious Americans report greater happiness than non-religious ones.
Social science is hard. More job security for me, I guess. Which makes me…happy?
Code for this post can be found here.
Ryan P. Burge is a professor of practice at the Danforth Center on Religion and Politics at Washington University.

Is there a way to check for the influence of social networks on happiness? People who attend church every week are likely to have a circle of friends and social activities connected to their church. I wonder if the same thing is true for people with more income? Or at least people with income may have more stable social networks that could contribute to happiness.
I am struck by how modern this utilitarian analysis of religious practice is. I can't imagine anyone in the 16th century wondering if religion makes them 'happy'.
That being said, my 21st-century self enjoyed the analysis.