

Can We Blame the Nones for America's Marriage Crisis?
In 1972, 85% of Americans had been married. Today it's 70%. Here's what's really driving the decline.

A couple of months ago, the Heritage Foundation released a report entitled Saving America by Saving the Family: A Foundation for the Next 250 Years. You can probably guess the contents of said report from just the title, but to summarize: people aren’t walking down the aisle that much anymore, and that’s pretty much bad for everyone. They start by going on a philosophical discussion of how almost all the Founders were married and Aristotle’s discourse about how societal order begins in the household. If you’ve ever read any Heritage stuff, you know this is pretty standard fare.
They do point to some tangible policies that they believe would drive the marriage rate back up. For instance, a couple that decides to marry before age 30 would get a $2,500 deposit in an investment account. They also suggest a tax credit for married parents with newborn children. But their most controversial proposals revolve around restricting no-fault divorces and moving toward a default 50-50 custody arrangement for children after divorce.
One of the most prominent throughlines in that Heritage document is the role of religion in the decline of marriage rates in the United States. In fact, when I did a CTRL+F search of the document, the word “religion” showed up forty times. They point to studies which find that church-going couples have a divorce rate that is 50% lower than those who don’t go to a house of worship on a regular basis. Reading through that document got my wheels spinning, of course.
The Rise of Singleness and How Religion Is Impacted

A few months ago, I wrote a post about falling marriage rates and the possible link to religion:
I think we can all admit that there’s some kind of relationship between the decline of religion and the decline of marriage in the United States. Every major religion in the United States encourages parishioners to find a partner, get married, and have children. But how much of the marriage rate decline in the United States can be laid at the feet of the rise of the nones? I think I can actually come up with a fairly robust answer to that question using a couple of different data sources.
To start out with, though, I thought I would just visualize how marriage rates have plummeted in the United States using data from the General Social Survey. It’s been asking, “Are you currently--married, widowed, divorced, separated, or have you never been married?” since the very early days (1972), so we can track this with a ton of specificity over five decades. This is just the share of people who say that they have never been married.
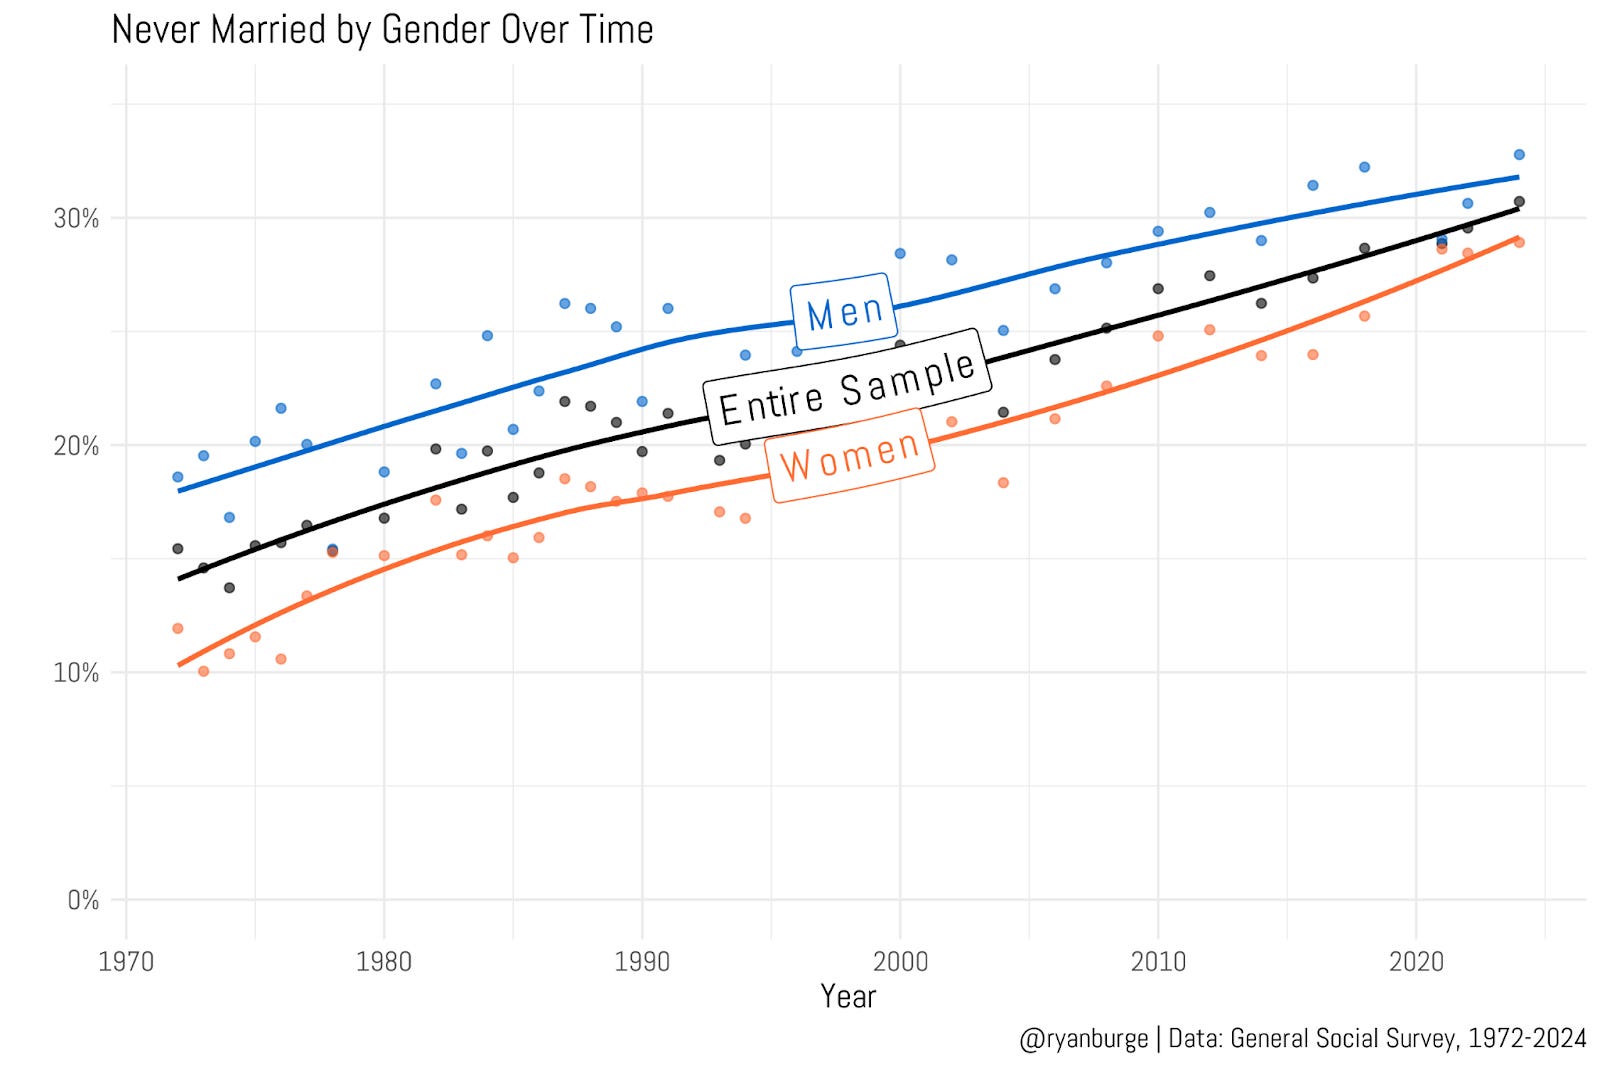
In 1972, the share of respondents who had never been married was a shockingly low 15%. Pretty amazing to think that 85% of all adults in the United States currently had a husband or wife (or at least had one at one point in their lives). In other words, if you had never found a partner, you were a statistical oddball back in the 1970s. But as you can tell, that didn’t last that long. By the early 1990s, the rate rose to 20%, then it was about 25% by 2010. In the most recent wave of the GSS from 2024, just over 30% of all American adults had never been married. Double the rate from five decades earlier.
And we can certainly blame men for this problem! That’s another consistent finding from the GSS—male respondents have been noticeably more likely to always be single compared to their female counterparts. In the 1970s, the gap was just about eight percentage points (10% vs. 18%). And it’s maintained a pretty healthy gap for most of the last five decades. Although, I do want to point out that it’s narrowed noticeably in the last few years. In 2024, about 33% of men had never been married compared to 29% of women. You can chalk a lot of that convergence up to the female line rising faster than the male line.
But I wanted to come up with another metric that would help make this concept seem more “real” to us. So, here’s what I did—I calculated the age in the data at which the “never been married” rate dropped below 50% for the first time for each year of the GSS. So this is basically the “tipping point” for marriage over time.
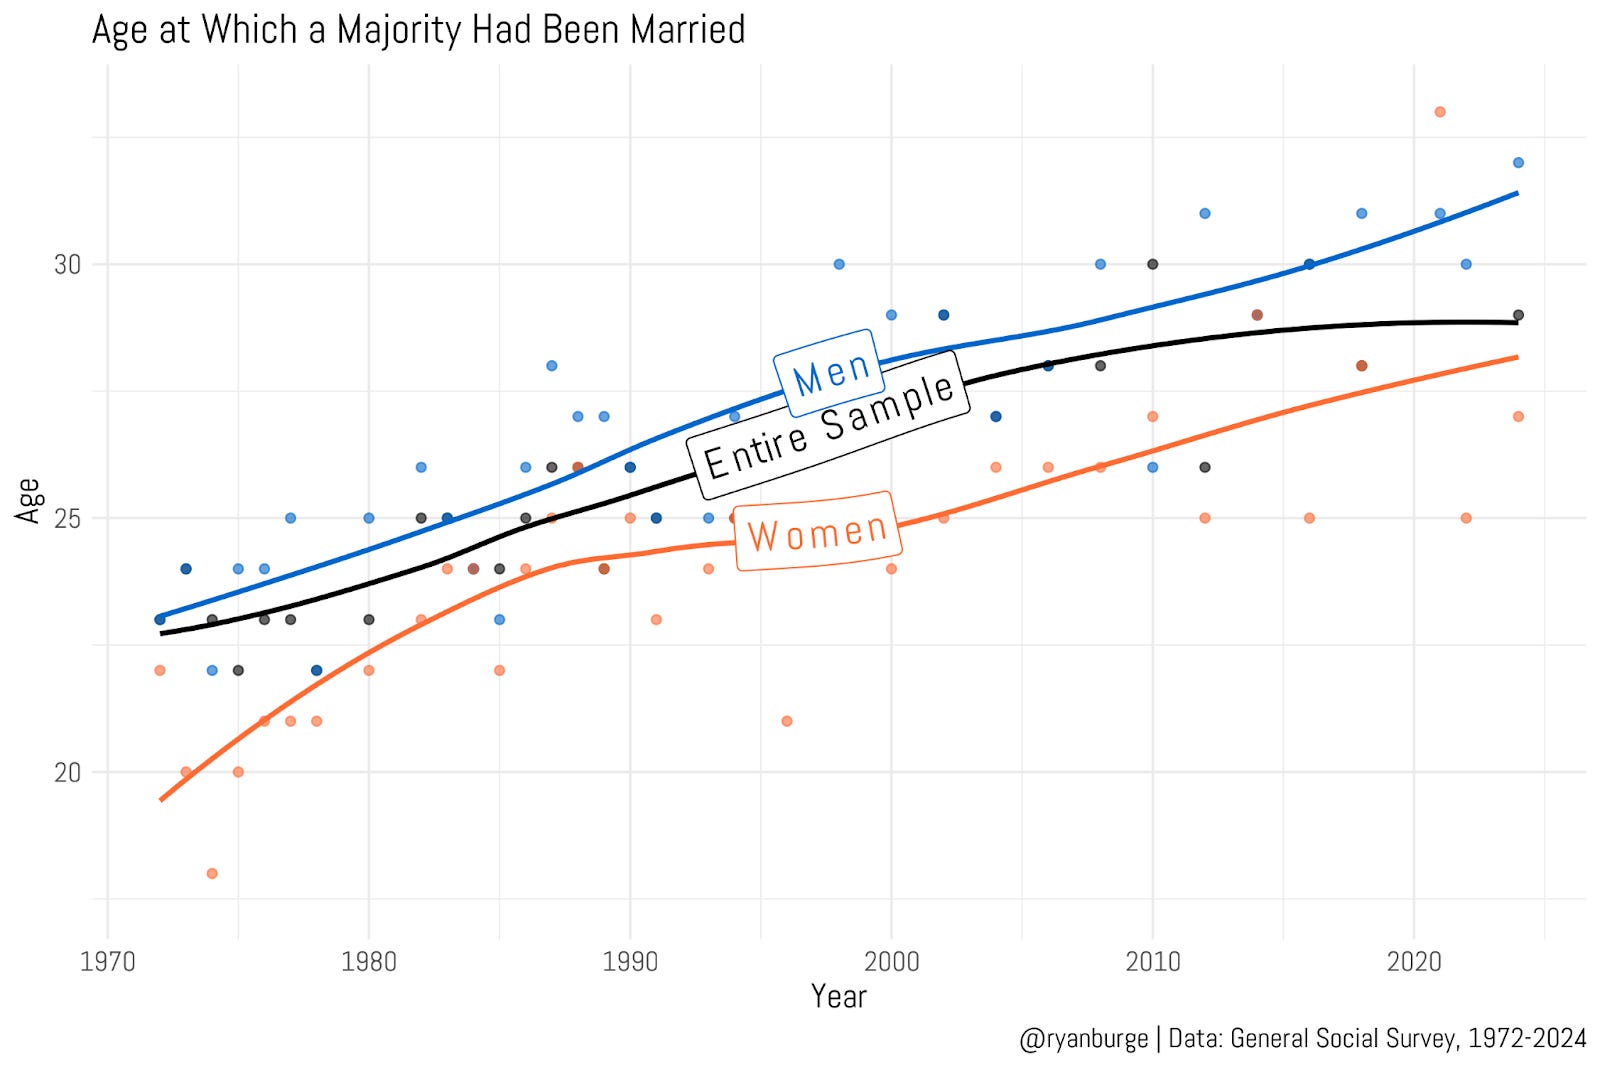
It’s wild to say this, but in the early 1970s, the age at which most women had walked down the aisle was right around 20 years old. That’s crazy to consider, especially compared to men, who were around 22 or 23 years old before most of them had tied the knot. But that female tipping point did begin to shoot up pretty quickly. By the 1990s, the age of marriage for women was about 24 years old, and for men it was around 26-27 years old.
From that point forward, both lines begin to rise in near parallel. You can see from the trendline that somewhere around 2016, most men had gotten married by their 30th birthday. For women, that took until just the last couple of years. But here’s the one stat to think about—in 1972, the average person’s first marriage happened right around 23 years old. Today, it’s about 28 years old. There’s no denying this fact: people are delaying marriage much longer now.
Now, let’s inject religion into this equation. This is just that question about “never being married” across three groups—Protestants, Catholics, and the non-religious.
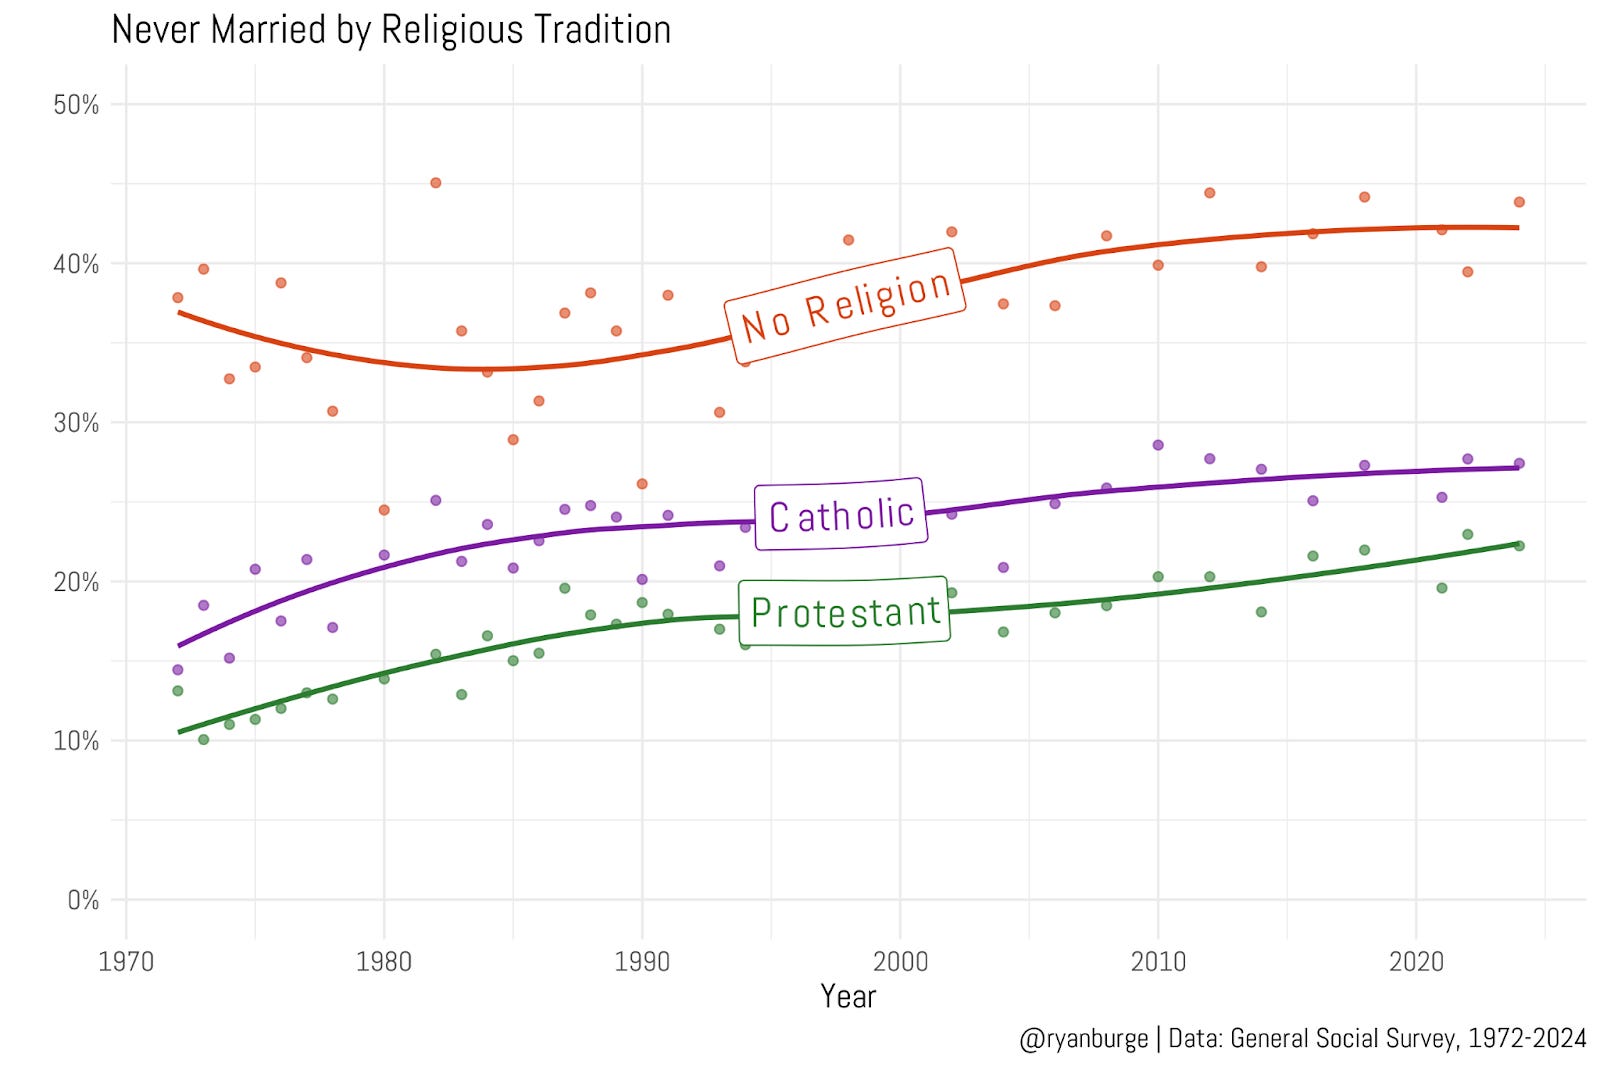
The upshot here is consistent and straightforward. The non-religious are way more likely to never have been married compared to Christians. That was true in the 1970s, and that’s true in 2024. The gap is really large, too. When comparing the nones to Catholics, the gap runs somewhere between 10 and 15 percentage points. It has narrowed at some periods, but then it just opens back up again. In 2024, about 43% of the non-religious had never been married compared to 27% of Catholics.
I do feel the need to point out that Catholics have always been less likely to tie the knot compared to Protestants, too. I don’t know if I would have guessed that. It’s pretty noteworthy how the lines just seem to run in parallel, too. No matter what year you look at, a Catholic is about five percentage points more likely to say they’ve never been married compared to a Protestant.
But any astute reader of this newsletter will know that the above graph has a real problem. Put simply: it’s age. The nones tend to be a lot younger than Protestants or Catholics. In the 2024 data, the mean age for Protestants was 50.5. It was 51.7 for Catholics but only 41.9 for the non-religious. Of course, getting married is largely a function of age, so we need to correct for that.
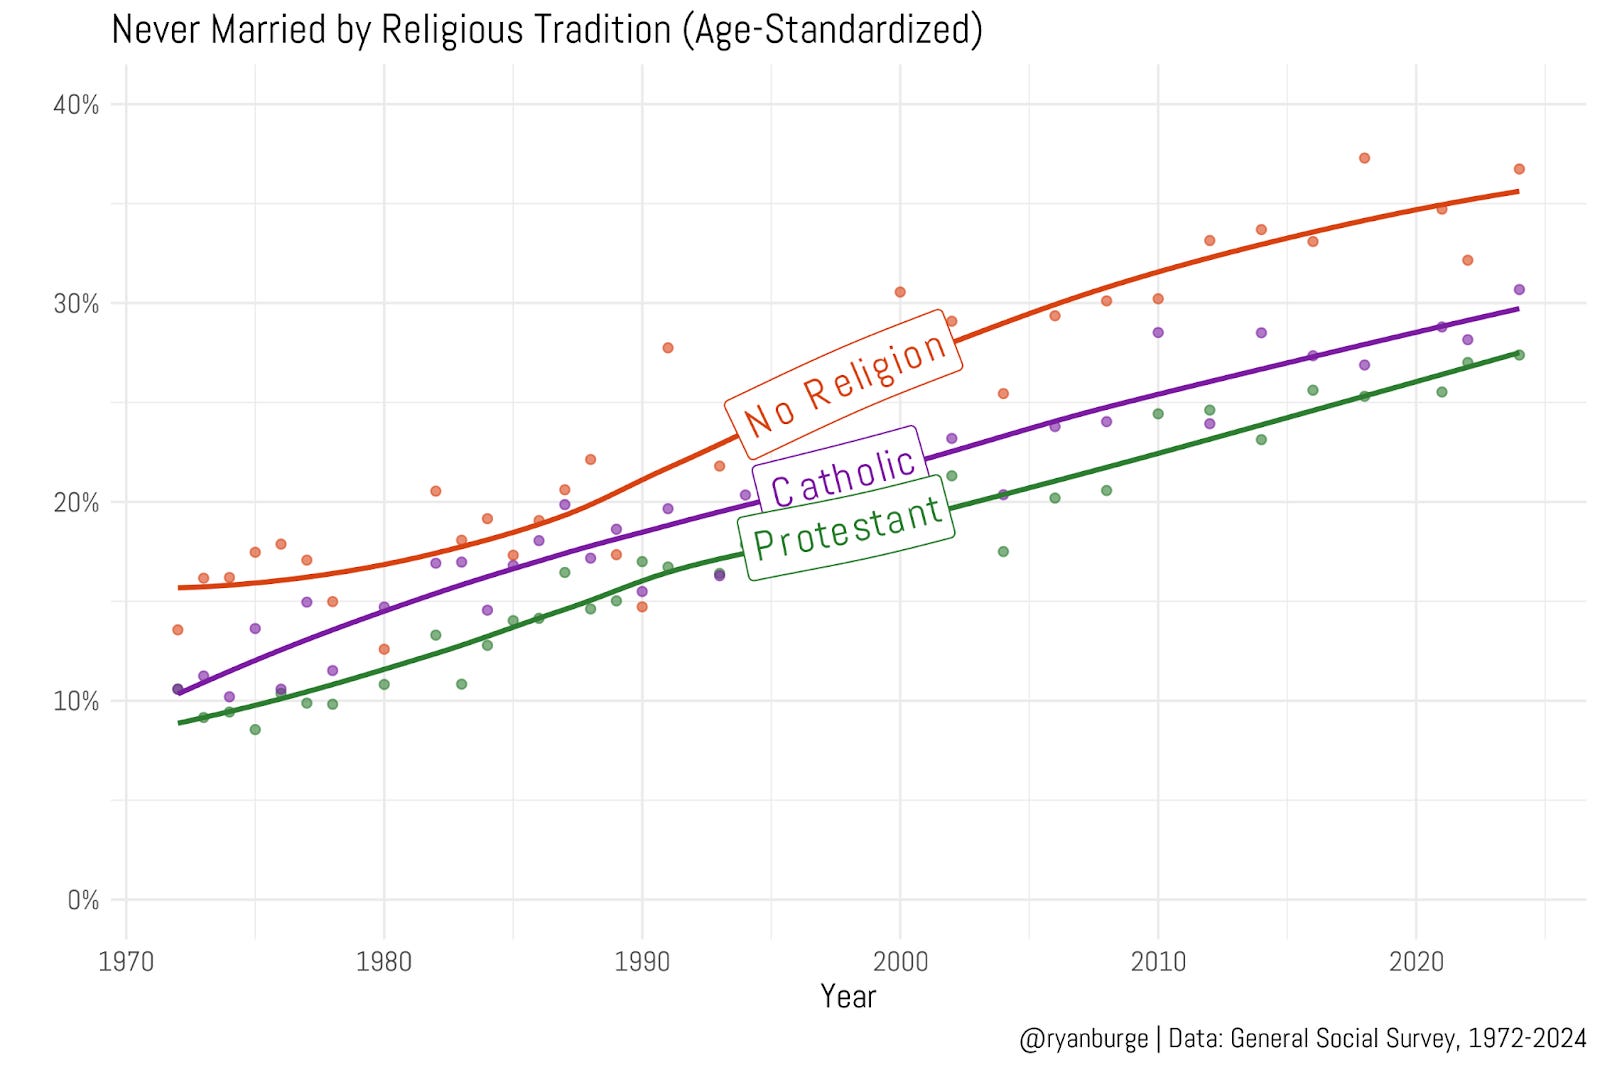
I age-standardized the data to account for the fact that the nones are much younger than Protestants or Catholics. What that means is that I calculated the share never married at each age for each religious group, then applied a standard age distribution across all three groups. This removes the confounding effect of age differences. And, as you can see, this does narrow the distance between the groups somewhat.
But it doesn’t eliminate the “marriage gap.” The finding that the nones are still less inclined to get married persists even when we control for age. Interestingly enough, the gap between the nones and the Christians has actually widened somewhat in the last twenty years or so. Using our age-standardized model, the share of the non-religious who have never married is just above 35%. That’s 5-7 points higher than Protestants and Catholics. It’s just empirically accurate to say that religious people are more likely to get married compared to non-religious folks.
I am going to pivot to the Cooperative Election Study for the rest of this analysis, though, because the sample size is just way bigger. That means I can loop in smaller religious groups like Latter-day Saints, Muslims, and different types of Protestants and the non-religious. What I did was calculate the share of each tradition that had never been married at a number of age checkpoints like: Under 25, Under 30, Under 35, and so on. That way we can see (with a great deal of specificity) when marriage begins to become widespread among these groups.
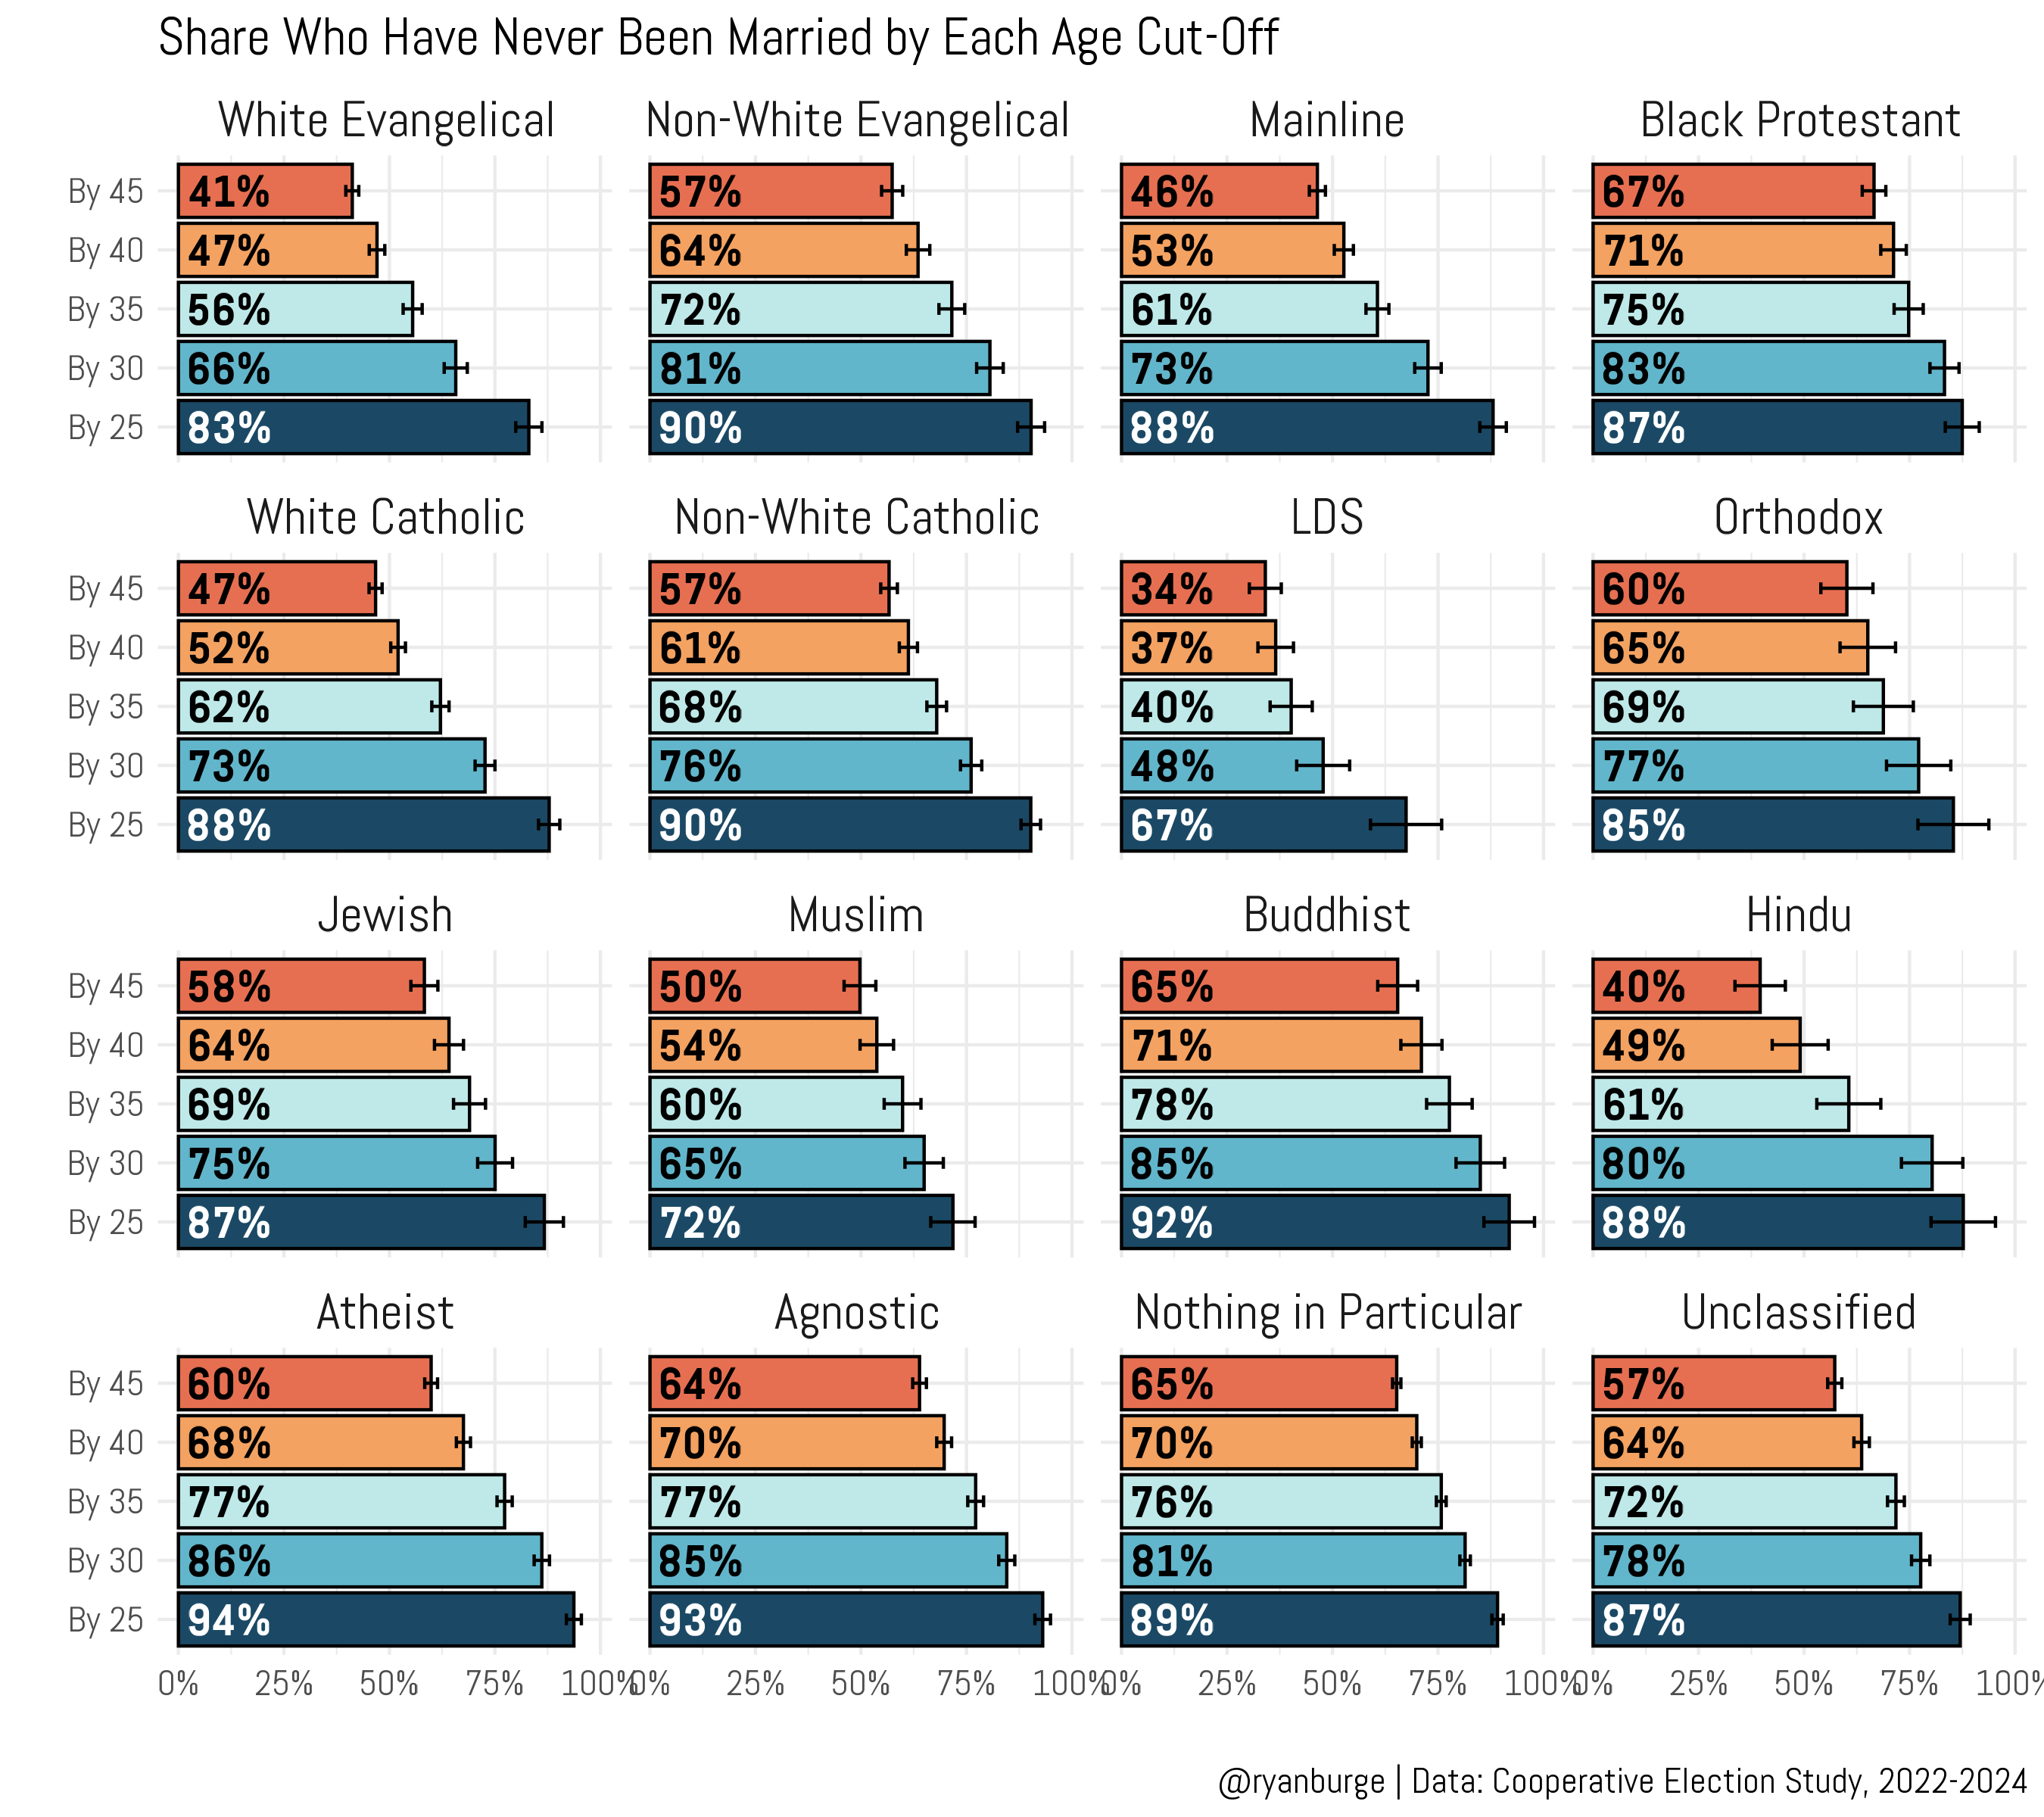
I’ve got to say—I love this graph. I’ve stared at it multiple times over the last couple of days because I always see something really interesting. For instance, the Latter-day Saints just jump off the screen for me. Only 67% of them were still single by their 25th birthday. The next closest group on this metric is Muslims, and 72% had not walked down the aisle by this checkpoint. All those tropes about Mormons and marriage really are accurate—they get married YOUNG compared to everyone else.
But, speaking of those white evangelicals, you can really see how they are just qualitatively different from other types of Protestants and Catholics when it comes to marriage. By forty years old, 47% of white evangelicals had never gotten married. For white Catholics, that number was 52%. For non-white Catholics, it was even higher: 64%. By 45, just 43% had not tied the knot. That’s 10-15 points lower than any other group in the top two rows.
However, we’ve got to talk about the non-religious now—particularly the atheists and agnostics. Just think about this one data point: at 25 years old, just 6% of them had gotten married. By 30 years old, it was only 14%. By 40 years old, two-thirds of atheists and agnostics had not walked down the aisle. The “nothing in particulars” aren’t far behind on this, either. By age 45, a strong majority of them (65%) had never tied the knot, either. Again, this data points to a pretty strong conclusion—the rise of the nones has led (at least in part) to a decline in marriage rates.
I wanted to really dig deeply into this idea, though. My goal was to estimate (as much as we can) the impact of being non-religious on getting married or not. So, I pulled together a regression model that included a couple of demographic factors like age, gender, education, and race. I also threw an ideology variable in there alongside a dichotomous measure of non-religion. Then I predicted the likelihood of never being married.
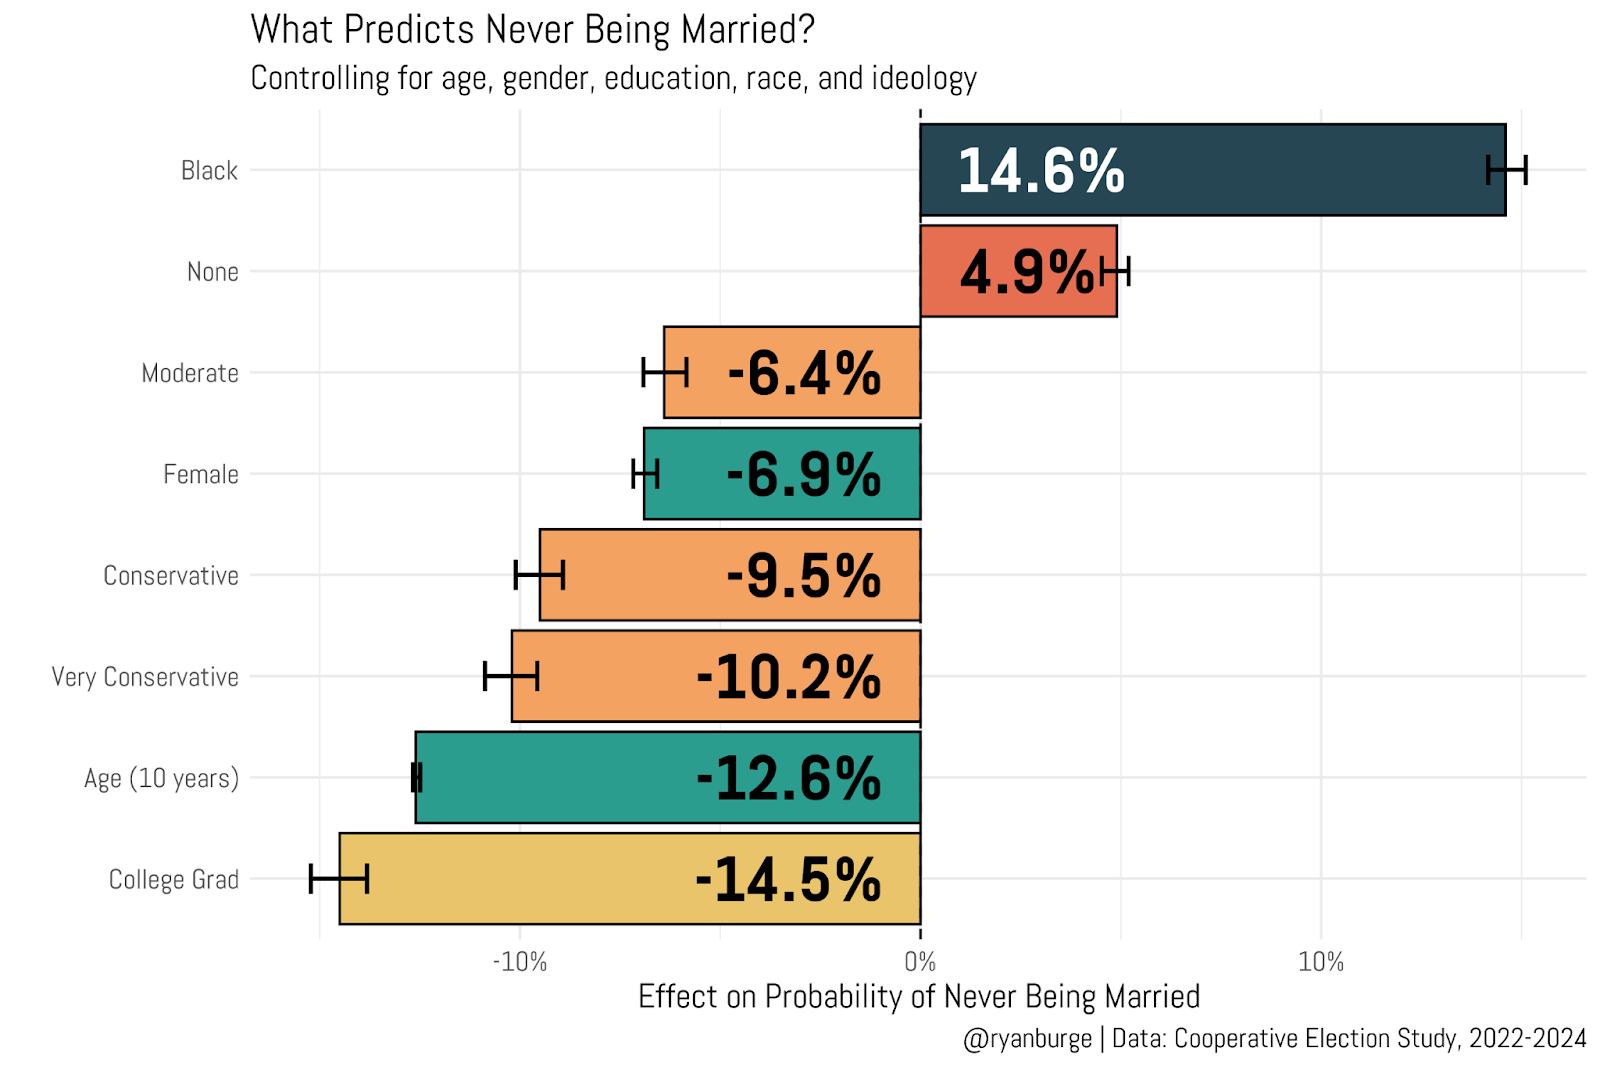
I found a bunch of factors that drive up marriage rates—those are at the bottom of the graph. The most predictive was being a college graduate. Someone with a four-year degree is about 15 percentage points more likely to have tied the knot compared to someone with less education. Obviously age was a strong predictor of marriage rates, but so was political ideology. Compared to a liberal, a conservative was about 10 percentage points more likely to get married. A moderate was about 6 points more likely, as well. And, as we observed before: women are more likely to get married compared to men (by about 7 percentage points).
Men Have Abandoned Marriage and Parenthood

In December 2023, Christine Grillo wrote a letter to the editor of the Washington Post - it was titled, “Women don’t need to be on the marriage track.” She is a self-described, “White, Gen Z, liberal woman” who took umbrage with a prior editorial in the newspaper which encouraged women to compromise a bit to find a mate.
There were only two measures that I put in my model that predicted a higher rate of singleness. One was race. Holding all other variables constant, an African American was nearly 15 percentage points more likely to have never been married compared to someone of another race. For comparison, that’s the same impact as having a four-year college degree (just in the other direction).
The impact of being non-religious on marriage rates was actually fairly modest once we controlled for other factors. If we took two people who had exactly the same age, level of education, gender, race, and political ideology but one was a Christian and the other was a non-religious person, the none would be about 5 percentage points more likely to never be married. That’s not nothing, but it’s not a huge difference, really.
So, why is that coefficient not larger than 5 points? Well, I think a good answer is that political ideology is doing a whole lot of the work here. Liberals don’t get married at nearly the rate as conservatives. And a whole bunch of atheists and agnostics are very liberal folks. Which means that ideology is doing a lot of the work here, not really religious affiliation.
Said simply—if the secularization rate of Americans returned to 1970s levels, it’s not like marriage rates would go back to that baseline. To actually get back to the point where 85% of Americans had been married would also require a whole bunch of political liberals to become political conservatives. Good luck with that.
Code for this post can be found here.
Ryan P. Burge is a professor of practice at the Danforth Center on Religion and Politics at Washington University.

Ryan, one factor you seem to omit is living together without marriage. I suspect if you add that option (asking people, are you married or cohabitating?) The gap between religions and non would close considerably. And because children seem to be one of the outcomes of interest, tracking marriage and children would prove helpful.
I do think this question is of interest: what public policies related to coupling and childbirth would encourage social stability and flourishing? That is what we are after, right? For instance, we could say that war discourages social stability and human flourishing while health care encourages social stability and human flourishing.
Fascinating! I echo a previous commenter in wondering how this would look if you had a way to control for co-habitation without marriage. Asking in part because I co-habited for nearly 20 years before marrying -- in large part because we couldn't legally marry until recently. Ours is a special case (most couples can marry), but I know a decent number who DON'T marry until they either want to have kids or they get old enough -- 30s, 40s, 50s -- to feel that the legal benefits of marriage as they age are worth dotting that i and crossing that t, so to speak.