Are Religious People More Fearful?
This post has been unlocked through a generous grant from the Lilly Endowment for the Association of Religion Data Archives (ARDA). The graphs you see here use data that is publicly available for download and analysis through link(s) provided in the text below.
A common refrain across the largest religious traditions is “fear not.” In Hinduism, worshiping Lord Hanuman is believed to cause a reduction in stress and more peace of mind. In the King James Version of the Bible, that phrase appears 103 times. But there are also plenty of other verses that allude to the same concept. 1 Peter 5:7 states, “Cast all your anxiety on him because he cares for you.” In the Gospel of Matthew, Jesus says, “Who of you by worrying can add a single hour to their life?” It’s also a central theme in the Quran, as well: “They planned, but Allah also planned. And Allah is the best of planners.” (Surah Al-Anfal 8:30).
Dealing with anxieties, fears, and doubts is something that every human being struggles with at one time or another. Religion can certainly play a role in either trying to soothe those anxieties, but it can also have just the opposite effect and make people even more anxious. It’s not uncommon for people who are struggling with mental illness like hallucinations to see demonic forces. So, when it comes to the ability of religion to tamp down fears or accelerate them, there’s ample reason to believe that either hypothesis could be true.
One of my favorite ongoing data collection projects comes from Chapman University. It’s called the Survey of American Fears which was first conducted in 2014, with the latest wave gathered in 2022. The 2022 data is available on the Association of Religion Data Archives (ARDA) website. It has a huge battery of possible fears - I found 72 in all. And it really runs the gamut from stuff like nuclear meltdown to global warming to corrupt politicians to zombies. Just scroll down on this page a little bit and you can see all of them listed.
Let me start by showing you the top fifteen fears in the general public based on the percentage of people who said that they were ‘very afraid.’
The clear winner here is not one I would have expected - corrupt government officials. About 37% of folks said that they were very afraid and another 26% said that they were afraid. Then, there was a mix of a whole bunch of categories like financial worries (30% of people were afraid that they would run out of money). World war was a significant concern, as was pollution of drinking water. I tried to color code them by general category of concern (environmental, government, financial, etc.) and it’s impressive how much variety there was at the top of the list.
For those interested in looking at the entire list of fears in rank order, I’ve uploaded that here. For those curious - the five topics that scored the lowest were: strangers, immigrants, Muslims, blood, and animals.
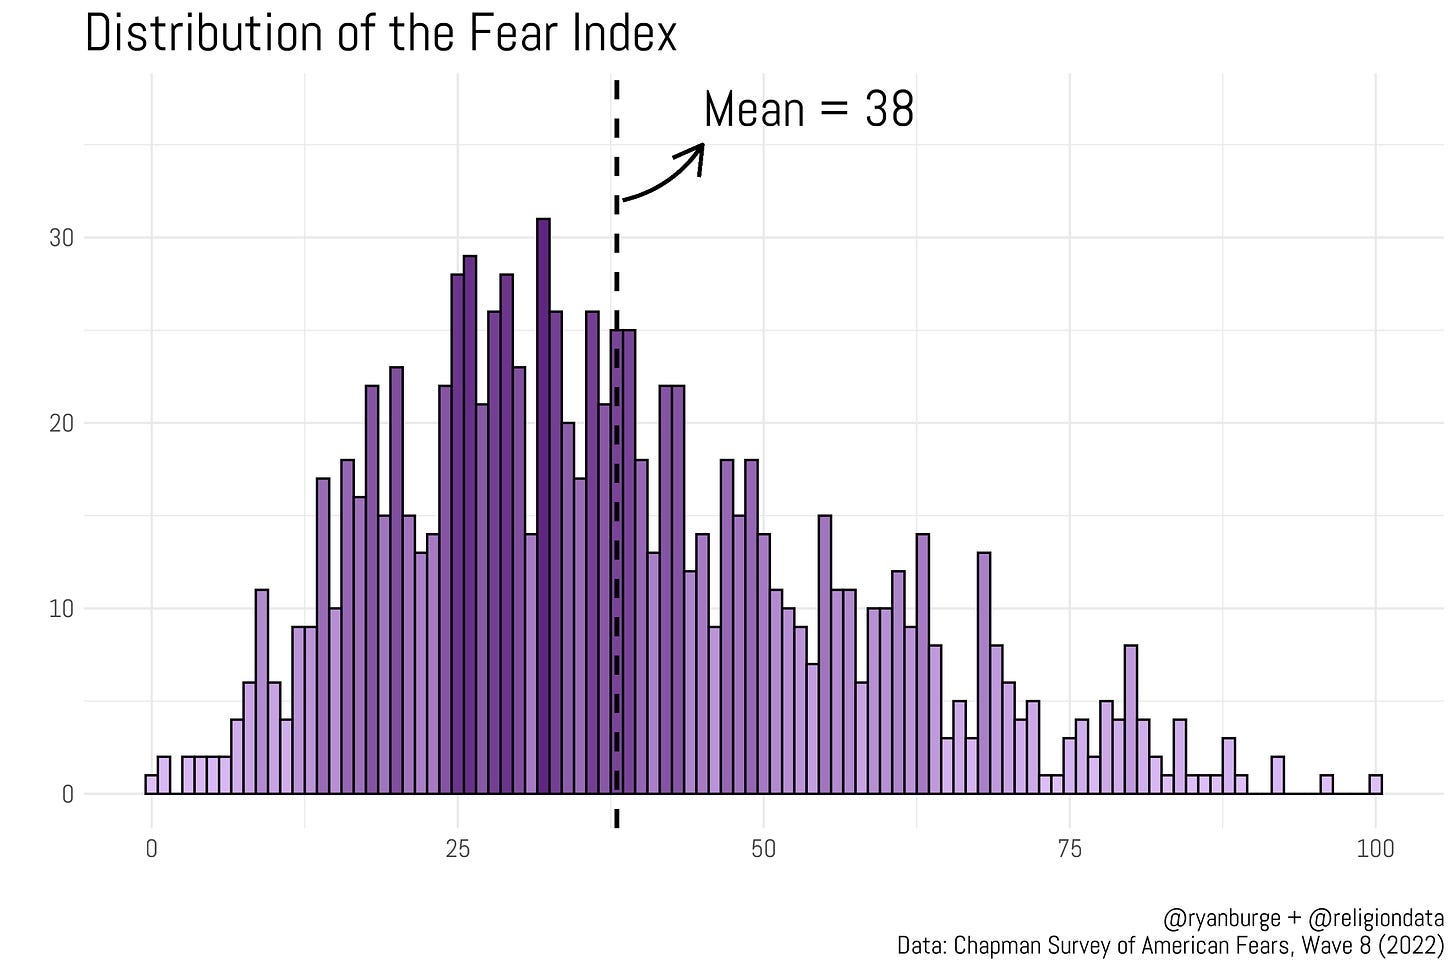
But to help us understand a central metric of fears, I created an additive index of all 72 items. Being very afraid was scored as a 4 and being not at all afraid was scored a 1. I combined all those items together and then normalized the range of values so that 0 was the ‘least afraid’ person in the dataset. While 100 meant that person was afraid of the most things. Here’s a visualization of how those scores were distributed throughout the sample.
It’s pretty apparent that a huge chunk of the public scores between a 20 and a 50 on this metric. The overall mean fear index score in the entire sample was 38/100. Just 33 people out of a sample of 1,020 scored between a zero and ten on this index. Just 4 respondents were between 90 and 100 on this metric.
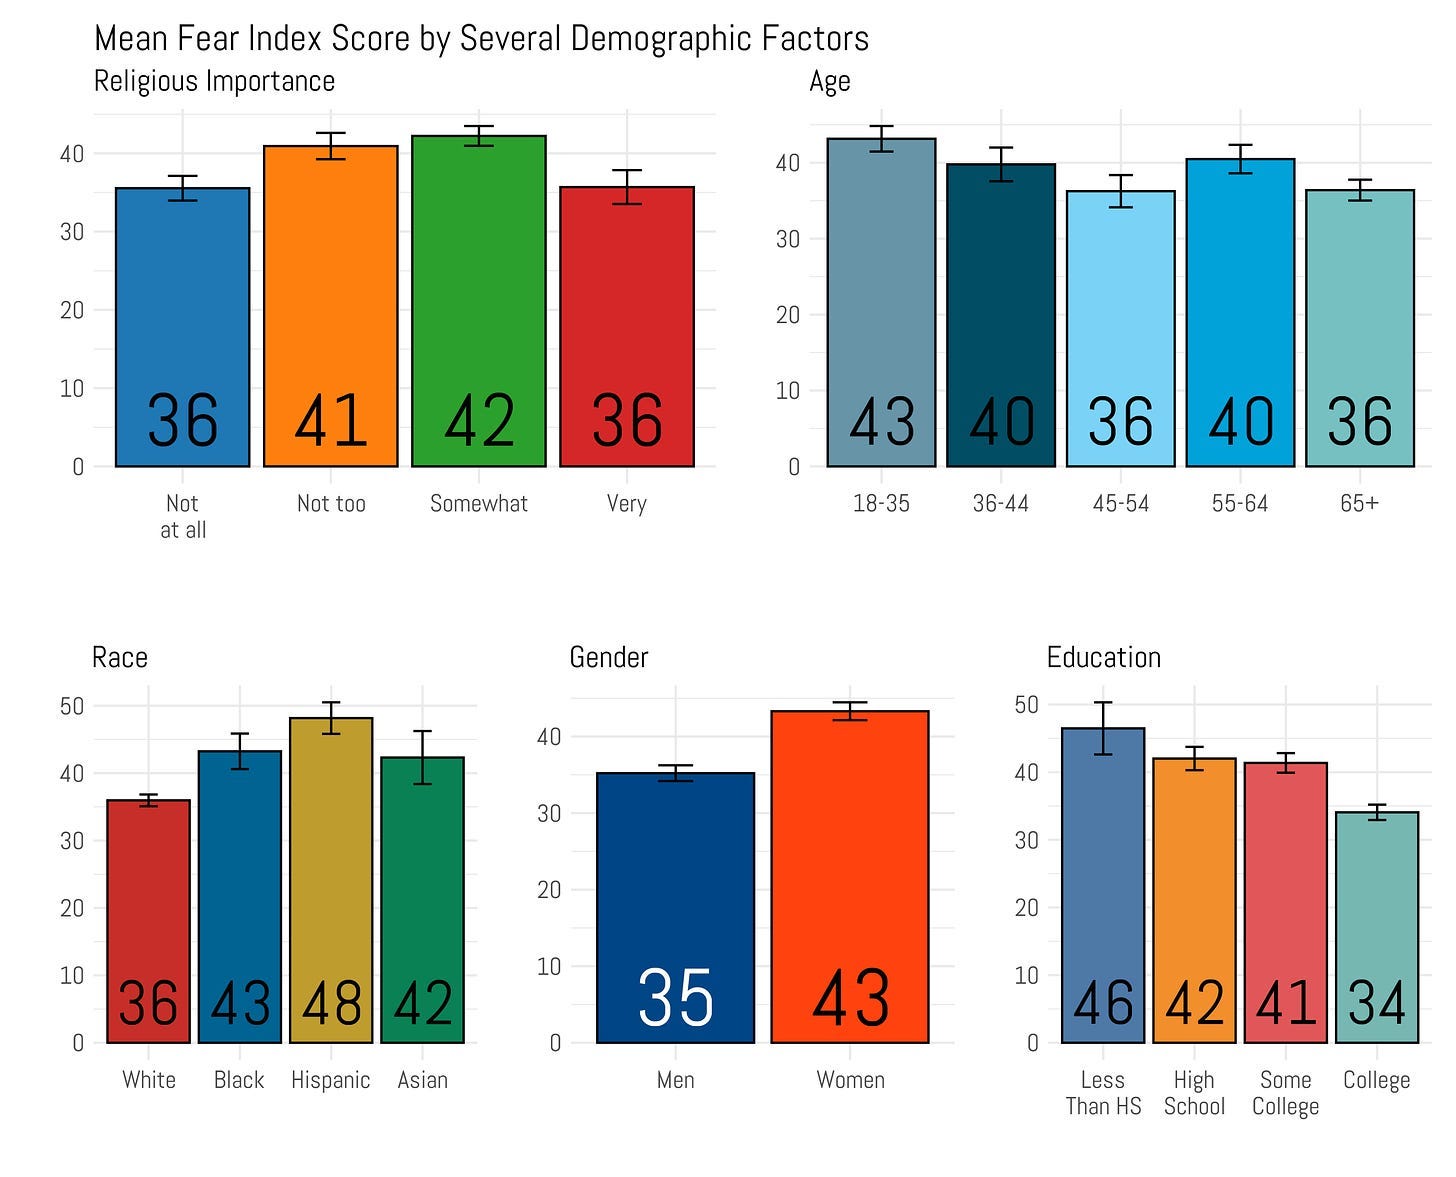
But before I start digging deeply into the relationship between religion and fear, I wanted to help orient us to how fear is distributed in the public on a number of demographic variables like age, race, and education. That’s what I did below.
I threw in a question about religious importance in the top left graph, just to give you a sense of how these variables work together. Notice how the least fearful groups are those who say religion is ‘not at all’ important and those who think that religion is ‘very’ important. That pattern is going to be repeated a bit later on.
When it comes to age, I think the clear conclusion is that the youngest adults are the most fearful in this sample. Among people between the ages of 18 and 35, the mean score is 43. However, once you get into the older part of the sample there’s not much difference. According to this data, a 50 year old person scores about the same as an individual who is 70 years old.
On race, the surprising finding is that Hispanics are clearly the most fearful group. Their mean score was 48/100. Remember that the mean in the entire sample was just 38. Black and Asian respondents were slightly lower at 43 and 42 respectively, but that was still above average. Meanwhile, whites scored the lowest at just 36/100.
When it comes to gender - there’s a pretty large gap. The average woman in the sample had a mean score of 43/100. For men in the survey, it was eight points lower at 35/100.
Also, the relationship between education and fears is clearly headed in one direction - the more education one has the fewer fears they admit to. Among those who didn’t finish high school, the mean score was 46/100. For those who had graduated with a four year college degree it was twelve points lower.
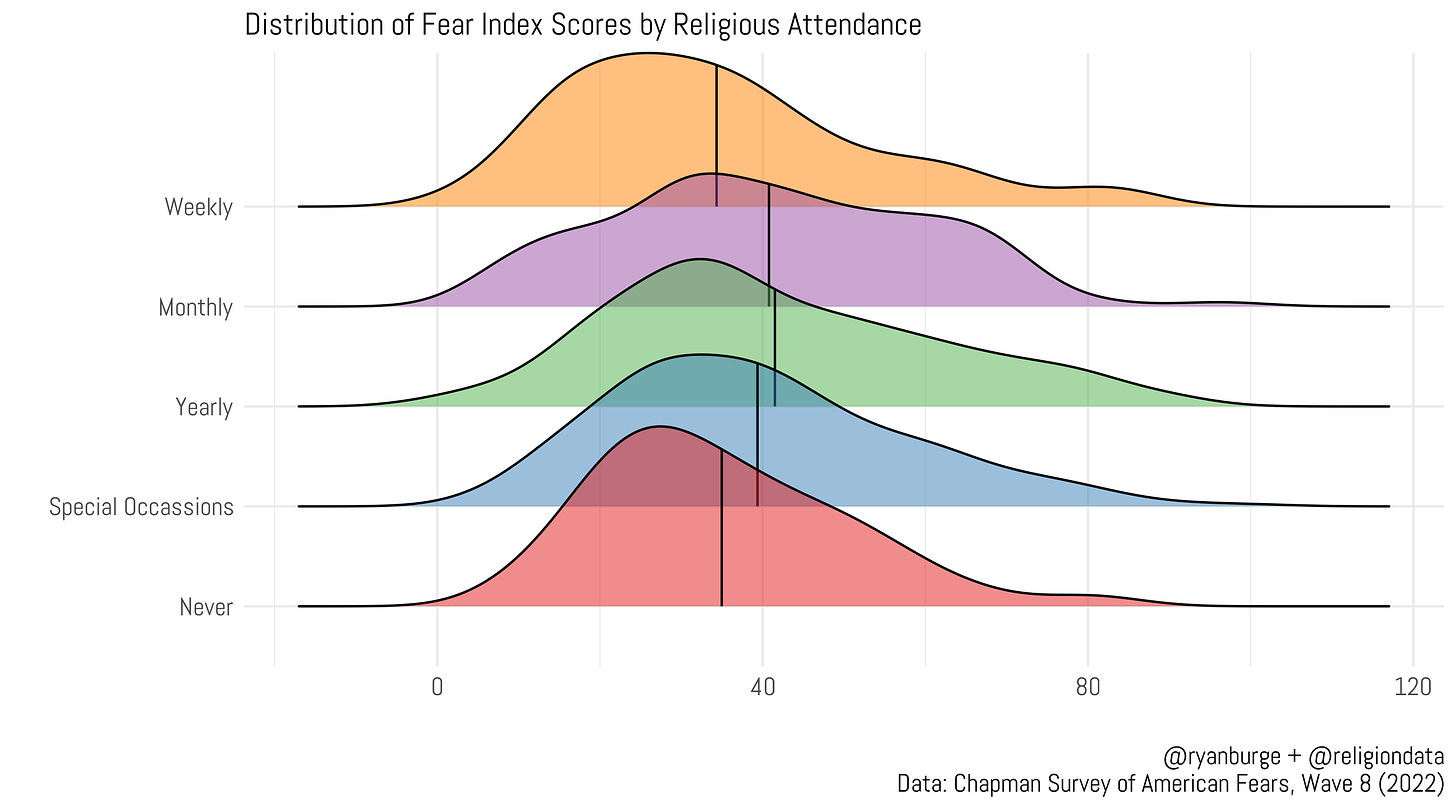
Now, let’s pivot to religion. Respondents were asked how often they attended religious services and I collapsed the scale into five categories ranging from ‘never’ to ‘at least once a week.’ I visualized the results using a ridgeline plot and then I marked the mean with the vertical black lines.
As you can see, there’s a curvilinear relationship between church attendance and fear. The people that score the lowest on this metric are those who never attend religious services and those who are weekly attenders (compare their respective vertical black lines). Their mean score was 37 and 35, respectively. The attendance level in which fear is the highest are those who are yearly attenders - they scored a 44. This result comports with the previous finding about religious importance. The people at either end of the spectrum score the lowest and those in the middle score the highest.
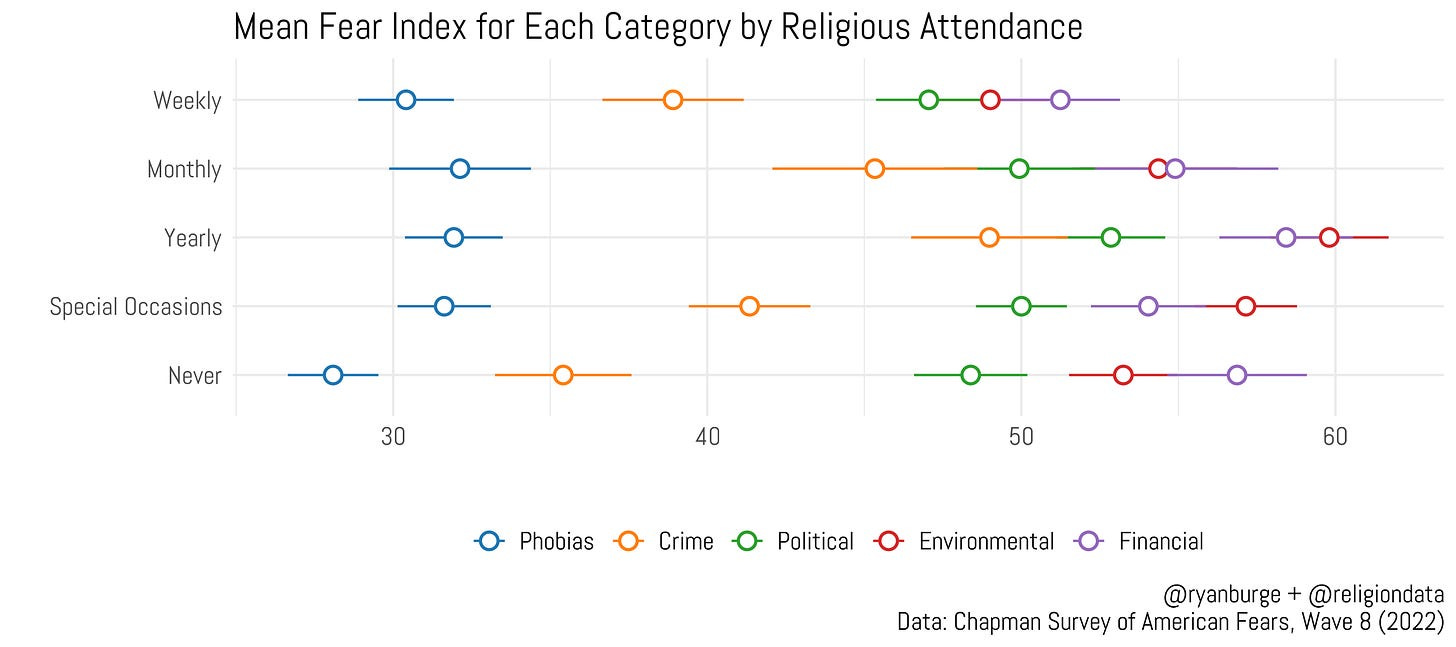
Let me take this analysis a step further by breaking the fears down into five broad categories: phobias, crime, political, environmental, and financial. I generated the same scale for each category, ranging from 0 to 100 and then calculated the mean for each category based on religious attendance.
It’s pretty clear that phobias (blood, heights, etc.) scored the lowest regardless of religious attendance. But when it comes to crime (being mugged, being sexually assaulted, etc.), there’s a strong curvilinear relationship. For those who never attended religious services, their mean score was only 36. It was 48 among people who attended yearly.
The next category up from crime was political fears. The gaps here between each level of religious attendance were pretty small, honestly. Although the overall mean score for the entire sample was right about 50. It’s tough to say which category is the most feared in this sample between environmental and financial concerns. At each level of attendance, the gap between the two scores was not statistically significant.
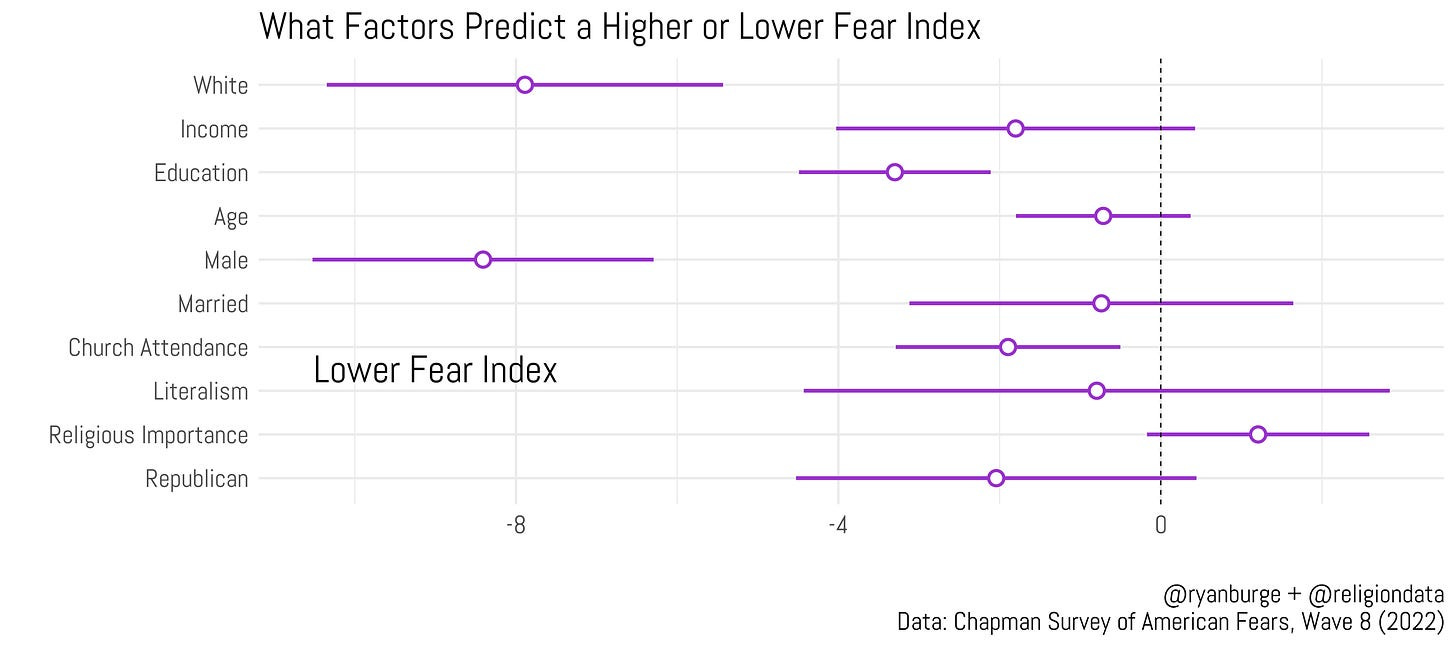
That got me wondering if I could determine what types of factors lead people to having a higher or lower fear index. So, I threw a bunch of variables into a regression where the dependent variable was the fear index that ran from 0 to 100. I also included a handful of religious questions and a measure of political partisanship. If the purple lines overlap with zero, that variable was not statistically significant.
I am really surprised at how few of these factors actually ‘pop’ in this analysis. That was true for things like income, age, marital status, view of the Bible, and religious importance. None of those had a measurable impact on the fear index. Also, I didn’t find a single factor that clearly led to higher levels of expressed fear.
However, there were four variables in this analysis that predicted a lower score on the fear index. They were: being white, being male, having a higher level of education, and increased church attendance. Holding all those other factors constant meant that each variable led to a noticeably lower score on the fear scale. But among those the two that were the most predictive were race and gender. Each factor resulted in a score that was about eight points lower.
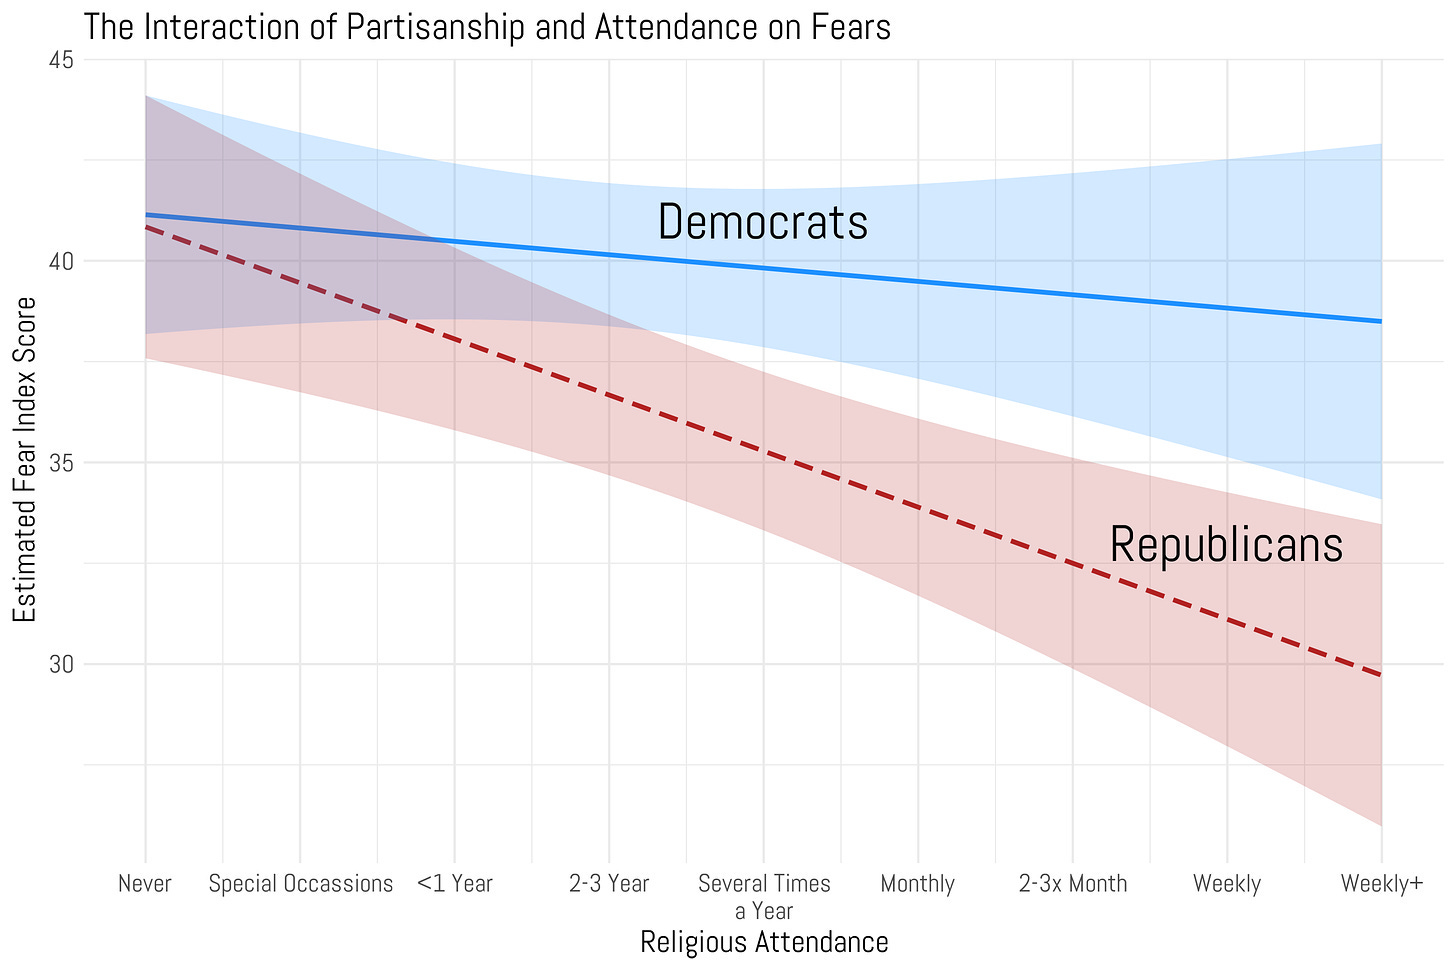
But I wanted to leave you with one more regression analysis. This time I interacted two variables–religious attendance and political partisanship–to see if politics is really that important when it comes to expressed fears.
Here’s the conclusion from the graph - among Democrats there’s no relationship at all between religious attendance and the fear index. Democrats who never attended church scored 41/100. Democrats who went to church scored 39/100 and the difference was not statistically significant. However, among Republicans there was a clear relationship between attendance and fear. For folks aligned with the GOP, attending church more than once a week led to a ten point reduction on the fear index compared to never attending Republicans.
It’s hard to look at this analysis and have a really clear conclusion about the relationship between religion and fear. Never attenders and weekly attenders look very similar on a lot of these metrics. It’s the occasional attenders that express higher levels of fear on these topics. Maybe a little bit of interaction with others in religious settings, but not too much, is the right recipe to generate increased fear levels. I feel like that’s a finding that should warrant some future investigation.
Code for this post can be found here.


This is interesting but ultimately I’m unconvinced that a mean score of 39 vs 43 converts to a meaningful difference in an actual life. We aren’t talking about skipping on edges of high buildings vs wearing helmets to garden here.
That being said the trend of sometimes attendees ranking lowest is true in other areas. I know that men who attend church rarely treat their wives more poorly while those with high attendance and nonattendance do much better. I think (and I’m less sure of remembering this) that there is a similar trend with child rearing as well. I guess what Jesus says is true, I wish you were hot or cold.
Once again, thanks to the Lilly Endowment for making this post public.