



This post has been unlocked through a generous grant from the Lilly Endowment for the Association of Religion Data Archives (ARDA). The graphs you see here use data that is publicly available for download and analysis through link(s) provided in the text below.
Let’s say we did a random sample of the adult population of Ohio in 1985. In that poll, we found that 55% of people identified as politically conservative and 35% were liberal, with the remaining 10% indicating that they were ideologically moderate. Then, we did another poll of adults in Ohio forty years later. This time we found that conservatives were just 35% and liberals had jumped up to 55%. What could possibly explain that kind of shift?
Well, there are two primary drivers of that change.
The first could be the fine people of Ohio just changed their minds about political stuff. Maybe they got fed up with Republican politicians. Or it’s possible that a really charismatic liberal rose to national prominence and convinced the rural Midwest that a pathway to a better life was to shift to the left.
Or, it could be that the actual people living in the state of Ohio changed a whole lot over that forty-year window. Of course, when you are looking at a four-decade span, you are going to have a whole lot of generational turnover. But you also have migration happening. Columbus has exploded in population, for instance.
Either (or a combination of both) could lead to a change in the ideological composition of a place like Ohio.
But the same basic process always looms behind the scenes when I am doing analysis of how religious groups have changed over time. In my most recent book, I provide a lot of data that points to the fact that white evangelicals are way more conservative today than fifty years ago. What’s interesting about that is that evangelicalism is about the same size today as it was back in 1972 (around 20% of the population).
Other religious groups have gotten smaller over time, though. Mainline Protestants are down by at least two-thirds since 1975 (from 30% to less than 9%), and Catholicism has also seen a noticeable decline in the last fifteen years (27% → 22%). So, given all these changes and shifts, one has to wonder: are those who still identify as Christians actually more devout today than the same group from a couple decades ago? A “we may be smaller in number but we are mighty in Spirit” kind of thing.
Well, let’s test that idea. The Association of Religion Data Archives (ARDA) hosts the entirety of Pew’s Religious Landscape Survey. It was fielded in 2007, 2014, and 2023-2024. But before we dig into compositional changes, I wanted to start by visualizing how the three largest religious traditions — evangelicalism, mainline Protestantism, and Catholicism — have changed across generations over time.
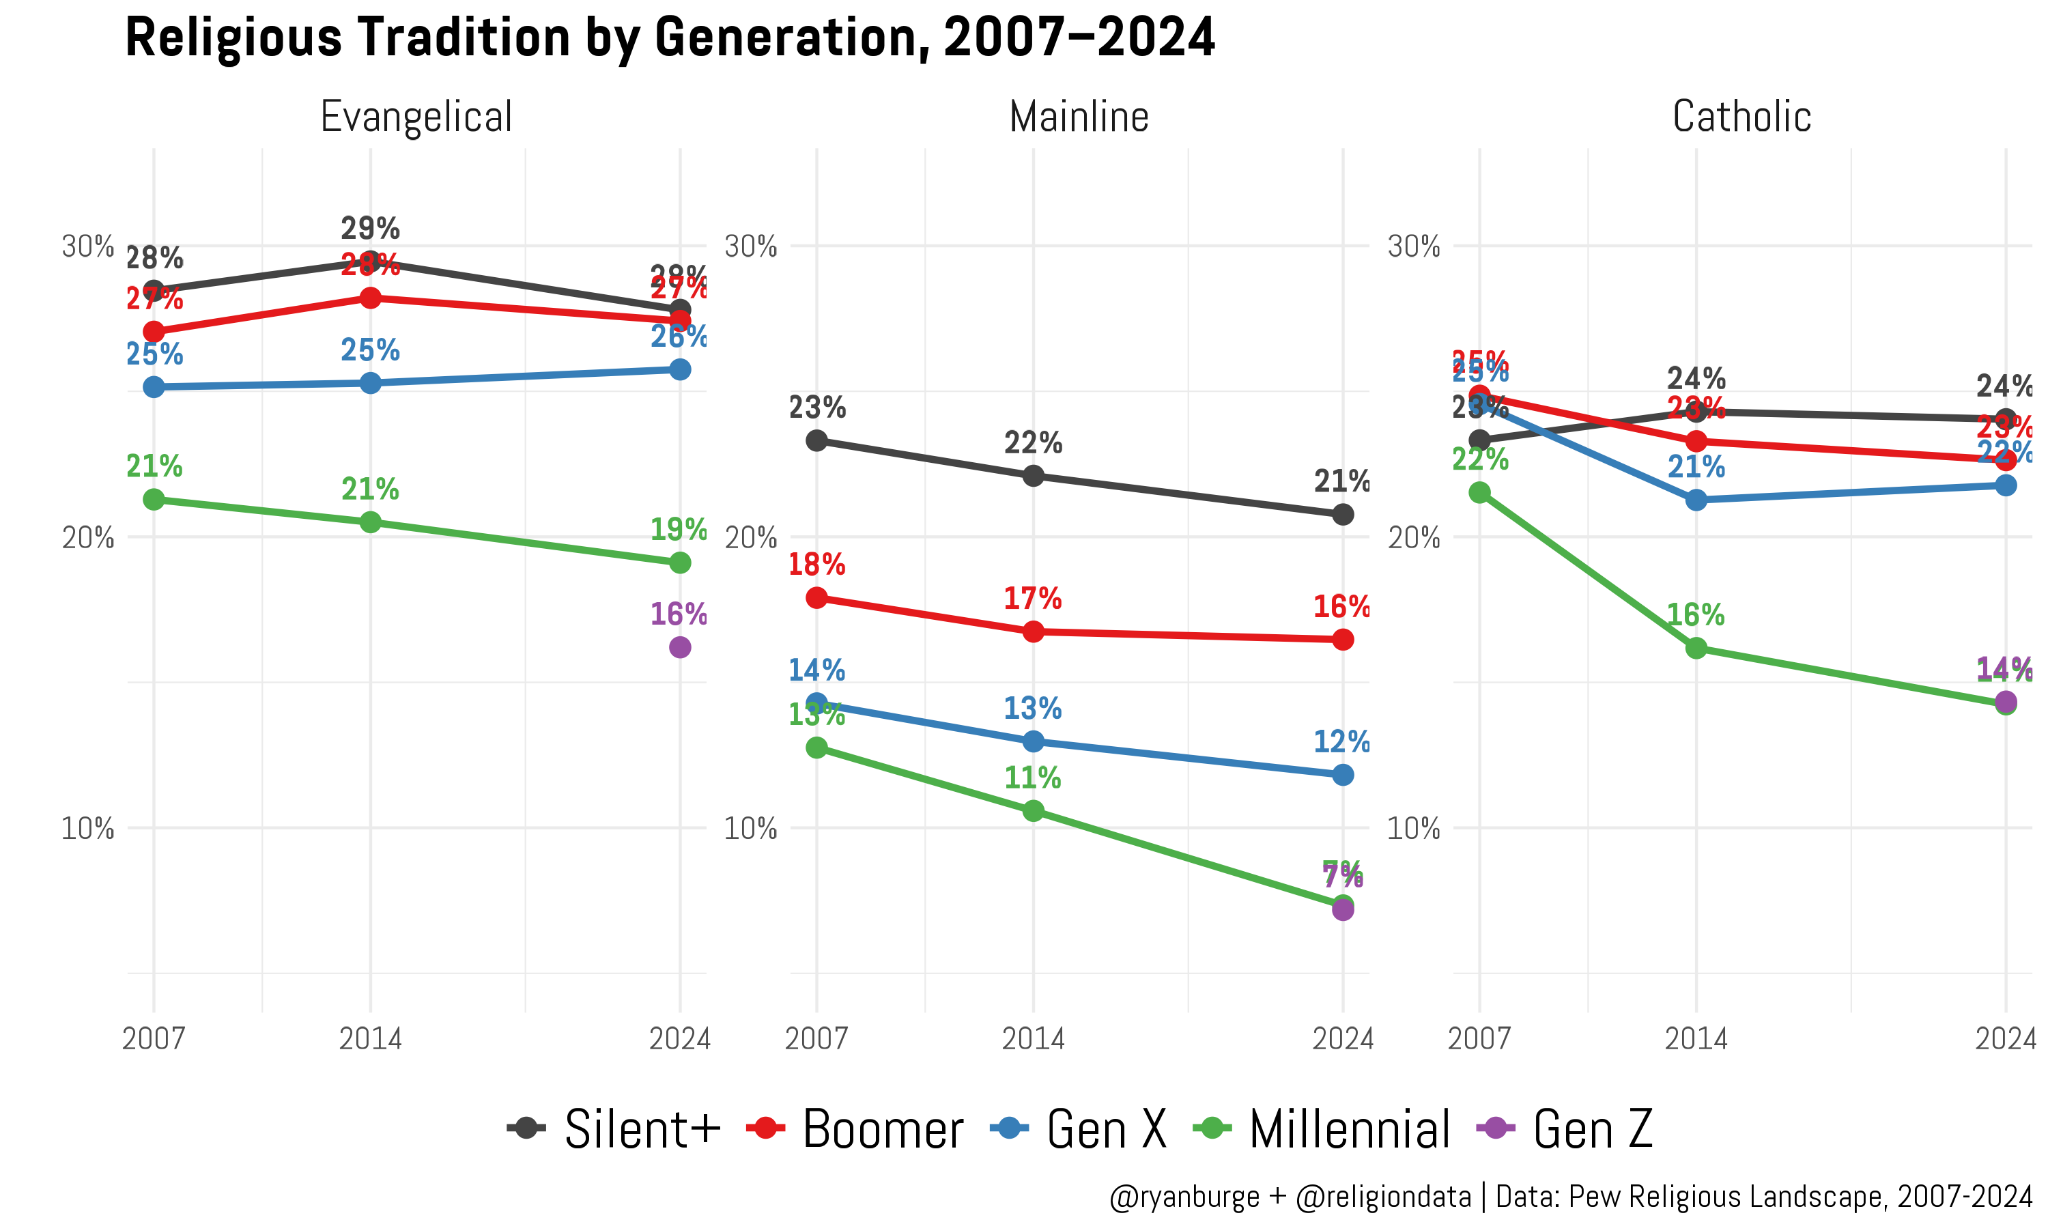
The left panel above is the share of the population who identifies with an evangelical tradition. You can pretty quickly figure out that evangelicalism was at least a quarter of every generation from the Silents to Gen X. But then Millennials are a whole lot lower on this metric — just 19% are evangelical. For Gen Z, it’s even lower at 16%. That’s a ten-point difference in just two generations.
But one thing evangelicals have going for them is that there’s really not a consistent slope in the lines. They don’t seem to be losing people as they age. The same is not true for mainline Protestants. Every single generational line points downward — often in the two-point range. What is even more worrisome, though, is the clear drop from one generation to the next. Among Boomers, 16% are still mainline. For Millennials and Gen Z, it’s just 7%.
The Catholic story is a whole lot messier. For Silents, Boomers, and Gen X, the three lines are a rat’s nest. They are all really close to each other in a tight band from 21% to 24%. I just don’t think there’s a lot of movement there in either direction. For Millennials, though, the story is incredibly clear. Back in 2007, 22% of Millennials identified as Catholic. Now, it’s 14%, which is the exact same share of Gen Z in the most recent data.
Now that we have a good sense of the broad trends around affiliation, let’s look inside each generation to see how they have changed on a bunch of metrics. The first thing I calculated was weekly attendance rates.
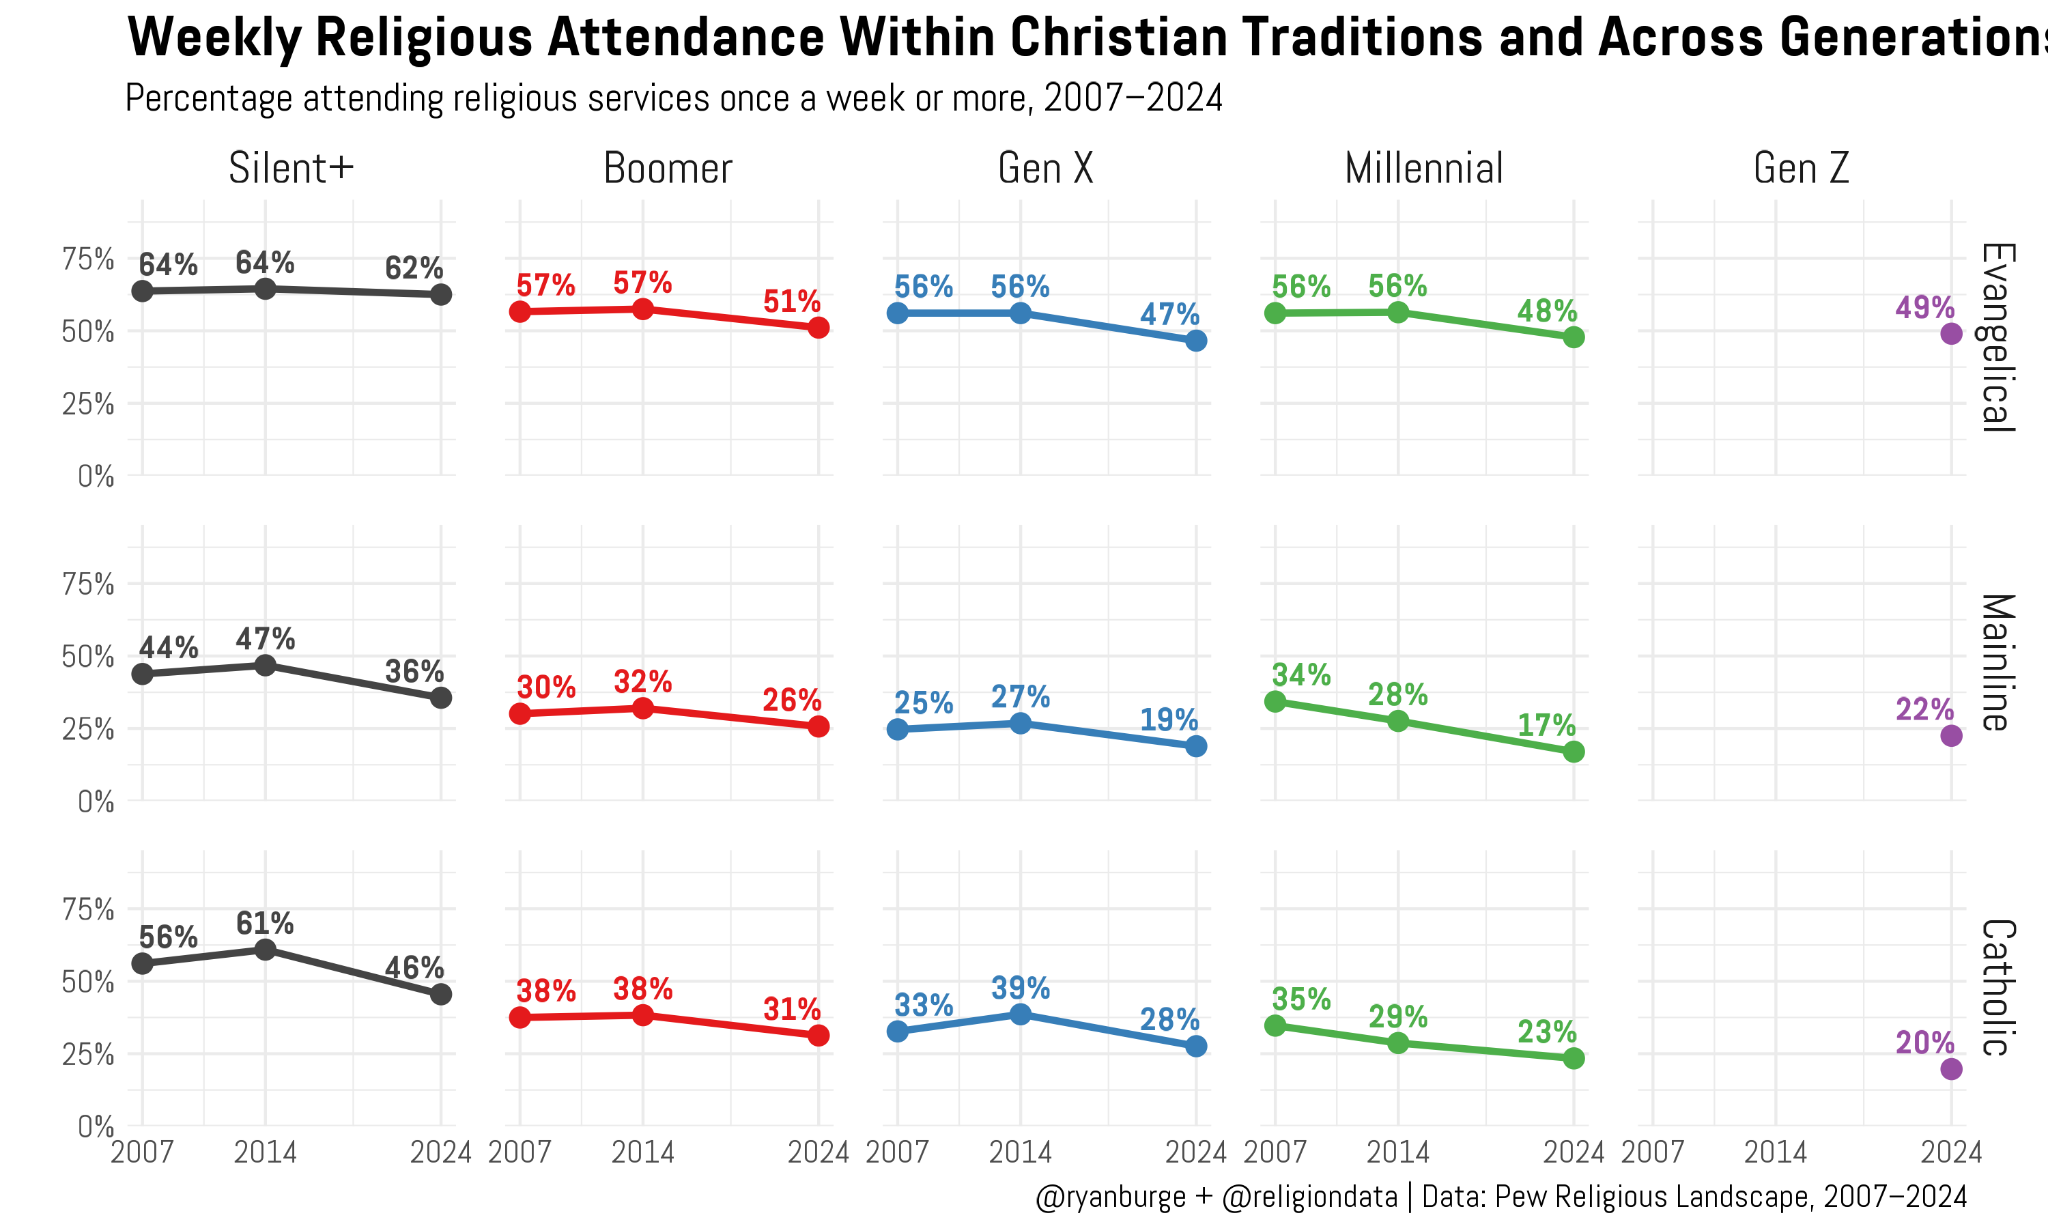
The trend among evangelicals is really easy to spot. Between 2007 and 2014, weekly churchgoing rates didn’t move in a meaningful way for any group. Attendance was clearly higher for the oldest respondents, but from Boomers on down to Millennials, 56% were at church every weekend. However, for every generation from the Boomers and younger, there’s been a big dip in attendance. It’s fallen between six and nine percentage points. Now, a majority of evangelicals aren’t showing up every week.
That same pattern of stability between 2007 and 2014, followed by a big dip in 2023-2024, is there among mainliners and Catholics, too. The big difference, though, is that these last two groups of Christians just don’t go to church nearly as much as evangelicals. The typical mainliner has a weekly attendance rate that is 25 percentage points lower than their evangelical cousins. Catholics stand somewhere between the two.
What about the political viewpoints of each group?
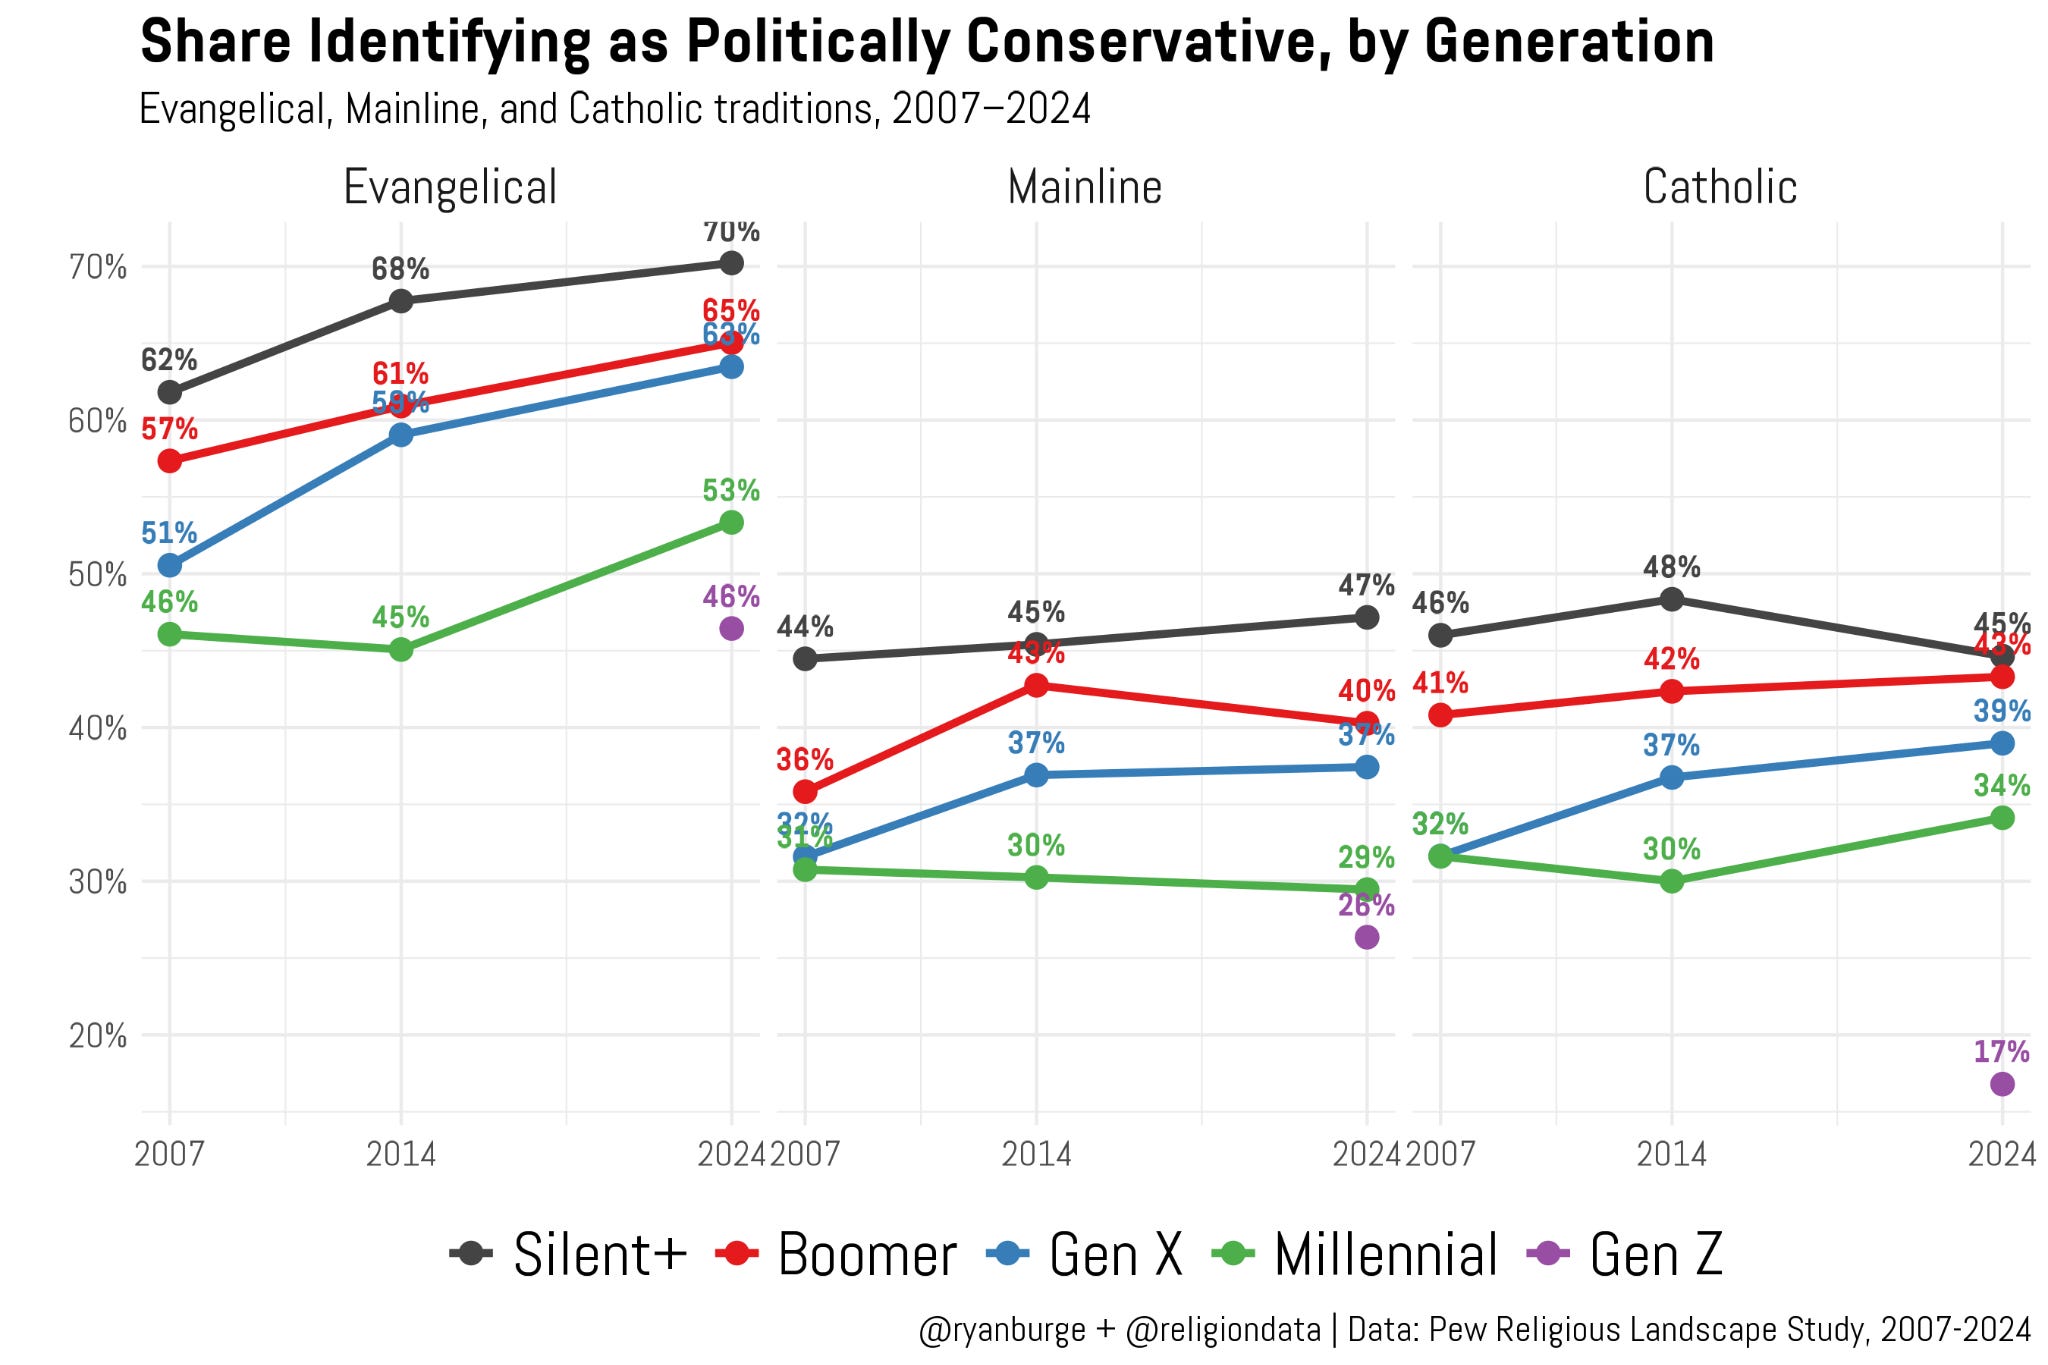
One thing that is absolutely impossible to miss is how clearly those evangelical lines are moving upward. Every generation of evangelicals is more ideologically conservative now compared to 2007. For Gen X, it’s a twelve-point bump (51% to 63%). It’s seven points for Millennials. But note that Gen Z evangelicals are at 46% conservative in 2024. That’s where Millennials were seventeen years ago.
The mainline and Catholic numbers are just completely different in levels and trends. The simplest way to describe the trajectory is pretty flat, really. There does seem to be a macro-level move in the conservative direction, but not nearly the same amount of movement here compared to evangelicals. For instance, among Gen X mainliners, the conservative share is up five points. It’s seven points for Catholics from the same generation.
But the other thing I need to flag is how there is a clear gap between each generation. Boomers are more conservative than Gen X. Gen X is more conservative than Millennials, and Gen Z is less conservative than the prior generation. And I would be derelict in my duty if I didn’t point out Gen Z Catholics. Just 17% identify as ideologically conservative. That’s half the rate of Millennial Catholics. Certainly something to watch.
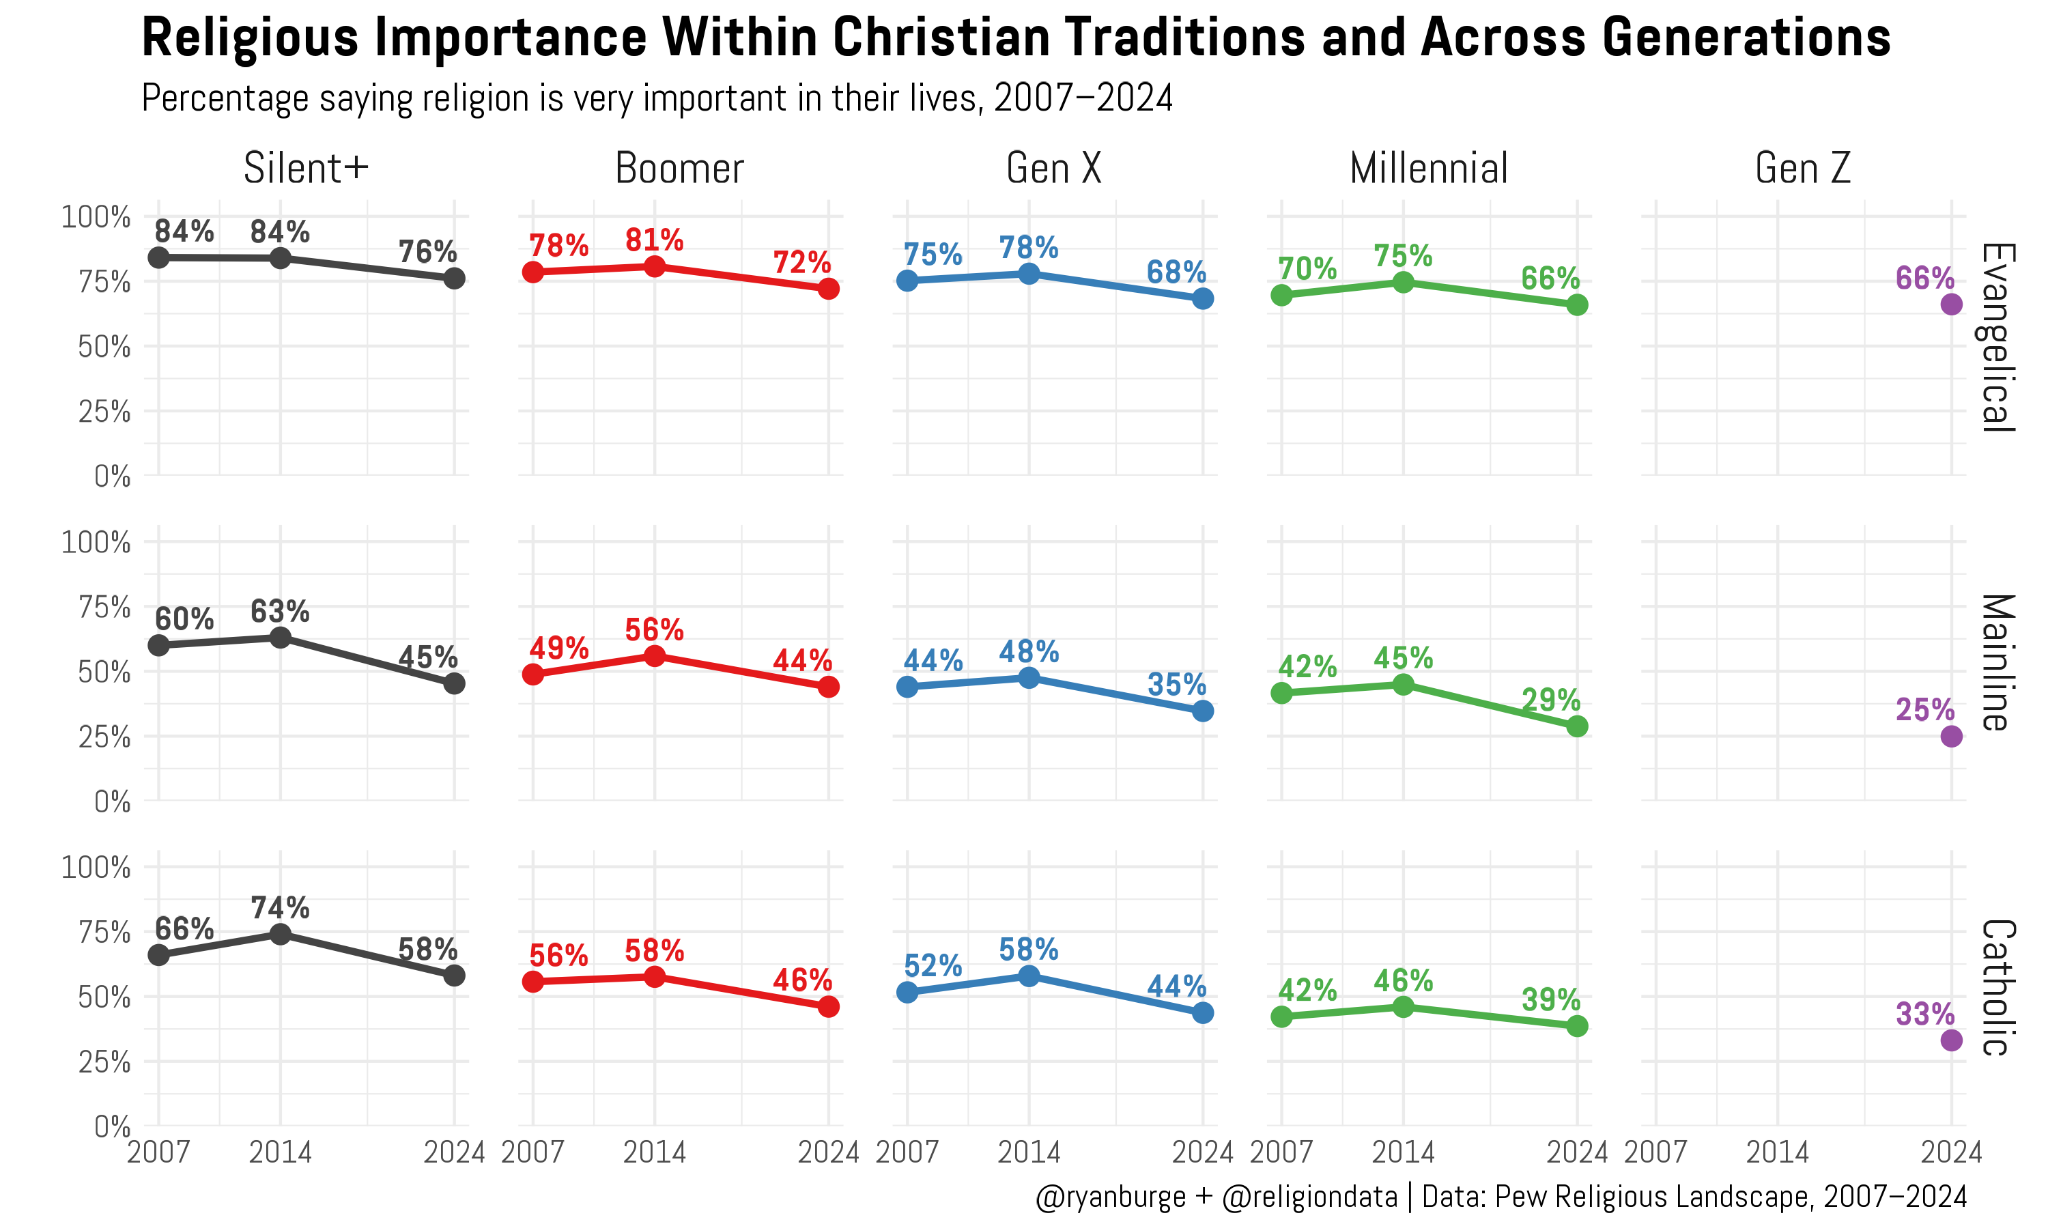
The graph is focused on the issue of religious importance and it has a lot of echoes of the analysis of religious attendance. There was a general sense of stability between 2007 and 2014. The only difference here is that there are some signs of slight increases in importance in those first two waves. However, across the board you can see that religious importance dropped in a huge way between 2014 and 2024. For Boomer evangelicals, it went from 81% to 72%. It was down a dozen points for mainline and Catholic Boomers, too. That’s pretty incredible to think about.
For Gen X, the drops were substantively large as well. Ten points for evangelicals, thirteen points for mainliners, and a whopping fourteen points for Catholics. But the Millennial drops were pretty large, too, especially among mainliners. In 2014, 45% said religion was very important to them. A decade later, it was just 29%. That may be the most revealing thing — how important religion is to younger evangelicals compared to the other two groups. I mean, look at Gen Z. Among evangelicals, 66% rated it as very important. It was just 33% among young adult Catholics and 25% for mainline Protestants.
However, let me show you one more metric — this one focused on how certain respondents were in the existence of God.
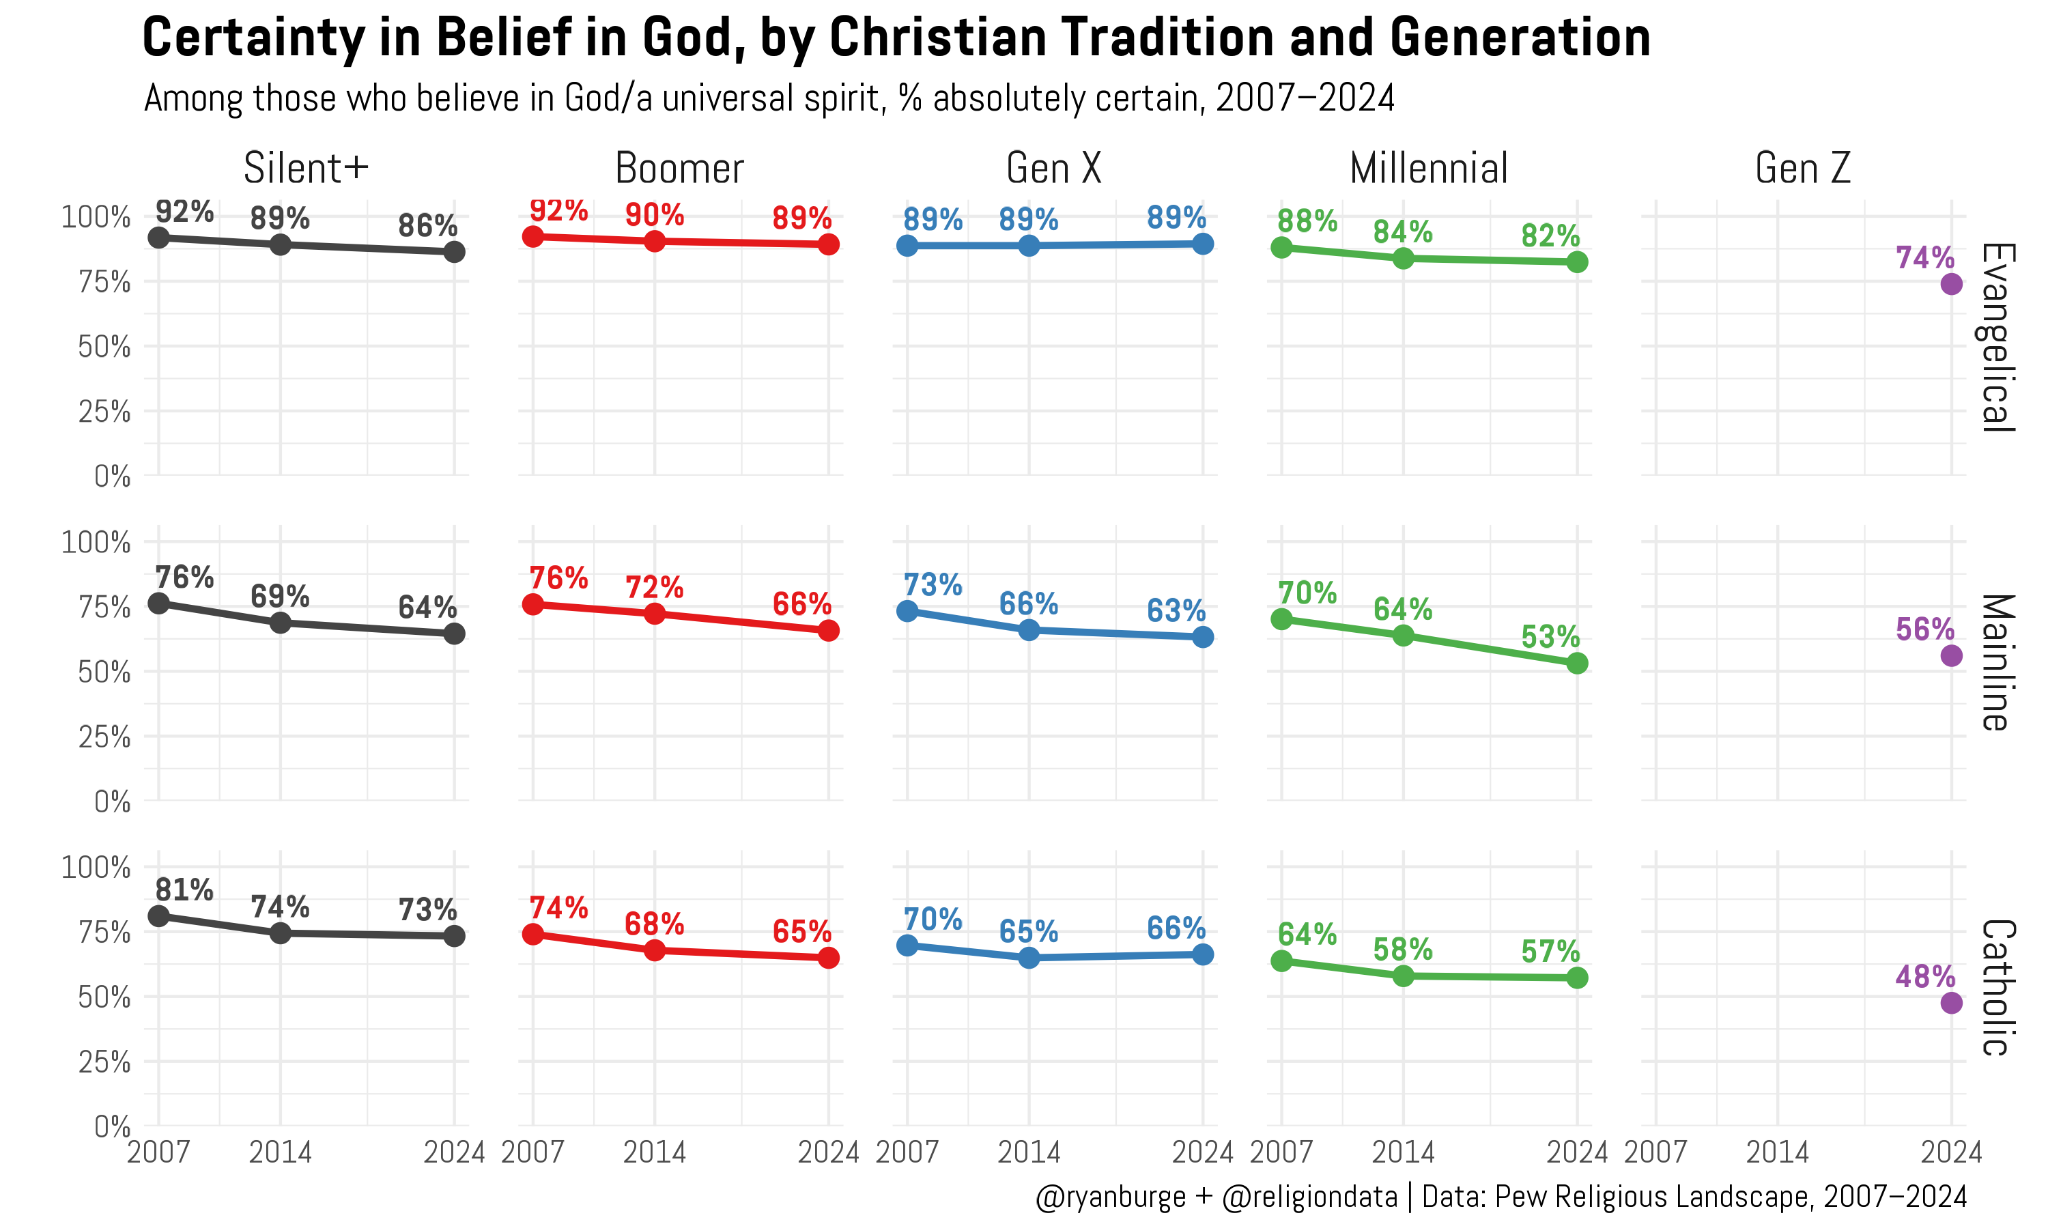
While the last couple of graphs were relatively stable between 2007 and 2014 before a big drop in 2024, this belief item bucks the trend because certain beliefs have consistently eroded across the full time series. For Boomer Catholics, those figures went: 74% → 68% → 65%. That’s a really common progression you see across the bottom two rows — a dip of ten points across seventeen years.
That’s not what emerges from the evangelical subgroup, though. Their lines do drop, but the magnitude of the decline is modest. For Boomers, it’s just three points. For Gen X, it’s no change at all (89% straight across the board). You do see a little dip among Millennial evangelicals (88% to 82%), but that’s easily the most change across the entire top row.
After looking at all of these, I get the sense that secularization has not eroded the devotion of these three groups at the same rate. Evangelicals consistently score the highest on all these metrics, while mainliners and Catholics started out lower and have seen their numbers continue to decline over time. That means not only has the share of Catholics and mainline Protestants gone down, but even the ones who remain are not as religious either.
So are evangelicals holding strong against the forces of secularism? I tested that by creating a religiosity index that averages three measures — whether religion is very important in daily life, weekly-or-more worship attendance, and absolute certainty in God’s existence — into a single 0-100% score per respondent. Anyone who scores religious on all three components sits at 100%; someone who scores religious on none of them sits at 0%. Then I compared two groups: evangelicals vs. all other Christians.
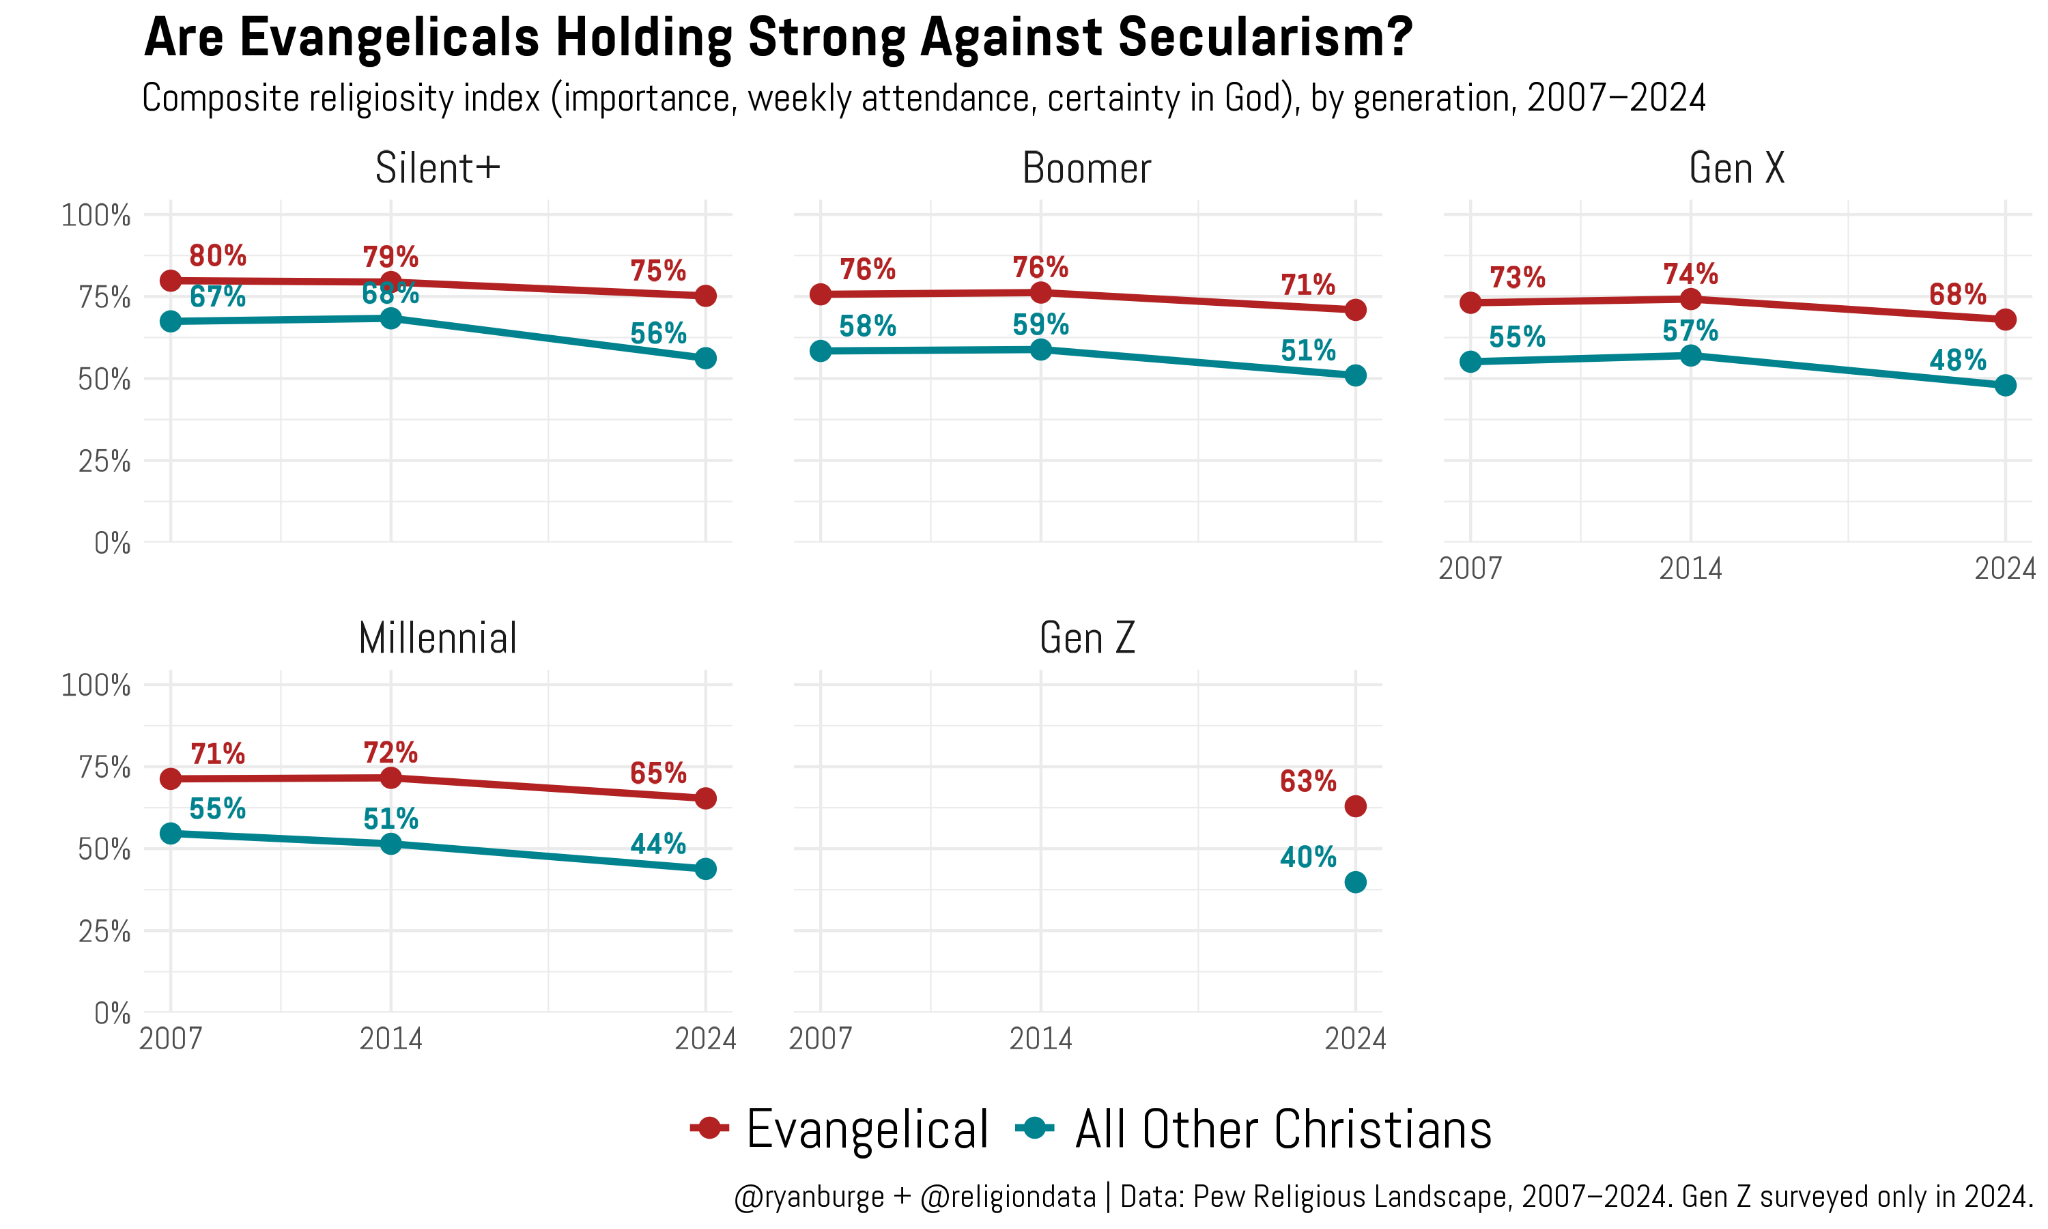
The first conclusion from this graph is the least surprising one based on the prior analysis: evangelicals are more religious than other Christians. That’s true at all three sampling periods and across all generations. Evangelicals take their faith seriously, and it shows up consistently. The gaps are often pretty sizable, too. The average evangelical scores about twenty points higher on the religiosity index compared to other Christians.
But are evangelicals managing to push back against secularization? The answer is no — not entirely. Look at any single line on the graph and it moves the same direction: down. Silent+ evangelicals dropped from 80% to 75% between 2007 and 2024. Millennial evangelicals fell from 71% to 65%. Every generation of evangelicals is less religious today than the same generation was a decade or two ago. Secularization isn’t skipping over them.
What’s actually happening is more subtle than “holding strong.” Evangelicals are declining more slowly than other Christians, not staying flat while everyone else falls. Millennial evangelicals dropped six points over that span; Millennials in other Christian traditions dropped eleven. That’s the pattern across every generation — the evangelical line has a gentler slope, and the gap between the two groups actually widens as you move to younger cohorts, from about 13 points among the Silent+ generation to 20+ points among Millennials and Gen Z.
So evangelicals aren’t immune to secularization. They’re just secularizing more slowly than the Christians around them.
Remember the example of ideology in Ohio I mentioned in the introduction? If liberals and conservatives completely flip-flopped, why is that? Did people change their minds, or did new populations of liberals move in while a lot of the conservatives died off? Well, if you can control for the age of the respondent, you can shed a lot of light on how shifts like that took place.
Why are Christians today less devout than Christians from 20 years ago? The answer is twofold: younger Christians today are less religious than younger Christians from 2007. But we also know that Christians, regardless of tradition, are secularizing as they age as well.
How do aggregate changes happen in a population? It’s usually a bit of column A and a bit of column B.
Code for this post can be found here.
Ryan P. Burge is a professor of practice at the Danforth Center on Religion and Politics at Washington University.

I have one question, especially in terms of Catholics, is to what degree ethnicity plays into this. I was born and grew up in the Chicago area and lived there from 1950 to 1992. Since that time I have lived on the west coast.. In the Chicago that I knew Catholic churches tended to be dominated by a particular ethnicity -- Polish, Italian, Irish. In fact I once had a Polish-American girl friend who took me to a church that did the mass in Polish. Since moving to the west coast one sees a different attendees at Catholic churches with many Hispanics as well as other ethnic groups. It strikes me that as the generations become farther removed from the immigrant generation the ethnic ties may weaken and the Church that once served as a community centere may lose some of its gravitational pull.
I'm interested in the methodology used to conclude that 55% of Ohio is liberal. The most recent Gallup survey I could find pins iberals at 21% in Ohio. The conservative result corresponds to the sample you describe, at 36%. Moderates comprise 37%. I think it's highly unlikely that 100% of moderates would suddenly identify as liberal. Something's off. That, and Ohio is arguably much more politically conservative today than it was 30 years ago--2026 aside, when candidate quality and a national environment may give Democrats some wins in the state.