Approval For Same Sex Marriage Has Stopped Increasing
Who Are the Holdouts?
One of the most interesting trends in public opinion research over the last twenty years is the issue of same-sex marriage.
The General Social Survey first asked about it in 1988. 18% of respondents said that “homosexual couples should have the right to marry one another.” They didn’t ask about it again until 2004, when the share in favor had more than doubled to 37%.
That number just kept racing upward in every subsequent year. By 2014, a majority favored same sex marriage (57%).
In 2018 it was 68%. In twelve years the share of the public who favored same sex marriage rose 33 points. That’s insanely fast in public opinion.
But check this out.
Share in favor in 2021: 64%
Share in favor in 2022: 67%.
Yeah, that progress has stalled out. Maybe even reversed itself a bit.
This post is about trying to sort all that stuff. Who are the holdouts? And is it likely that there’s just a ceiling for support of same-sex marriage?
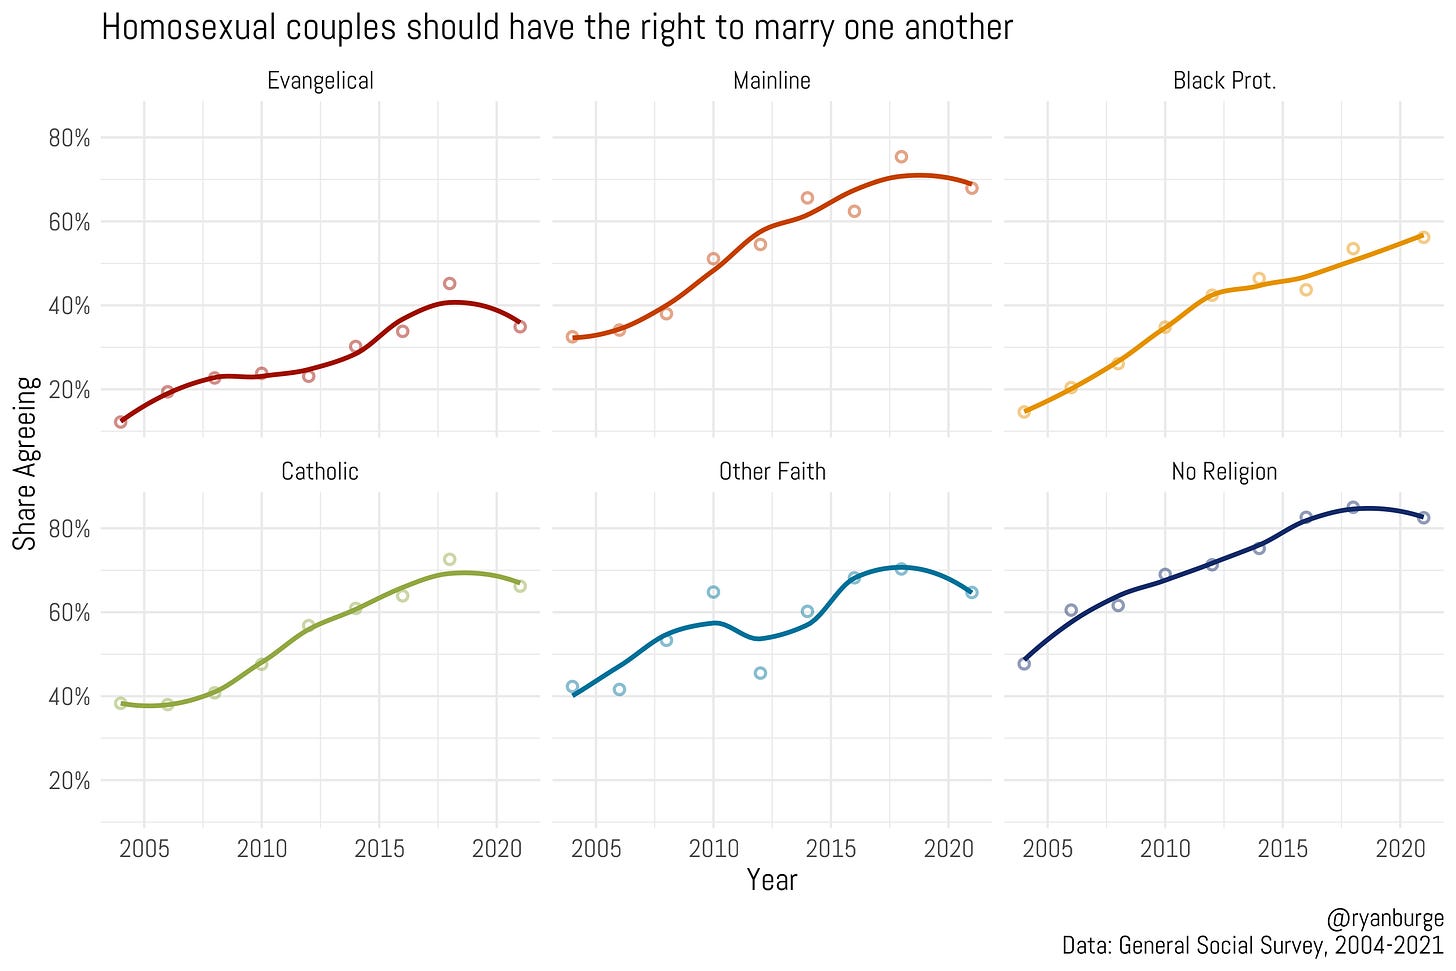
Let’s start with religious traditions. I can only get us to 2021 because the first release of the 2022 data doesn’t have the variables I need to make the calculation.
Support for same-sex marriage is above sixty percent for Mainline Protestants, Catholics, those of other faith traditions, and those who claim no religion. For evangelicals, support is currently just below 40%, and it’s not quite 60% for Black Protestants.
But we still see that aforementioned ceiling again for most of these groups. The only exception is Black Protestants who have continued to report higher levels of support for same sex marriage. For all other groups, things have held steady since 2018.
I can get us through 2022 if I look at religious attendance, though. That can give us two data points beyond 2018 to better identify if this is a trend or just an aberration.
Obviously, religious service attendance is negatively related to support for same-sex marriage. 80% of never attenders are in favor compared to just 40% of those who go at least once a week. However, that plateau in the trend line is still evident in the data. Among never attenders, support has barely budged from 2016. For yearly attenders, it may have actually gone down just a bit. The only group that is continuing to rise is those who attend religious services once or twice a month.
One more set of smoothed lines to investigate another variable: age. Maybe what’s happening is that the youth are moving toward the left on this issue and the older folks are moving to the right and that is causing that flat line overall. This is the data broken down into five-year birth cohorts.
For older cohorts, there’s been a clear leveling off, if not a downturn in support for same sex marriage. But the second row is a different story. Among people born between 1960 and 1979, there has been a small but noticeable increase in support. The youngest cohorts across the bottom show a really hard ceiling on the data. For instance, among those born in the 1980s, support is at least 70% but it hasn’t risen above that in the last few years.
The story I am seeing here is that there are a core group of holdouts who are just not going to budge on same-sex marriage. Clearly a lot of people who were in the middle of this issue moved toward the side of allowing same-sex marriage, but the committed haven’t budged.
So, who are they? I tried to paint a very detailed picture in a bunch of graphs below.


