

There's Been a Backlash Against Same-Sex Marriage Among a Growing Group of Christians
It's a coalition of young and old, infrequent and frequent attenders. But it's clearly there.

Public opinion is a weird thing. On some topics, it’s incredibly stable over time. That was the case for abortion for decades. I remember leading a discussion about that in graduate school when I was a teaching assistant. If you traced long term survey trends about the topic, the public’s views in the early 2000s didn’t differ that much from answers to those same questions thirty years earlier. But there are other issues where viewpoints shifted incredibly rapidly. Support for same-sex marriage is clearly one of those topics.
The General Social Survey asked about this for the first time in 1988. The share of the sample agreeing that gay couples should have the right to marry was 11.7%. Then, they stopped asking the question for a long time. Then, they added it back to the core of the survey in 2004. I am guessing this was because the topic was center stage in the election between George W. Bush and John Kerry. Thirteen states had a constitutional amendment on the ballot to codify marriage being between one man and one woman. It passed in all thirteen.
Approval For Same Sex Marriage Has Stopped Increasing

One of the most interesting trends in public opinion research over the last twenty years is the issue of same-sex marriage.
In the 2004 GSS, 31% of people believed gay couples should have the right to marry. Two years later, it was 35%, then it jumped four more points by 2008. Just think about this - when Barack Obama was elected president in 2008, 39% of the country favored same-sex marriage. When he faced Mitt Romney for reelection in 2012, support for same-sex marriage was 49%. When he left office in 2016 it was 59%. A twenty point increase during the Obama administration. That’s probably why Obama changed his public stance on the issue in the Spring of 2012 - the political winds have shifted.
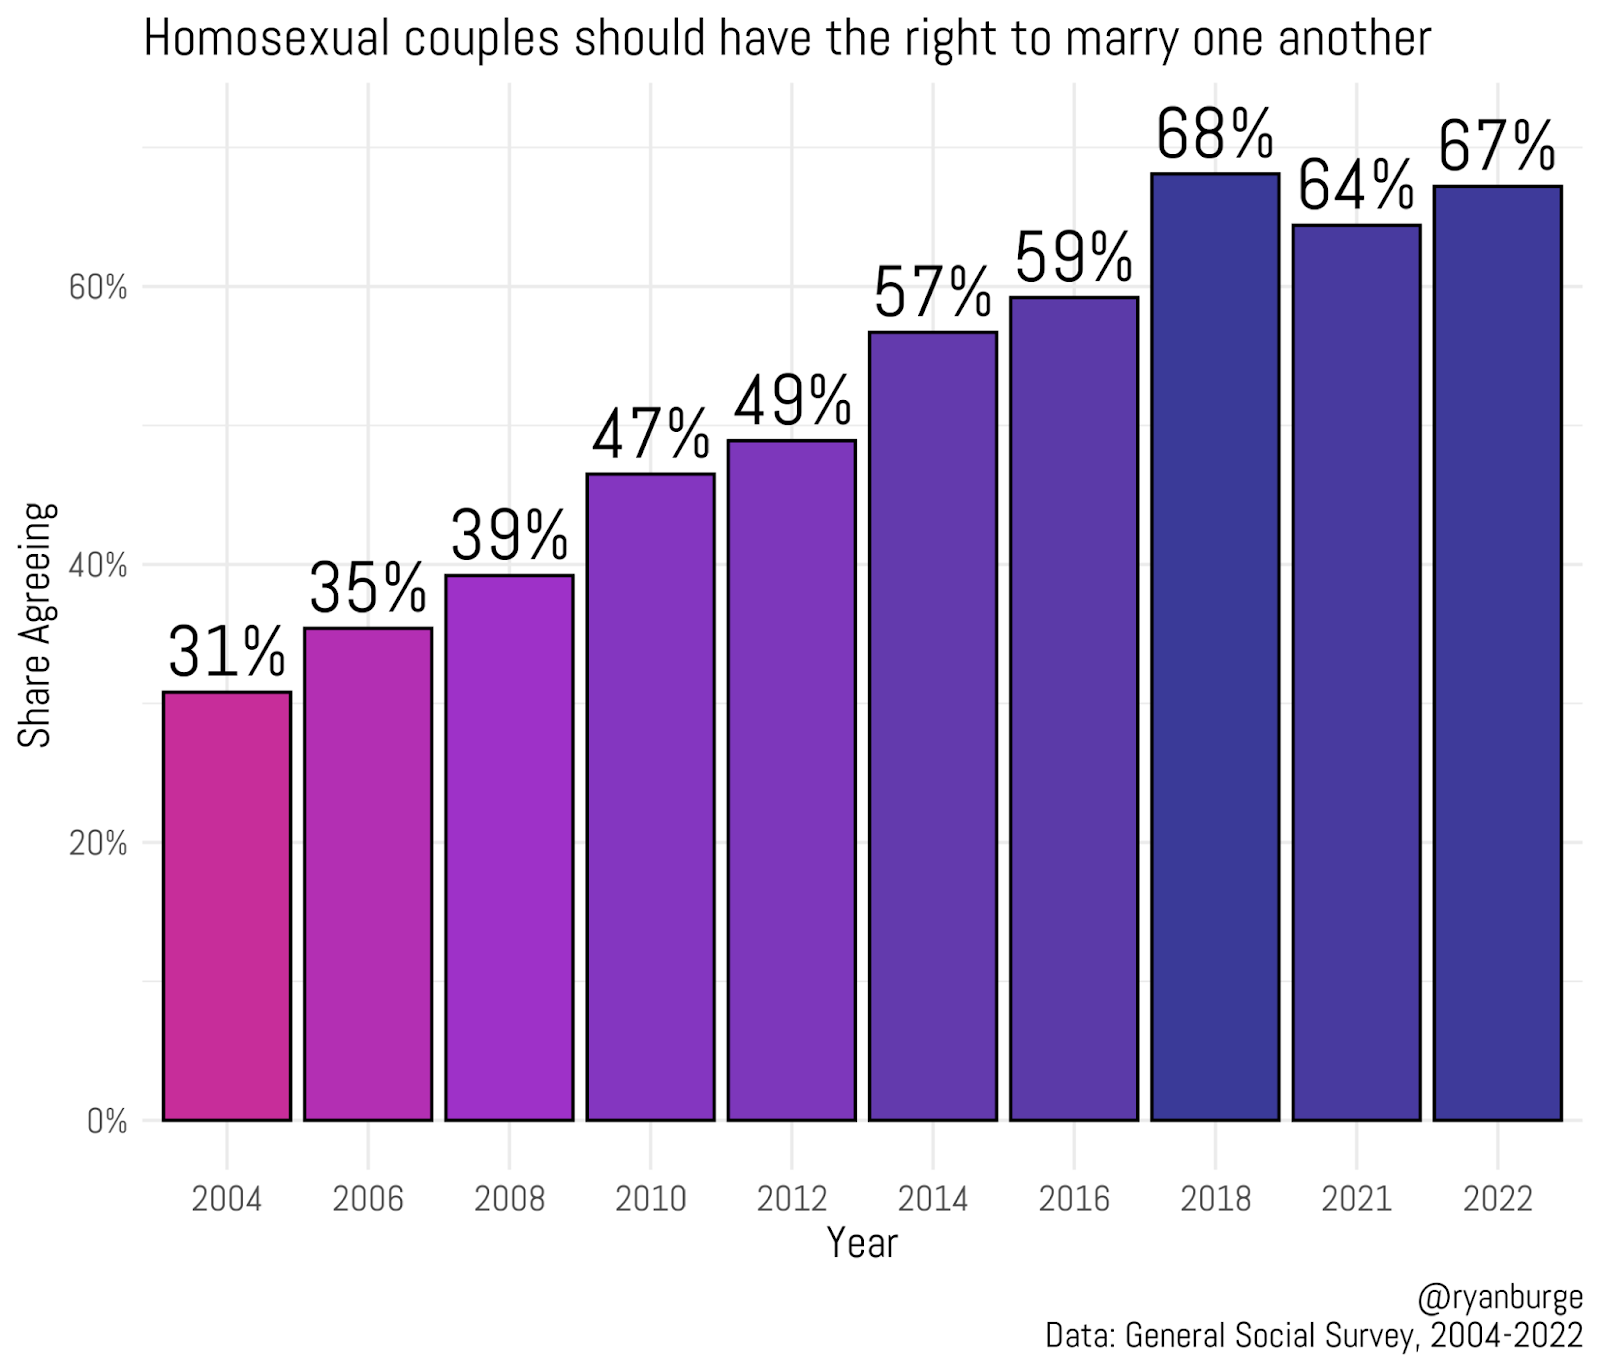
Trump took his place in the Oval Office in 2016 when support for gay marriage was at 59%. Then it jumps a full nine points by the 2018 midterms. In a fourteen year time period, support for same-sex marriage went from 31% to 68%. That’s just a stunning shift in such a short period of time. And because of the velocity of the change, we cannot attribute that to generational replacement. This isn’t a case of old conservative people dying and being replaced by young liberals. That process is downright glacial. No, instead this is lots and lots of people changing their minds. Probably at least 30% of the country.
However, I took a look at the data that the General Social Survey collected in both 2021 and 2022. While the LGBT community made huge strides in advocating for the rights of same-sex couples, that came to a screeching halt in 2021 and 2022. Support for homosexual couples having the right to marry hit a brick wall at about 65%. The latest number stands at 67% - no different than it was four years earlier. Between 2014 and 2018, support rose 11 points. Between 2018 and 2022, it declined by a point.
Who is changing their mind here? Let me show you.

Partisanship is absolutely playing a role in this shift in recent years. It’s evident from this data that Democrats have always been more supportive of LGBT rights. A majority of Democrats were in favor of same-sex marriage in 2008, it took another decade for Republican support to rise above 50%. You can see that the Democrat and Republican lines move in a pretty consistent trajectory from 2004 even through 2016. For the Democrats that line has continued to move upward even in the last two survey waves. The same is not true for the Republicans - their support has dropped from the 2018 highs.
I was interested in the partisan gap on same-sex marriage, so I just subtracted the share of Democrats who were in favor from the share of Republicans who believed the same way.
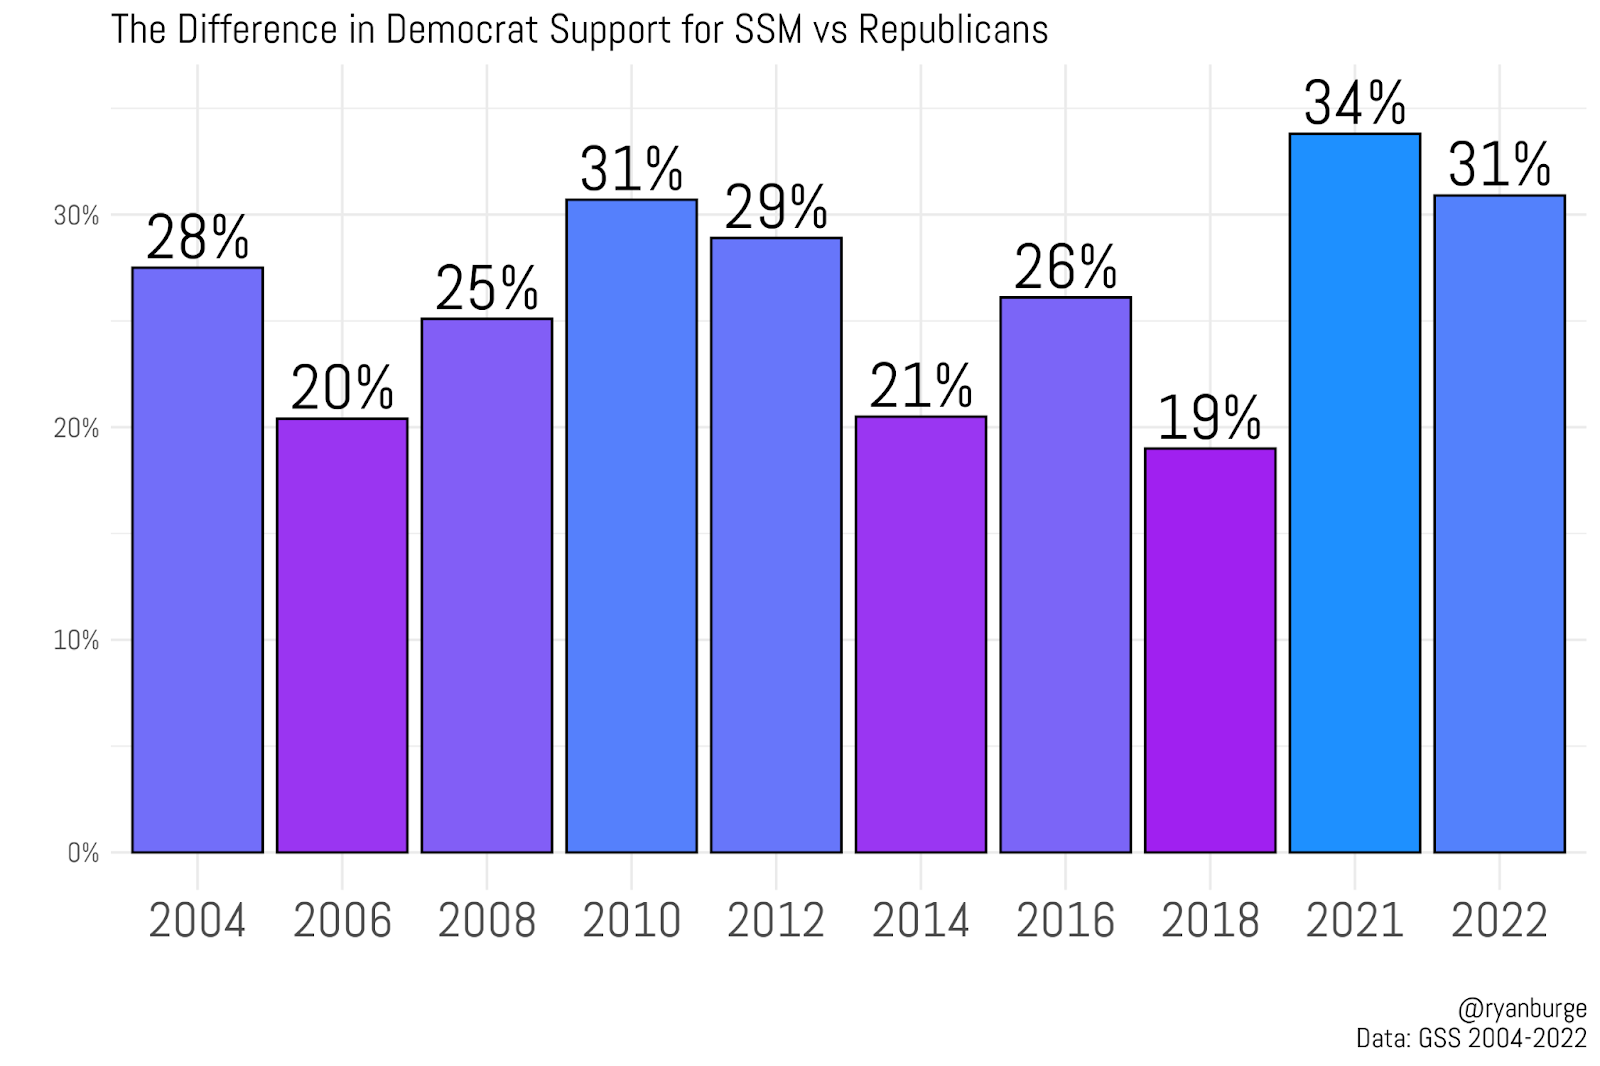
There’s always been a persistent gap. Between 2004 and 2012, the gap was about 25 percentage points. I think it’s fair to say that the period between 2014 and 2018 was a moment when the partisan gap narrowed significantly. In 2018, it was just 19 percentage points. It looks like the Republicans were coming around to the Democrats on the issue of LGBT rights. However, you can clearly see that this convergence was short lived. In 2021, the partisan gap on same-sex marriage was 34 points - the highest on record. In 2022, it was 31 points. The parties are moving in opposite directions on this.
But, partisanship often runs on the same lines as religion. So, let me show you the support for same-sex marriage among six religious traditions since 2004.
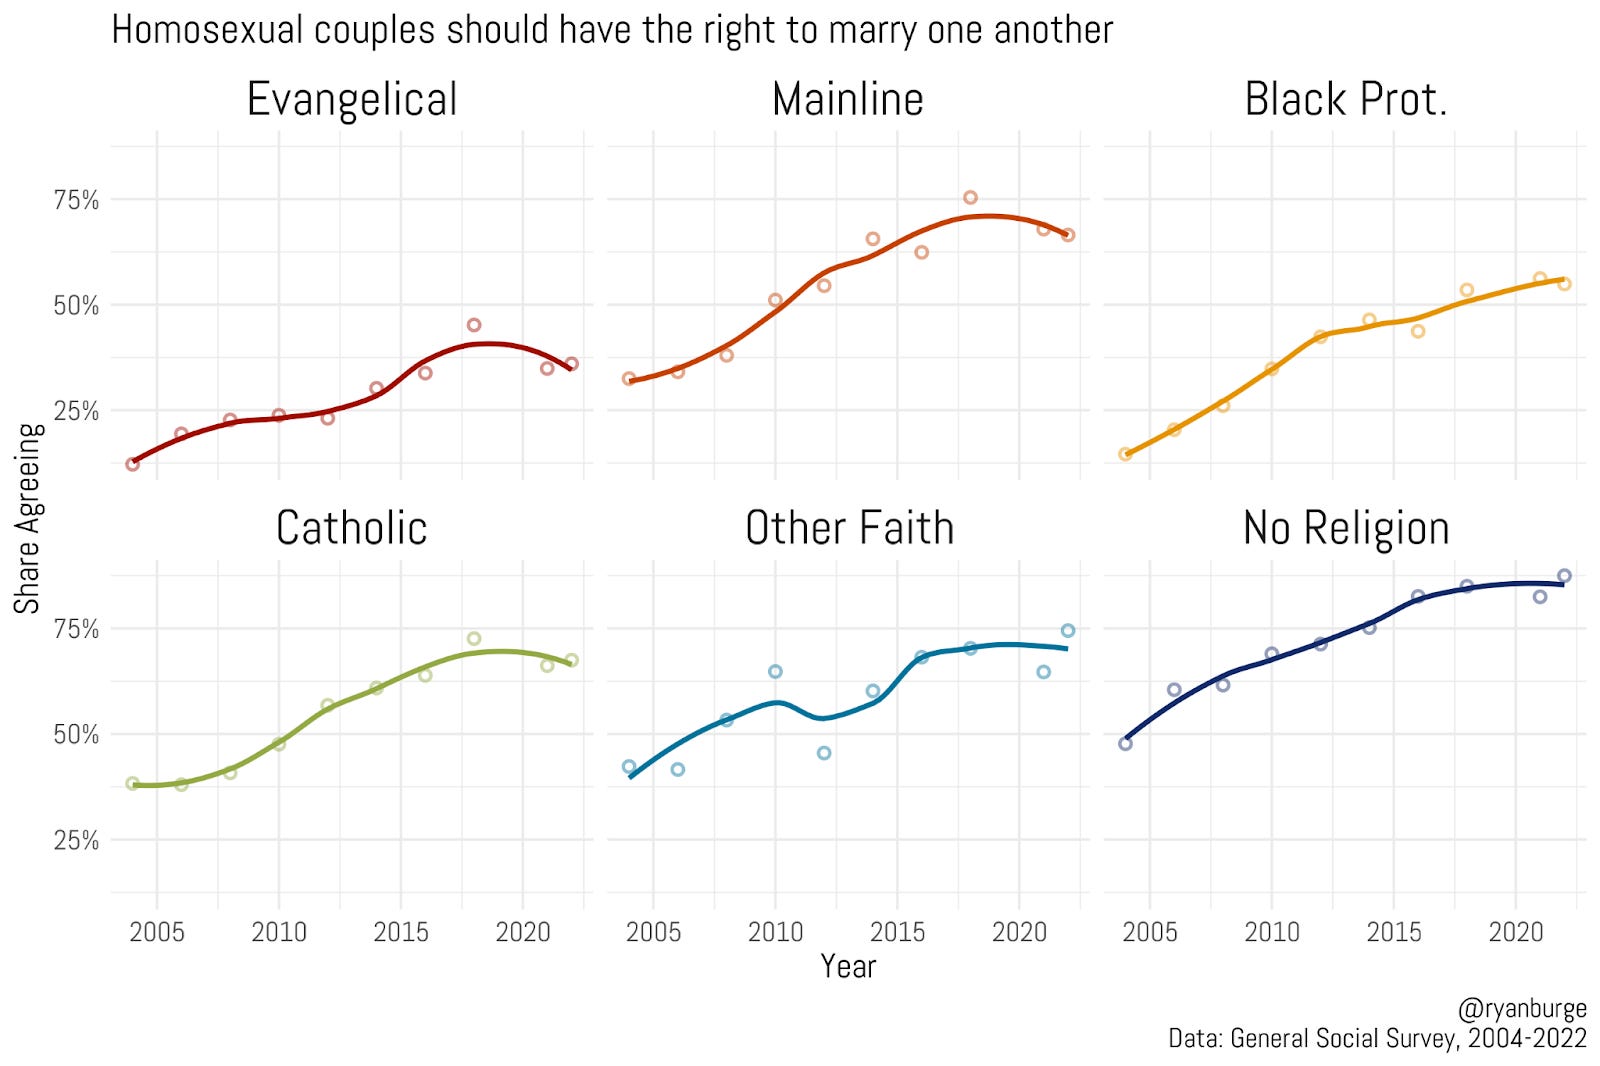
I think it’s helpful for me to spell out the share of each faith tradition that supported same-sex marriage in 2018, 2021, and 2022.
Evangelicals: 45% → 35% → 36%
Mainline: 75% → 68% → 67%
Black Prot: 54% → 56% → 55%
Catholic: 73% → 66% → 68%
Other Faith: 70% → 65% → 75%
No Religion: 85% → 83% → 88%
Notice anything there? Yeah, several Christian groups have reversed themselves on same-sex marriage. For evangelicals, support has dropped by ten points between 2018 and 2022. For the mainline, it’s down about 8 points. For Catholics, it’s down about six points. For the other groups (Black Protestants, Other Faith, and No Religion), there hasn’t been a whole lot of movement. It looks like the white majority Christian groups have moved clearly to the right on same-sex marriage in the last couple of years.
Let’s dig down another layer on this by breaking the sample into those who attend religious services weekly versus those who attend less often in each of those three traditions.
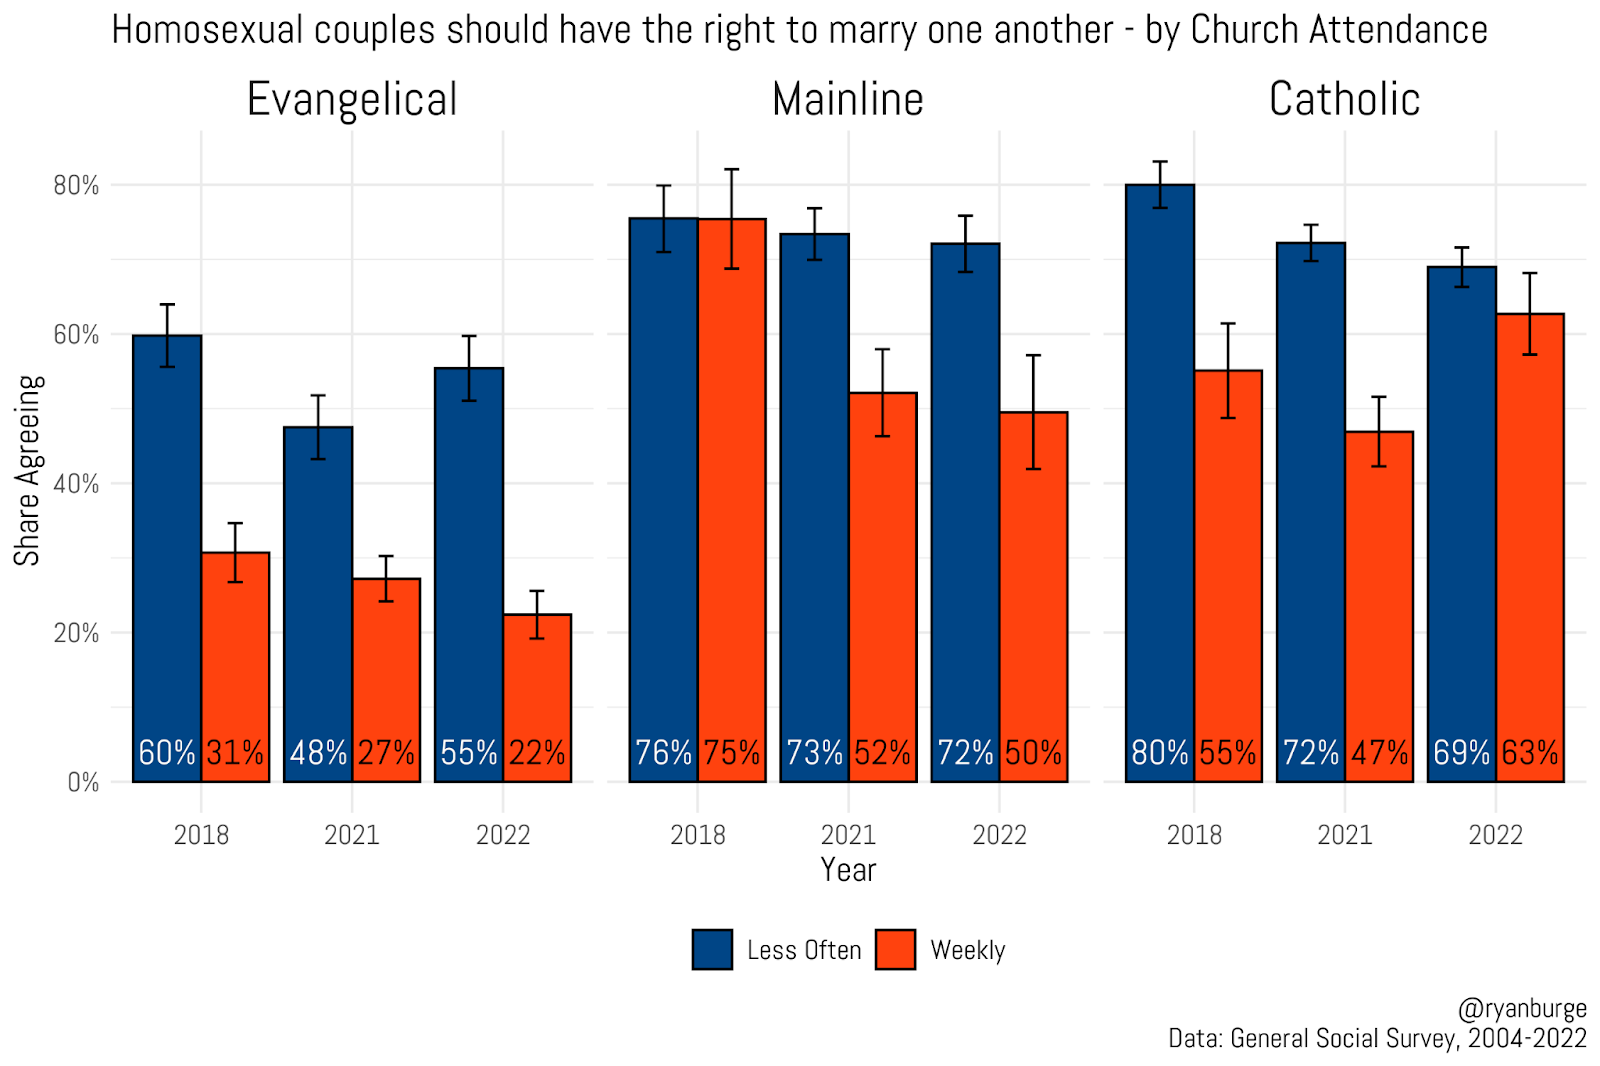
This story is starting to get really interesting now. For evangelicals who attend less than weekly, support for same-sex marriage has not changed in a statistically significant way between 2018 and 2022. But for the more active evangelicals, support for same-sex marriage has declined noticeably from 31% in 2018 to just 22% in the 2022 data. You also see that same pattern among the mainline, too. For mainliners who don’t attend that much, support hasn’t really moved. Yet, for those mainline Protestants who attend weekly there's been a huge drop off in support - from 75% in 2018 to just 50% in 2022. I do need to contextualize this a little bit, though. Only 9% of Americans are mainline Protestants and about a third are weekly attenders, so that subgroup only represents 3% of the total population of America. But they have clearly shifted to the right on this issue in recent years.
Are There Folks Who Oppose Homosexuality But Support Same-Sex Marriage?

Don’t forget that I am offering a discount on subscriptions through December 25th - $40 for the year. You can take advantage through this link.
The Catholic graph makes me scratch my head a bit. For them, the big decline is among those Catholics who don’t attend that often. They went from 80% support to just 69% in a four year period of time. At the same time, weekly attending Catholics have remained relatively stable. What’s just bizarre is that there’s no statistically significant difference in support for same-sex marriage among Catholics based on Mass attendance. That’s not the case for evangelicals and mainline Protestants.
Let’s look at age now.
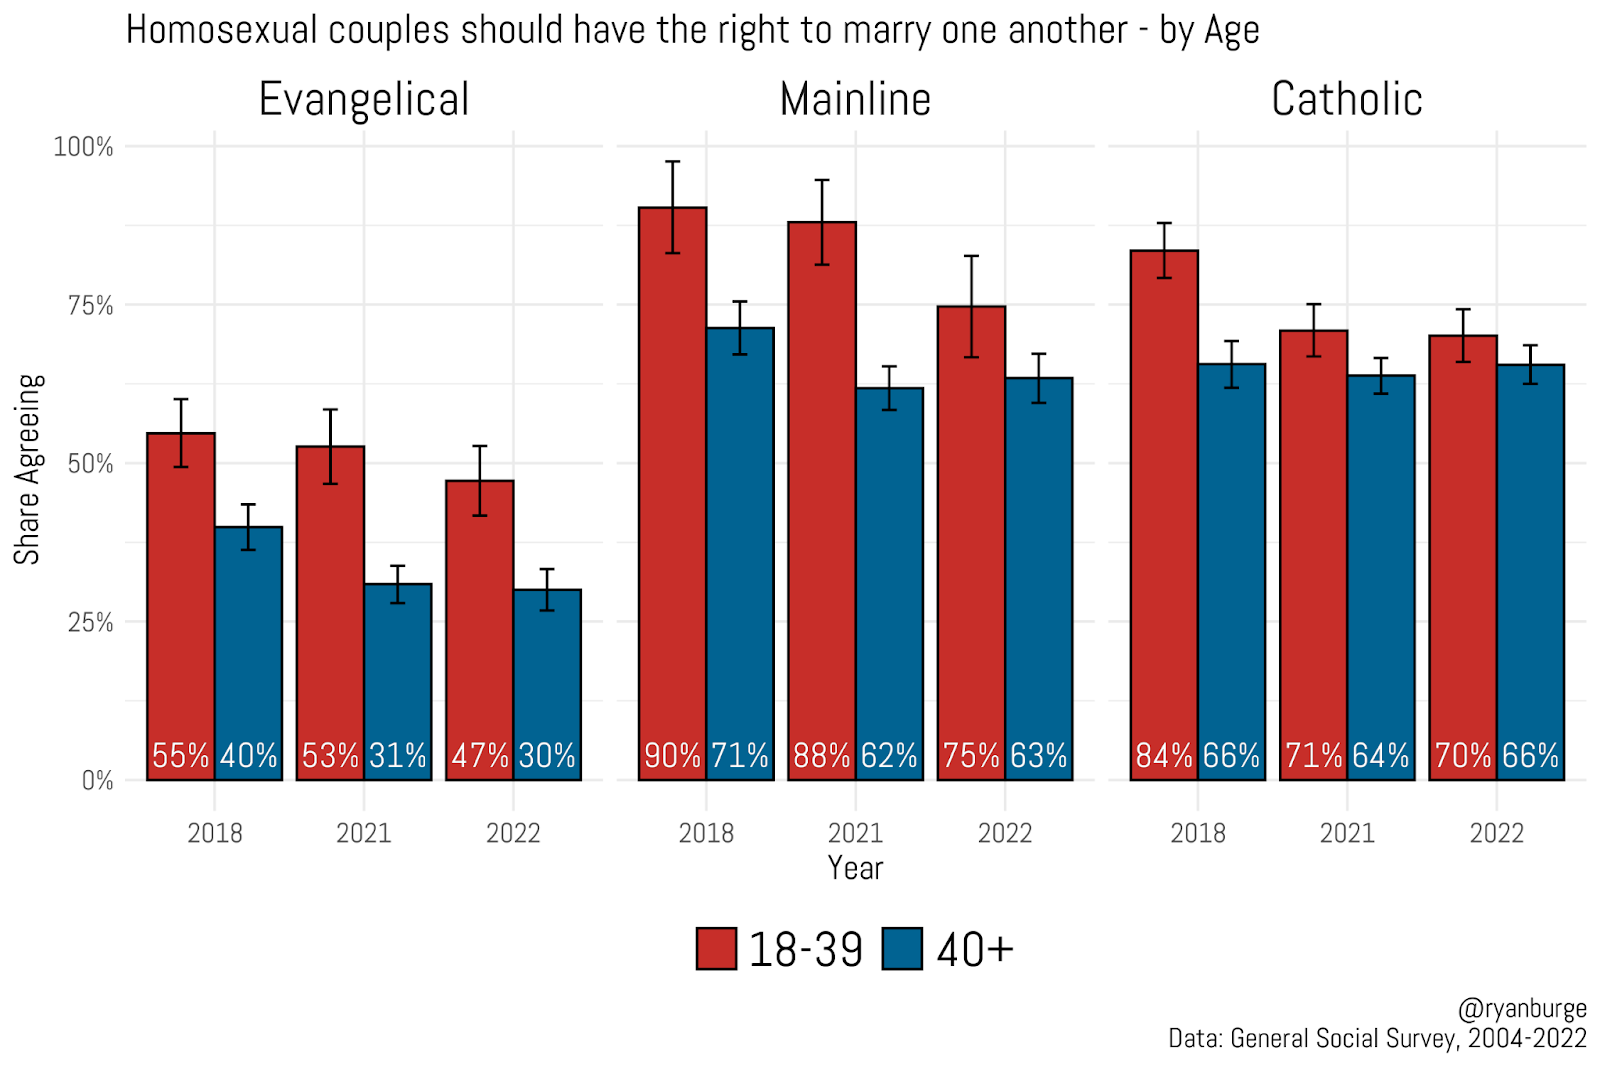
Okay, this one is going to make some real headlines. For evangelical Protestants, support for same-sex marriage hasn’t moved in a statistically significant way among those under the age of 40. But for those who are at least forty years old, support has decreased by ten points (from 40% to 30%) between 2018 and 2022. For the mainline, there’s been a decline in support for same-sex marriage among the younger set. They went from 90% in favor in 2018 to 75% in favor in 2022. But, again, there’s a big caveat here. There are less than 60 young mainline Protestants in the entire sample in 2022. They are an incredibly small sliver of the population.
For older Catholics, there’s been no shift at all in public opinion about same-sex marriage. It’s been 66% of the sample over the last three survey cycles. However, check out those young Catholics. In 2018, 84% of them believed same-sex couples should have the right to marry. By 2022, it had dropped to just 70% and that change is statistically significant.
The movement to extend marriage to the same-sex community enjoyed a two decade run of success. Clearly they won over hearts and minds by the tens of millions. In 2004, even liberal states like Oregon voted for the traditional view of marriage. By 2015, the Supreme Court ruled that same-sex couples had the right to marriage and it seemed like the culture warriors just moved on from that discussion. Donald Trump himself called it “settled law” in 2016. It looks like there’s been a backlash now. Evangelicals, Mainline Protestants, and Catholics have shifted between 5 and 10 points in the other direction in just the last couple of years.
That seems to be driven by an odd coalition of Christian groups. It’s religiously engaged evangelicals and mainline Protestants. But there’s also been movement among older evangelicals and mainline Protestants, but also younger Catholics. What ties these groups together is worthy of a whole bunch of think pieces. If this is a true reversal in opinion, it’s impossible to know at this stage. It could be just a blip in a larger trend toward LGBT rights. However, it serves as a fascinating case study of how rapid social change may lead to a significant backlash.
Code for this post can be found here.
I'd guess that this is mostly a backlash against transgenderism.
Before Obergefell, the most salient identity components of "LGBT+", for most Americans, were Lesbian and Gay, who could be portrayed as generally normal and tolerable.
After that decision, Trans became more salient, as Bisexuals and other niche identities really don't provide fodder for GLAAD and Human Rights Campaign activism, media interest, etc. Since it's much harder to portray sterilizing/mutilating healthy teenagers (mostly girls) or allowing extremely masculine men in dresses to use women's locker rooms as normal and tolerable, there's been a backlash.
As to why it's spilled over to SSM which isn't exactly a trans issue: the idea of treating LGBT as a coherent whole rather than a group of loose allies has stuck. There are some activists who use names like "Gays Against Groomers" and "LGB Drop The T" in an effort to distance their causes from the trans stuff, but they haven't had a whole lot of success.
Is this a true reversal or is this a reflection of the percentage of people who have left the church between 2018-2022? If those who are affirming left because of disillusionment with the church over treatment of LGBTQ people or politics it would mean the traditionalists who remained would now comprise a higher percentage in those faith circles. What percentage of evangelicals or mainliners left the church between 2018 and 2022?